

Key Insights
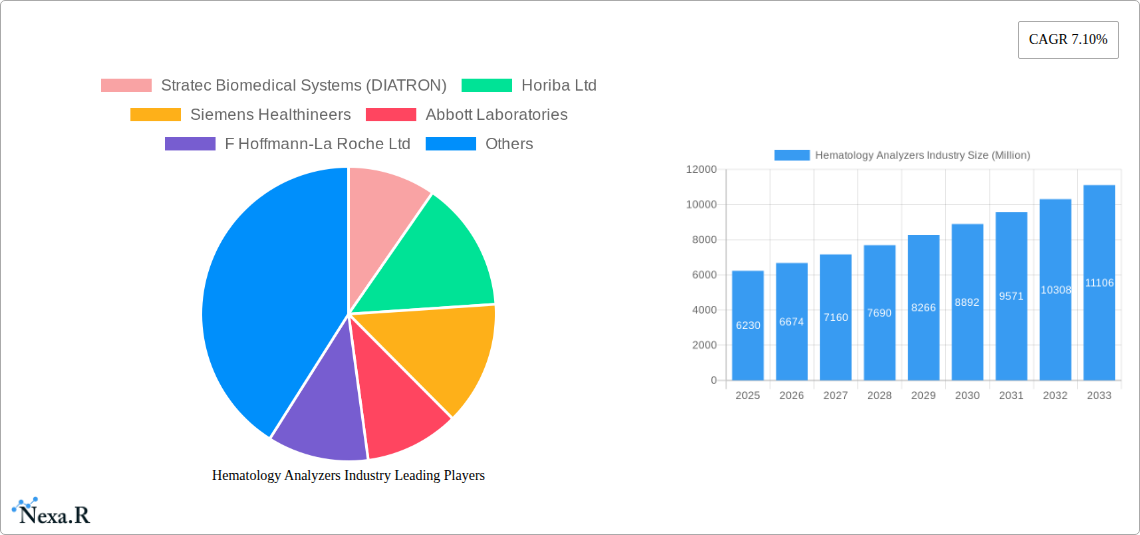
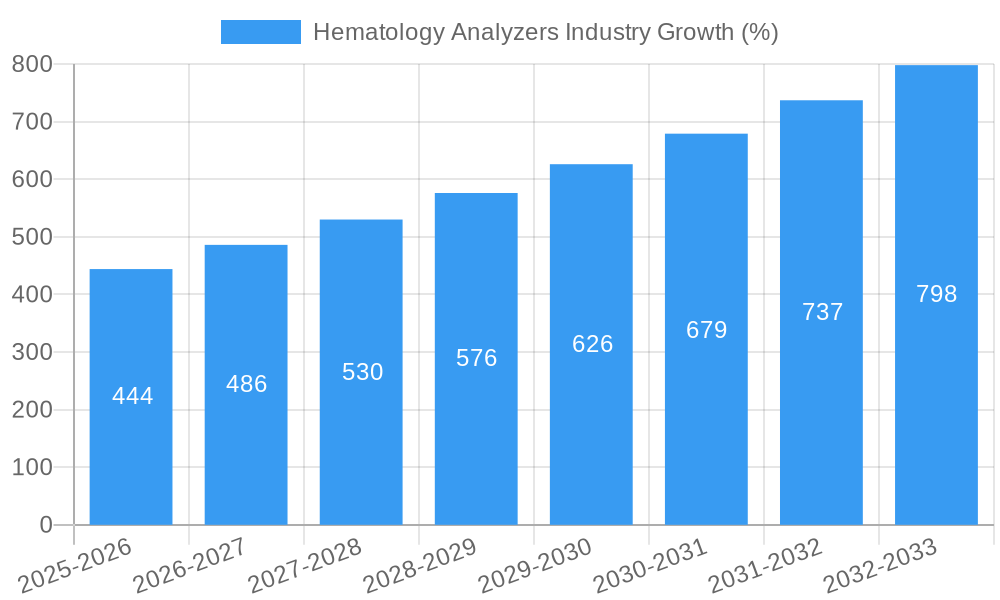
The global hematology analyzers market, valued at $6.23 billion in 2025, is projected to experience robust growth, driven by a compound annual growth rate (CAGR) of 7.10% from 2025 to 2033. This expansion is fueled by several key factors. Technological advancements leading to the development of automated, high-throughput analyzers with improved accuracy and efficiency are significantly impacting the market. The increasing prevalence of hematological disorders, coupled with the rising geriatric population susceptible to such conditions, is driving demand for rapid and accurate diagnostic tools. Furthermore, the growing adoption of point-of-care testing (POCT) in hospitals and clinics is contributing to market growth, offering faster diagnosis and improved patient outcomes. Stringent regulatory approvals and rising healthcare expenditure in developed and emerging economies are further bolstering market expansion. However, high initial investment costs associated with advanced hematology analyzers and the potential for skilled labor shortages may act as restraints. The market is segmented by product type (instruments and reagents/services), end-user (hospitals, clinical laboratories, research institutes, and other end-users), and geography, with North America and Europe currently holding significant market share. The competitive landscape is characterized by the presence of established players such as Siemens Healthineers, Abbott Laboratories, and Roche, alongside emerging companies offering innovative solutions. The forecast period anticipates continued growth, driven by ongoing technological innovation and increasing healthcare investment globally.
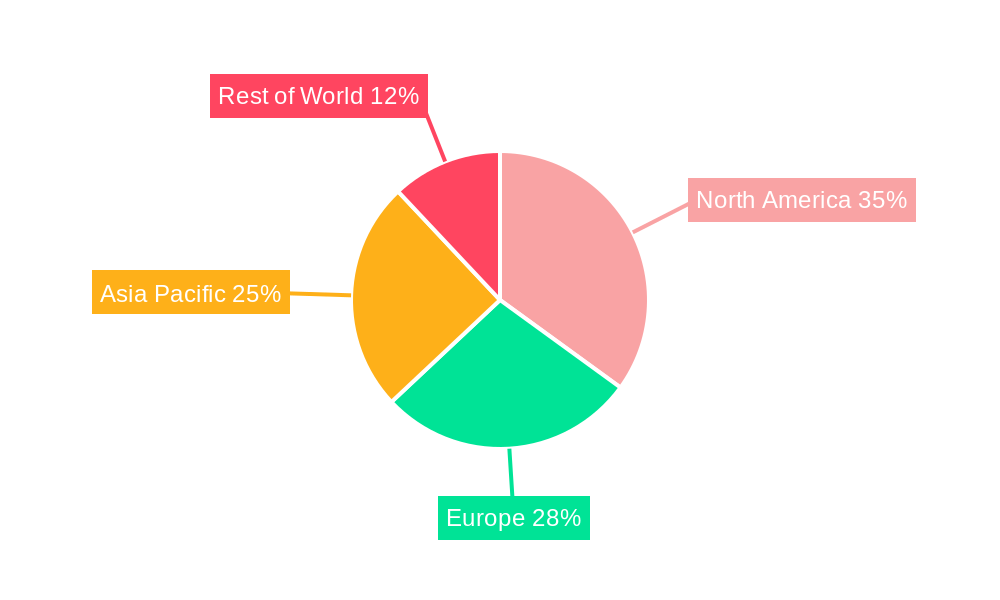
The market's segmentation reveals a strong emphasis on advanced instruments, reflecting the industry's shift toward automation and high-throughput analysis. Hospitals and clinical laboratories represent the largest end-user segments, owing to their high volume of hematological tests. Regional variations are expected, with North America and Europe maintaining strong growth due to their advanced healthcare infrastructure and high adoption of cutting-edge technologies. However, the Asia-Pacific region is poised for significant growth, driven by rising healthcare expenditure and increasing awareness of hematological disorders. Strategic partnerships, acquisitions, and product launches by key market players are shaping the competitive dynamics, with a focus on enhancing product portfolios and expanding market reach. The overall outlook for the hematology analyzers market remains highly positive, driven by technological advancements, increasing disease prevalence, and growing healthcare investments across the globe.
Hematology Analyzers Industry Market Report: 2019-2033
This comprehensive report provides an in-depth analysis of the Hematology Analyzers market, encompassing historical data (2019-2024), current estimates (2025), and future projections (2025-2033). The report segments the market by product type (Instruments, Reagents, Services), end-user (Hospitals, Clinical Laboratories, Research Institutes, Other End Users), and key geographic regions, offering a granular view of this dynamic industry. Leading players like Stratec Biomedical Systems (DIATRON), Horiba Ltd, Siemens Healthineers, Abbott Laboratories, F Hoffmann-La Roche Ltd, Ortho Clinical Diagnostics, Boule Diagnostics AB, Bio-Rad Laboratories, Beckman Coulter Inc (Danaher Corporation), Sysmex Corporation, Accurex Biomedical Pvt Ltd, and Nihon Kohden Corporation are profiled, highlighting their market strategies and contributions. The report's value is in Million units.
Hematology Analyzers Industry Market Dynamics & Structure
The hematology analyzers market is characterized by moderate concentration, with several multinational corporations holding significant market share. Technological innovation, particularly in automation, miniaturization, and advanced diagnostic capabilities, is a primary growth driver. Stringent regulatory approvals (e.g., FDA, CE marking) influence market entry and product adoption. Competitive substitutes, such as manual cell counting methods, exist but are gradually being replaced due to improved accuracy and efficiency offered by automated analyzers. The end-user demographics are heavily skewed towards hospitals and clinical laboratories, reflecting the crucial role of hematological testing in disease diagnosis and management. M&A activity within the sector has been relatively low in recent years, with xx deals recorded between 2019 and 2024, representing a xx% market share shift.
- Market Concentration: Moderately concentrated, with top 5 players holding xx% market share in 2024.
- Technological Innovation: Focus on automation, point-of-care testing, and AI-powered diagnostics.
- Regulatory Landscape: Stringent regulatory frameworks influence product development and market entry.
- Competitive Substitutes: Manual methods face declining adoption due to analyzer advantages.
- End-User Demographics: Hospitals and clinical laboratories represent the largest user base.
- M&A Activity: xx deals between 2019-2024, resulting in a xx% market share shift. Innovation barriers include high R&D costs and regulatory hurdles.
Hematology Analyzers Industry Growth Trends & Insights
The global hematology analyzers market exhibited a CAGR of xx% during the historical period (2019-2024), reaching an estimated value of xx million units in 2025. This growth is attributed to factors such as the rising prevalence of blood-related disorders, increasing demand for accurate and rapid diagnostic tools, and technological advancements leading to improved analyzer performance and affordability. The adoption rate of hematology analyzers, particularly in developing economies, is increasing steadily. Technological disruptions, such as the introduction of advanced analytical techniques and AI-powered diagnostic software, are further accelerating market growth. Consumer behavior shifts toward personalized medicine and preventive healthcare are also boosting demand. The market is projected to maintain a robust CAGR of xx% during the forecast period (2025-2033), driven by similar factors. The market penetration rate stands at xx% in 2025, expected to reach xx% by 2033.
Dominant Regions, Countries, or Segments in Hematology Analyzers Industry
North America currently holds the largest market share within the hematology analyzers industry, followed by Europe and Asia-Pacific. The dominance of North America can be attributed to factors such as high healthcare expenditure, advanced healthcare infrastructure, and the presence of major market players. The hospitals segment accounts for the largest share of end-users, driven by increasing patient volumes and the crucial role of hematology testing in various clinical settings. Among the product types, instruments contribute significantly to the market revenue, although the reagents and services segments are experiencing rapid growth due to the increasing usage of hematology analyzers.
- Key Drivers in North America: High healthcare spending, established healthcare infrastructure, and presence of major players.
- Growth Potential in Asia-Pacific: Rising healthcare expenditure, increasing prevalence of blood disorders, and expanding healthcare infrastructure.
- Hospitals Segment Dominance: Highest volume of hematological testing compared to other end-users.
- Instruments Segment Revenue: Largest revenue contributor, complemented by the growth of reagents and services.
Hematology Analyzers Industry Product Landscape
The hematology analyzers market features a range of products, from basic CBC analyzers to sophisticated automated systems capable of performing a wide array of tests. Innovations include advanced analytical techniques (e.g., flow cytometry, impedance), improved automation for higher throughput, and integrated software for data analysis and management. Unique selling propositions often focus on speed, accuracy, ease of use, and cost-effectiveness. Technological advancements constantly push boundaries, improving the sensitivity, specificity, and turnaround time of hematological tests.
Key Drivers, Barriers & Challenges in Hematology Analyzers Industry
Key Drivers: Rising prevalence of blood disorders, technological advancements, increasing healthcare expenditure, and the growing demand for rapid and accurate diagnostics. Government initiatives promoting preventative healthcare and investments in healthcare infrastructure also contribute significantly.
Challenges: High initial investment costs for advanced analyzers can present a barrier to entry for smaller clinical laboratories or hospitals in resource-constrained settings. Stringent regulatory approvals and the need for skilled technicians are further challenges. Supply chain disruptions can impact the availability of reagents and parts, affecting the performance of the analyzers.
Emerging Opportunities in Hematology Analyzers Industry
Emerging opportunities include the increasing adoption of point-of-care testing (POCT) devices, the integration of artificial intelligence (AI) and machine learning (ML) for improved diagnostics and data analysis, and the development of more sophisticated analyzers capable of detecting rare blood disorders. The untapped potential of developing markets presents an opportunity for market expansion, as well as focusing on personalized medicine solutions.
Growth Accelerators in the Hematology Analyzers Industry
Long-term growth will be driven by continuous technological advancements, including the development of more compact and user-friendly devices suitable for diverse settings. Strategic partnerships between analyzer manufacturers and reagent suppliers, along with effective market expansion strategies targeting underserved regions, will play a crucial role in accelerating growth.
Key Players Shaping the Hematology Analyzers Industry Market
- Stratec Biomedical Systems (DIATRON)
- Horiba Ltd
- Siemens Healthineers
- Abbott Laboratories
- F Hoffmann-La Roche Ltd
- Ortho Clinical Diagnostics
- Boule Diagnostics AB
- Bio-Rad Laboratories
- Beckman Coulter Inc (Danaher Corporation)
- Sysmex Corporation
- Accurex Biomedical Pvt Ltd
- Nihon Kohden Corporation
Notable Milestones in Hematology Analyzers Industry Sector
- May 2022: Nihon Kohden India establishes a new hematology analyzer reagent factory, expanding its manufacturing capacity and market reach.
- March 2022: Mindray launches the BC-700 Series, a revolutionary hematology analyzer series, enhancing CBC and ESR testing capabilities.
In-Depth Hematology Analyzers Industry Market Outlook
The future of the hematology analyzers market is promising, driven by sustained technological innovation, increased healthcare spending globally, and the growing awareness of the importance of early and accurate diagnosis of blood-related disorders. Strategic investments in R&D, coupled with effective market penetration strategies, will further solidify the growth trajectory of this vital sector. Opportunities exist for companies to focus on developing innovative solutions catering to the needs of diverse healthcare settings, ranging from large hospitals to small clinics and point-of-care environments.
Hematology Analyzers Industry Segmentation
-
1. Product Type
-
1.1. Instruments
- 1.1.1. 3 Part Hematology Analyzer
- 1.1.2. 5 Part Hematology Analyzer
- 1.1.3. Point-of-care Testing Hematology Analyzers
- 1.1.4. Others
- 1.2. Reagents
- 1.3. Services
-
1.1. Instruments
-
2. End User
- 2.1. Hospitals
- 2.2. Clinical Laboratories
- 2.3. Research Institutes
- 2.4. Other End Users
Hematology Analyzers Industry Segmentation By Geography
-
1. North America
- 1.1. United States
- 1.2. Canada
- 1.3. Mexico
-
2. Europe
- 2.1. Germany
- 2.2. United Kingdom
- 2.3. France
- 2.4. Italy
- 2.5. Spain
- 2.6. Rest of Europe
-
3. Asia Pacific
- 3.1. China
- 3.2. Japan
- 3.3. India
- 3.4. Australia
- 3.5. South Korea
- 3.6. Rest of Asia Pacific
-
4. Middle East and Africa
- 4.1. GCC
- 4.2. South Africa
- 4.3. Rest of Middle East and Africa
-
5. South America
- 5.1. Brazil
- 5.2. Argentina
- 5.3. Rest of South America
Hematology Analyzers Industry REPORT HIGHLIGHTS
| Aspects | Details |
|---|---|
| Study Period | 2019-2033 |
| Base Year | 2024 |
| Estimated Year | 2025 |
| Forecast Period | 2025-2033 |
| Historical Period | 2019-2024 |
| Growth Rate | CAGR of 7.10% from 2019-2033 |
| Segmentation |
|
Table of Contents
- 1. Introduction
- 1.1. Research Scope
- 1.2. Market Segmentation
- 1.3. Research Methodology
- 1.4. Definitions and Assumptions
- 2. Executive Summary
- 2.1. Introduction
- 3. Market Dynamics
- 3.1. Introduction
- 3.2. Market Drivers
- 3.2.1. Rising Burden of Blood Disorders; Increasing Technological Advancements and Rising Adoption Rates of Automated Hematology Instruments
- 3.3. Market Restrains
- 3.3.1. High Cost of Hematology Analyzers; Time-consuming and Stringent Rregulatory Policies
- 3.4. Market Trends
- 3.4.1. 3 Part Hematology Analyzer is the Segment by Instruments Expected to Hold Significant Market Share Over the Forecast Period
- 4. Market Factor Analysis
- 4.1. Porters Five Forces
- 4.2. Supply/Value Chain
- 4.3. PESTEL analysis
- 4.4. Market Entropy
- 4.5. Patent/Trademark Analysis
- 5. Global Hematology Analyzers Industry Analysis, Insights and Forecast, 2019-2031
- 5.1. Market Analysis, Insights and Forecast - by Product Type
- 5.1.1. Instruments
- 5.1.1.1. 3 Part Hematology Analyzer
- 5.1.1.2. 5 Part Hematology Analyzer
- 5.1.1.3. Point-of-care Testing Hematology Analyzers
- 5.1.1.4. Others
- 5.1.2. Reagents
- 5.1.3. Services
- 5.1.1. Instruments
- 5.2. Market Analysis, Insights and Forecast - by End User
- 5.2.1. Hospitals
- 5.2.2. Clinical Laboratories
- 5.2.3. Research Institutes
- 5.2.4. Other End Users
- 5.3. Market Analysis, Insights and Forecast - by Region
- 5.3.1. North America
- 5.3.2. Europe
- 5.3.3. Asia Pacific
- 5.3.4. Middle East and Africa
- 5.3.5. South America
- 5.1. Market Analysis, Insights and Forecast - by Product Type
- 6. North America Hematology Analyzers Industry Analysis, Insights and Forecast, 2019-2031
- 6.1. Market Analysis, Insights and Forecast - by Product Type
- 6.1.1. Instruments
- 6.1.1.1. 3 Part Hematology Analyzer
- 6.1.1.2. 5 Part Hematology Analyzer
- 6.1.1.3. Point-of-care Testing Hematology Analyzers
- 6.1.1.4. Others
- 6.1.2. Reagents
- 6.1.3. Services
- 6.1.1. Instruments
- 6.2. Market Analysis, Insights and Forecast - by End User
- 6.2.1. Hospitals
- 6.2.2. Clinical Laboratories
- 6.2.3. Research Institutes
- 6.2.4. Other End Users
- 6.1. Market Analysis, Insights and Forecast - by Product Type
- 7. Europe Hematology Analyzers Industry Analysis, Insights and Forecast, 2019-2031
- 7.1. Market Analysis, Insights and Forecast - by Product Type
- 7.1.1. Instruments
- 7.1.1.1. 3 Part Hematology Analyzer
- 7.1.1.2. 5 Part Hematology Analyzer
- 7.1.1.3. Point-of-care Testing Hematology Analyzers
- 7.1.1.4. Others
- 7.1.2. Reagents
- 7.1.3. Services
- 7.1.1. Instruments
- 7.2. Market Analysis, Insights and Forecast - by End User
- 7.2.1. Hospitals
- 7.2.2. Clinical Laboratories
- 7.2.3. Research Institutes
- 7.2.4. Other End Users
- 7.1. Market Analysis, Insights and Forecast - by Product Type
- 8. Asia Pacific Hematology Analyzers Industry Analysis, Insights and Forecast, 2019-2031
- 8.1. Market Analysis, Insights and Forecast - by Product Type
- 8.1.1. Instruments
- 8.1.1.1. 3 Part Hematology Analyzer
- 8.1.1.2. 5 Part Hematology Analyzer
- 8.1.1.3. Point-of-care Testing Hematology Analyzers
- 8.1.1.4. Others
- 8.1.2. Reagents
- 8.1.3. Services
- 8.1.1. Instruments
- 8.2. Market Analysis, Insights and Forecast - by End User
- 8.2.1. Hospitals
- 8.2.2. Clinical Laboratories
- 8.2.3. Research Institutes
- 8.2.4. Other End Users
- 8.1. Market Analysis, Insights and Forecast - by Product Type
- 9. Middle East and Africa Hematology Analyzers Industry Analysis, Insights and Forecast, 2019-2031
- 9.1. Market Analysis, Insights and Forecast - by Product Type
- 9.1.1. Instruments
- 9.1.1.1. 3 Part Hematology Analyzer
- 9.1.1.2. 5 Part Hematology Analyzer
- 9.1.1.3. Point-of-care Testing Hematology Analyzers
- 9.1.1.4. Others
- 9.1.2. Reagents
- 9.1.3. Services
- 9.1.1. Instruments
- 9.2. Market Analysis, Insights and Forecast - by End User
- 9.2.1. Hospitals
- 9.2.2. Clinical Laboratories
- 9.2.3. Research Institutes
- 9.2.4. Other End Users
- 9.1. Market Analysis, Insights and Forecast - by Product Type
- 10. South America Hematology Analyzers Industry Analysis, Insights and Forecast, 2019-2031
- 10.1. Market Analysis, Insights and Forecast - by Product Type
- 10.1.1. Instruments
- 10.1.1.1. 3 Part Hematology Analyzer
- 10.1.1.2. 5 Part Hematology Analyzer
- 10.1.1.3. Point-of-care Testing Hematology Analyzers
- 10.1.1.4. Others
- 10.1.2. Reagents
- 10.1.3. Services
- 10.1.1. Instruments
- 10.2. Market Analysis, Insights and Forecast - by End User
- 10.2.1. Hospitals
- 10.2.2. Clinical Laboratories
- 10.2.3. Research Institutes
- 10.2.4. Other End Users
- 10.1. Market Analysis, Insights and Forecast - by Product Type
- 11. North America Hematology Analyzers Industry Analysis, Insights and Forecast, 2019-2031
- 11.1. Market Analysis, Insights and Forecast - By Country/Sub-region
- 11.1.1 United States
- 11.1.2 Canada
- 11.1.3 Mexico
- 12. South America Hematology Analyzers Industry Analysis, Insights and Forecast, 2019-2031
- 12.1. Market Analysis, Insights and Forecast - By Country/Sub-region
- 12.1.1 Brazil
- 12.1.2 Mexico
- 12.1.3 Rest of South America
- 13. Europe Hematology Analyzers Industry Analysis, Insights and Forecast, 2019-2031
- 13.1. Market Analysis, Insights and Forecast - By Country/Sub-region
- 13.1.1 United Kingdom
- 13.1.2 Germany
- 13.1.3 France
- 13.1.4 Italy
- 13.1.5 Spain
- 13.1.6 Russia
- 13.1.7 Rest of Europe
- 14. Asia Pacific Hematology Analyzers Industry Analysis, Insights and Forecast, 2019-2031
- 14.1. Market Analysis, Insights and Forecast - By Country/Sub-region
- 14.1.1 China
- 14.1.2 Japan
- 14.1.3 India
- 14.1.4 South Korea
- 14.1.5 Taiwan
- 14.1.6 Australia
- 14.1.7 Rest of Asia-Pacific
- 15. MEA Hematology Analyzers Industry Analysis, Insights and Forecast, 2019-2031
- 15.1. Market Analysis, Insights and Forecast - By Country/Sub-region
- 15.1.1 Middle East
- 15.1.2 Africa
- 16. Competitive Analysis
- 16.1. Global Market Share Analysis 2024
- 16.2. Company Profiles
- 16.2.1 Stratec Biomedical Systems (DIATRON)
- 16.2.1.1. Overview
- 16.2.1.2. Products
- 16.2.1.3. SWOT Analysis
- 16.2.1.4. Recent Developments
- 16.2.1.5. Financials (Based on Availability)
- 16.2.2 Horiba Ltd
- 16.2.2.1. Overview
- 16.2.2.2. Products
- 16.2.2.3. SWOT Analysis
- 16.2.2.4. Recent Developments
- 16.2.2.5. Financials (Based on Availability)
- 16.2.3 Siemens Healthineers
- 16.2.3.1. Overview
- 16.2.3.2. Products
- 16.2.3.3. SWOT Analysis
- 16.2.3.4. Recent Developments
- 16.2.3.5. Financials (Based on Availability)
- 16.2.4 Abbott Laboratories
- 16.2.4.1. Overview
- 16.2.4.2. Products
- 16.2.4.3. SWOT Analysis
- 16.2.4.4. Recent Developments
- 16.2.4.5. Financials (Based on Availability)
- 16.2.5 F Hoffmann-La Roche Ltd
- 16.2.5.1. Overview
- 16.2.5.2. Products
- 16.2.5.3. SWOT Analysis
- 16.2.5.4. Recent Developments
- 16.2.5.5. Financials (Based on Availability)
- 16.2.6 Ortho Clinical Diagnostics
- 16.2.6.1. Overview
- 16.2.6.2. Products
- 16.2.6.3. SWOT Analysis
- 16.2.6.4. Recent Developments
- 16.2.6.5. Financials (Based on Availability)
- 16.2.7 Boule Diagnostics AB
- 16.2.7.1. Overview
- 16.2.7.2. Products
- 16.2.7.3. SWOT Analysis
- 16.2.7.4. Recent Developments
- 16.2.7.5. Financials (Based on Availability)
- 16.2.8 Bio-Rad Laboratories
- 16.2.8.1. Overview
- 16.2.8.2. Products
- 16.2.8.3. SWOT Analysis
- 16.2.8.4. Recent Developments
- 16.2.8.5. Financials (Based on Availability)
- 16.2.9 Beckman Coulter Inc (Danaher Corporation)
- 16.2.9.1. Overview
- 16.2.9.2. Products
- 16.2.9.3. SWOT Analysis
- 16.2.9.4. Recent Developments
- 16.2.9.5. Financials (Based on Availability)
- 16.2.10 Sysmex Corporation
- 16.2.10.1. Overview
- 16.2.10.2. Products
- 16.2.10.3. SWOT Analysis
- 16.2.10.4. Recent Developments
- 16.2.10.5. Financials (Based on Availability)
- 16.2.11 Accurex Biomedical Pvt Ltd
- 16.2.11.1. Overview
- 16.2.11.2. Products
- 16.2.11.3. SWOT Analysis
- 16.2.11.4. Recent Developments
- 16.2.11.5. Financials (Based on Availability)
- 16.2.12 Nihon Kohden Corporation
- 16.2.12.1. Overview
- 16.2.12.2. Products
- 16.2.12.3. SWOT Analysis
- 16.2.12.4. Recent Developments
- 16.2.12.5. Financials (Based on Availability)
- 16.2.1 Stratec Biomedical Systems (DIATRON)
List of Figures
- Figure 1: Global Hematology Analyzers Industry Revenue Breakdown (Million, %) by Region 2024 & 2032
- Figure 2: Global Hematology Analyzers Industry Volume Breakdown (K Unit, %) by Region 2024 & 2032
- Figure 3: North America Hematology Analyzers Industry Revenue (Million), by Country 2024 & 2032
- Figure 4: North America Hematology Analyzers Industry Volume (K Unit), by Country 2024 & 2032
- Figure 5: North America Hematology Analyzers Industry Revenue Share (%), by Country 2024 & 2032
- Figure 6: North America Hematology Analyzers Industry Volume Share (%), by Country 2024 & 2032
- Figure 7: South America Hematology Analyzers Industry Revenue (Million), by Country 2024 & 2032
- Figure 8: South America Hematology Analyzers Industry Volume (K Unit), by Country 2024 & 2032
- Figure 9: South America Hematology Analyzers Industry Revenue Share (%), by Country 2024 & 2032
- Figure 10: South America Hematology Analyzers Industry Volume Share (%), by Country 2024 & 2032
- Figure 11: Europe Hematology Analyzers Industry Revenue (Million), by Country 2024 & 2032
- Figure 12: Europe Hematology Analyzers Industry Volume (K Unit), by Country 2024 & 2032
- Figure 13: Europe Hematology Analyzers Industry Revenue Share (%), by Country 2024 & 2032
- Figure 14: Europe Hematology Analyzers Industry Volume Share (%), by Country 2024 & 2032
- Figure 15: Asia Pacific Hematology Analyzers Industry Revenue (Million), by Country 2024 & 2032
- Figure 16: Asia Pacific Hematology Analyzers Industry Volume (K Unit), by Country 2024 & 2032
- Figure 17: Asia Pacific Hematology Analyzers Industry Revenue Share (%), by Country 2024 & 2032
- Figure 18: Asia Pacific Hematology Analyzers Industry Volume Share (%), by Country 2024 & 2032
- Figure 19: MEA Hematology Analyzers Industry Revenue (Million), by Country 2024 & 2032
- Figure 20: MEA Hematology Analyzers Industry Volume (K Unit), by Country 2024 & 2032
- Figure 21: MEA Hematology Analyzers Industry Revenue Share (%), by Country 2024 & 2032
- Figure 22: MEA Hematology Analyzers Industry Volume Share (%), by Country 2024 & 2032
- Figure 23: North America Hematology Analyzers Industry Revenue (Million), by Product Type 2024 & 2032
- Figure 24: North America Hematology Analyzers Industry Volume (K Unit), by Product Type 2024 & 2032
- Figure 25: North America Hematology Analyzers Industry Revenue Share (%), by Product Type 2024 & 2032
- Figure 26: North America Hematology Analyzers Industry Volume Share (%), by Product Type 2024 & 2032
- Figure 27: North America Hematology Analyzers Industry Revenue (Million), by End User 2024 & 2032
- Figure 28: North America Hematology Analyzers Industry Volume (K Unit), by End User 2024 & 2032
- Figure 29: North America Hematology Analyzers Industry Revenue Share (%), by End User 2024 & 2032
- Figure 30: North America Hematology Analyzers Industry Volume Share (%), by End User 2024 & 2032
- Figure 31: North America Hematology Analyzers Industry Revenue (Million), by Country 2024 & 2032
- Figure 32: North America Hematology Analyzers Industry Volume (K Unit), by Country 2024 & 2032
- Figure 33: North America Hematology Analyzers Industry Revenue Share (%), by Country 2024 & 2032
- Figure 34: North America Hematology Analyzers Industry Volume Share (%), by Country 2024 & 2032
- Figure 35: Europe Hematology Analyzers Industry Revenue (Million), by Product Type 2024 & 2032
- Figure 36: Europe Hematology Analyzers Industry Volume (K Unit), by Product Type 2024 & 2032
- Figure 37: Europe Hematology Analyzers Industry Revenue Share (%), by Product Type 2024 & 2032
- Figure 38: Europe Hematology Analyzers Industry Volume Share (%), by Product Type 2024 & 2032
- Figure 39: Europe Hematology Analyzers Industry Revenue (Million), by End User 2024 & 2032
- Figure 40: Europe Hematology Analyzers Industry Volume (K Unit), by End User 2024 & 2032
- Figure 41: Europe Hematology Analyzers Industry Revenue Share (%), by End User 2024 & 2032
- Figure 42: Europe Hematology Analyzers Industry Volume Share (%), by End User 2024 & 2032
- Figure 43: Europe Hematology Analyzers Industry Revenue (Million), by Country 2024 & 2032
- Figure 44: Europe Hematology Analyzers Industry Volume (K Unit), by Country 2024 & 2032
- Figure 45: Europe Hematology Analyzers Industry Revenue Share (%), by Country 2024 & 2032
- Figure 46: Europe Hematology Analyzers Industry Volume Share (%), by Country 2024 & 2032
- Figure 47: Asia Pacific Hematology Analyzers Industry Revenue (Million), by Product Type 2024 & 2032
- Figure 48: Asia Pacific Hematology Analyzers Industry Volume (K Unit), by Product Type 2024 & 2032
- Figure 49: Asia Pacific Hematology Analyzers Industry Revenue Share (%), by Product Type 2024 & 2032
- Figure 50: Asia Pacific Hematology Analyzers Industry Volume Share (%), by Product Type 2024 & 2032
- Figure 51: Asia Pacific Hematology Analyzers Industry Revenue (Million), by End User 2024 & 2032
- Figure 52: Asia Pacific Hematology Analyzers Industry Volume (K Unit), by End User 2024 & 2032
- Figure 53: Asia Pacific Hematology Analyzers Industry Revenue Share (%), by End User 2024 & 2032
- Figure 54: Asia Pacific Hematology Analyzers Industry Volume Share (%), by End User 2024 & 2032
- Figure 55: Asia Pacific Hematology Analyzers Industry Revenue (Million), by Country 2024 & 2032
- Figure 56: Asia Pacific Hematology Analyzers Industry Volume (K Unit), by Country 2024 & 2032
- Figure 57: Asia Pacific Hematology Analyzers Industry Revenue Share (%), by Country 2024 & 2032
- Figure 58: Asia Pacific Hematology Analyzers Industry Volume Share (%), by Country 2024 & 2032
- Figure 59: Middle East and Africa Hematology Analyzers Industry Revenue (Million), by Product Type 2024 & 2032
- Figure 60: Middle East and Africa Hematology Analyzers Industry Volume (K Unit), by Product Type 2024 & 2032
- Figure 61: Middle East and Africa Hematology Analyzers Industry Revenue Share (%), by Product Type 2024 & 2032
- Figure 62: Middle East and Africa Hematology Analyzers Industry Volume Share (%), by Product Type 2024 & 2032
- Figure 63: Middle East and Africa Hematology Analyzers Industry Revenue (Million), by End User 2024 & 2032
- Figure 64: Middle East and Africa Hematology Analyzers Industry Volume (K Unit), by End User 2024 & 2032
- Figure 65: Middle East and Africa Hematology Analyzers Industry Revenue Share (%), by End User 2024 & 2032
- Figure 66: Middle East and Africa Hematology Analyzers Industry Volume Share (%), by End User 2024 & 2032
- Figure 67: Middle East and Africa Hematology Analyzers Industry Revenue (Million), by Country 2024 & 2032
- Figure 68: Middle East and Africa Hematology Analyzers Industry Volume (K Unit), by Country 2024 & 2032
- Figure 69: Middle East and Africa Hematology Analyzers Industry Revenue Share (%), by Country 2024 & 2032
- Figure 70: Middle East and Africa Hematology Analyzers Industry Volume Share (%), by Country 2024 & 2032
- Figure 71: South America Hematology Analyzers Industry Revenue (Million), by Product Type 2024 & 2032
- Figure 72: South America Hematology Analyzers Industry Volume (K Unit), by Product Type 2024 & 2032
- Figure 73: South America Hematology Analyzers Industry Revenue Share (%), by Product Type 2024 & 2032
- Figure 74: South America Hematology Analyzers Industry Volume Share (%), by Product Type 2024 & 2032
- Figure 75: South America Hematology Analyzers Industry Revenue (Million), by End User 2024 & 2032
- Figure 76: South America Hematology Analyzers Industry Volume (K Unit), by End User 2024 & 2032
- Figure 77: South America Hematology Analyzers Industry Revenue Share (%), by End User 2024 & 2032
- Figure 78: South America Hematology Analyzers Industry Volume Share (%), by End User 2024 & 2032
- Figure 79: South America Hematology Analyzers Industry Revenue (Million), by Country 2024 & 2032
- Figure 80: South America Hematology Analyzers Industry Volume (K Unit), by Country 2024 & 2032
- Figure 81: South America Hematology Analyzers Industry Revenue Share (%), by Country 2024 & 2032
- Figure 82: South America Hematology Analyzers Industry Volume Share (%), by Country 2024 & 2032
List of Tables
- Table 1: Global Hematology Analyzers Industry Revenue Million Forecast, by Region 2019 & 2032
- Table 2: Global Hematology Analyzers Industry Volume K Unit Forecast, by Region 2019 & 2032
- Table 3: Global Hematology Analyzers Industry Revenue Million Forecast, by Product Type 2019 & 2032
- Table 4: Global Hematology Analyzers Industry Volume K Unit Forecast, by Product Type 2019 & 2032
- Table 5: Global Hematology Analyzers Industry Revenue Million Forecast, by End User 2019 & 2032
- Table 6: Global Hematology Analyzers Industry Volume K Unit Forecast, by End User 2019 & 2032
- Table 7: Global Hematology Analyzers Industry Revenue Million Forecast, by Region 2019 & 2032
- Table 8: Global Hematology Analyzers Industry Volume K Unit Forecast, by Region 2019 & 2032
- Table 9: Global Hematology Analyzers Industry Revenue Million Forecast, by Country 2019 & 2032
- Table 10: Global Hematology Analyzers Industry Volume K Unit Forecast, by Country 2019 & 2032
- Table 11: United States Hematology Analyzers Industry Revenue (Million) Forecast, by Application 2019 & 2032
- Table 12: United States Hematology Analyzers Industry Volume (K Unit) Forecast, by Application 2019 & 2032
- Table 13: Canada Hematology Analyzers Industry Revenue (Million) Forecast, by Application 2019 & 2032
- Table 14: Canada Hematology Analyzers Industry Volume (K Unit) Forecast, by Application 2019 & 2032
- Table 15: Mexico Hematology Analyzers Industry Revenue (Million) Forecast, by Application 2019 & 2032
- Table 16: Mexico Hematology Analyzers Industry Volume (K Unit) Forecast, by Application 2019 & 2032
- Table 17: Global Hematology Analyzers Industry Revenue Million Forecast, by Country 2019 & 2032
- Table 18: Global Hematology Analyzers Industry Volume K Unit Forecast, by Country 2019 & 2032
- Table 19: Brazil Hematology Analyzers Industry Revenue (Million) Forecast, by Application 2019 & 2032
- Table 20: Brazil Hematology Analyzers Industry Volume (K Unit) Forecast, by Application 2019 & 2032
- Table 21: Mexico Hematology Analyzers Industry Revenue (Million) Forecast, by Application 2019 & 2032
- Table 22: Mexico Hematology Analyzers Industry Volume (K Unit) Forecast, by Application 2019 & 2032
- Table 23: Rest of South America Hematology Analyzers Industry Revenue (Million) Forecast, by Application 2019 & 2032
- Table 24: Rest of South America Hematology Analyzers Industry Volume (K Unit) Forecast, by Application 2019 & 2032
- Table 25: Global Hematology Analyzers Industry Revenue Million Forecast, by Country 2019 & 2032
- Table 26: Global Hematology Analyzers Industry Volume K Unit Forecast, by Country 2019 & 2032
- Table 27: United Kingdom Hematology Analyzers Industry Revenue (Million) Forecast, by Application 2019 & 2032
- Table 28: United Kingdom Hematology Analyzers Industry Volume (K Unit) Forecast, by Application 2019 & 2032
- Table 29: Germany Hematology Analyzers Industry Revenue (Million) Forecast, by Application 2019 & 2032
- Table 30: Germany Hematology Analyzers Industry Volume (K Unit) Forecast, by Application 2019 & 2032
- Table 31: France Hematology Analyzers Industry Revenue (Million) Forecast, by Application 2019 & 2032
- Table 32: France Hematology Analyzers Industry Volume (K Unit) Forecast, by Application 2019 & 2032
- Table 33: Italy Hematology Analyzers Industry Revenue (Million) Forecast, by Application 2019 & 2032
- Table 34: Italy Hematology Analyzers Industry Volume (K Unit) Forecast, by Application 2019 & 2032
- Table 35: Spain Hematology Analyzers Industry Revenue (Million) Forecast, by Application 2019 & 2032
- Table 36: Spain Hematology Analyzers Industry Volume (K Unit) Forecast, by Application 2019 & 2032
- Table 37: Russia Hematology Analyzers Industry Revenue (Million) Forecast, by Application 2019 & 2032
- Table 38: Russia Hematology Analyzers Industry Volume (K Unit) Forecast, by Application 2019 & 2032
- Table 39: Rest of Europe Hematology Analyzers Industry Revenue (Million) Forecast, by Application 2019 & 2032
- Table 40: Rest of Europe Hematology Analyzers Industry Volume (K Unit) Forecast, by Application 2019 & 2032
- Table 41: Global Hematology Analyzers Industry Revenue Million Forecast, by Country 2019 & 2032
- Table 42: Global Hematology Analyzers Industry Volume K Unit Forecast, by Country 2019 & 2032
- Table 43: China Hematology Analyzers Industry Revenue (Million) Forecast, by Application 2019 & 2032
- Table 44: China Hematology Analyzers Industry Volume (K Unit) Forecast, by Application 2019 & 2032
- Table 45: Japan Hematology Analyzers Industry Revenue (Million) Forecast, by Application 2019 & 2032
- Table 46: Japan Hematology Analyzers Industry Volume (K Unit) Forecast, by Application 2019 & 2032
- Table 47: India Hematology Analyzers Industry Revenue (Million) Forecast, by Application 2019 & 2032
- Table 48: India Hematology Analyzers Industry Volume (K Unit) Forecast, by Application 2019 & 2032
- Table 49: South Korea Hematology Analyzers Industry Revenue (Million) Forecast, by Application 2019 & 2032
- Table 50: South Korea Hematology Analyzers Industry Volume (K Unit) Forecast, by Application 2019 & 2032
- Table 51: Taiwan Hematology Analyzers Industry Revenue (Million) Forecast, by Application 2019 & 2032
- Table 52: Taiwan Hematology Analyzers Industry Volume (K Unit) Forecast, by Application 2019 & 2032
- Table 53: Australia Hematology Analyzers Industry Revenue (Million) Forecast, by Application 2019 & 2032
- Table 54: Australia Hematology Analyzers Industry Volume (K Unit) Forecast, by Application 2019 & 2032
- Table 55: Rest of Asia-Pacific Hematology Analyzers Industry Revenue (Million) Forecast, by Application 2019 & 2032
- Table 56: Rest of Asia-Pacific Hematology Analyzers Industry Volume (K Unit) Forecast, by Application 2019 & 2032
- Table 57: Global Hematology Analyzers Industry Revenue Million Forecast, by Country 2019 & 2032
- Table 58: Global Hematology Analyzers Industry Volume K Unit Forecast, by Country 2019 & 2032
- Table 59: Middle East Hematology Analyzers Industry Revenue (Million) Forecast, by Application 2019 & 2032
- Table 60: Middle East Hematology Analyzers Industry Volume (K Unit) Forecast, by Application 2019 & 2032
- Table 61: Africa Hematology Analyzers Industry Revenue (Million) Forecast, by Application 2019 & 2032
- Table 62: Africa Hematology Analyzers Industry Volume (K Unit) Forecast, by Application 2019 & 2032
- Table 63: Global Hematology Analyzers Industry Revenue Million Forecast, by Product Type 2019 & 2032
- Table 64: Global Hematology Analyzers Industry Volume K Unit Forecast, by Product Type 2019 & 2032
- Table 65: Global Hematology Analyzers Industry Revenue Million Forecast, by End User 2019 & 2032
- Table 66: Global Hematology Analyzers Industry Volume K Unit Forecast, by End User 2019 & 2032
- Table 67: Global Hematology Analyzers Industry Revenue Million Forecast, by Country 2019 & 2032
- Table 68: Global Hematology Analyzers Industry Volume K Unit Forecast, by Country 2019 & 2032
- Table 69: United States Hematology Analyzers Industry Revenue (Million) Forecast, by Application 2019 & 2032
- Table 70: United States Hematology Analyzers Industry Volume (K Unit) Forecast, by Application 2019 & 2032
- Table 71: Canada Hematology Analyzers Industry Revenue (Million) Forecast, by Application 2019 & 2032
- Table 72: Canada Hematology Analyzers Industry Volume (K Unit) Forecast, by Application 2019 & 2032
- Table 73: Mexico Hematology Analyzers Industry Revenue (Million) Forecast, by Application 2019 & 2032
- Table 74: Mexico Hematology Analyzers Industry Volume (K Unit) Forecast, by Application 2019 & 2032
- Table 75: Global Hematology Analyzers Industry Revenue Million Forecast, by Product Type 2019 & 2032
- Table 76: Global Hematology Analyzers Industry Volume K Unit Forecast, by Product Type 2019 & 2032
- Table 77: Global Hematology Analyzers Industry Revenue Million Forecast, by End User 2019 & 2032
- Table 78: Global Hematology Analyzers Industry Volume K Unit Forecast, by End User 2019 & 2032
- Table 79: Global Hematology Analyzers Industry Revenue Million Forecast, by Country 2019 & 2032
- Table 80: Global Hematology Analyzers Industry Volume K Unit Forecast, by Country 2019 & 2032
- Table 81: Germany Hematology Analyzers Industry Revenue (Million) Forecast, by Application 2019 & 2032
- Table 82: Germany Hematology Analyzers Industry Volume (K Unit) Forecast, by Application 2019 & 2032
- Table 83: United Kingdom Hematology Analyzers Industry Revenue (Million) Forecast, by Application 2019 & 2032
- Table 84: United Kingdom Hematology Analyzers Industry Volume (K Unit) Forecast, by Application 2019 & 2032
- Table 85: France Hematology Analyzers Industry Revenue (Million) Forecast, by Application 2019 & 2032
- Table 86: France Hematology Analyzers Industry Volume (K Unit) Forecast, by Application 2019 & 2032
- Table 87: Italy Hematology Analyzers Industry Revenue (Million) Forecast, by Application 2019 & 2032
- Table 88: Italy Hematology Analyzers Industry Volume (K Unit) Forecast, by Application 2019 & 2032
- Table 89: Spain Hematology Analyzers Industry Revenue (Million) Forecast, by Application 2019 & 2032
- Table 90: Spain Hematology Analyzers Industry Volume (K Unit) Forecast, by Application 2019 & 2032
- Table 91: Rest of Europe Hematology Analyzers Industry Revenue (Million) Forecast, by Application 2019 & 2032
- Table 92: Rest of Europe Hematology Analyzers Industry Volume (K Unit) Forecast, by Application 2019 & 2032
- Table 93: Global Hematology Analyzers Industry Revenue Million Forecast, by Product Type 2019 & 2032
- Table 94: Global Hematology Analyzers Industry Volume K Unit Forecast, by Product Type 2019 & 2032
- Table 95: Global Hematology Analyzers Industry Revenue Million Forecast, by End User 2019 & 2032
- Table 96: Global Hematology Analyzers Industry Volume K Unit Forecast, by End User 2019 & 2032
- Table 97: Global Hematology Analyzers Industry Revenue Million Forecast, by Country 2019 & 2032
- Table 98: Global Hematology Analyzers Industry Volume K Unit Forecast, by Country 2019 & 2032
- Table 99: China Hematology Analyzers Industry Revenue (Million) Forecast, by Application 2019 & 2032
- Table 100: China Hematology Analyzers Industry Volume (K Unit) Forecast, by Application 2019 & 2032
- Table 101: Japan Hematology Analyzers Industry Revenue (Million) Forecast, by Application 2019 & 2032
- Table 102: Japan Hematology Analyzers Industry Volume (K Unit) Forecast, by Application 2019 & 2032
- Table 103: India Hematology Analyzers Industry Revenue (Million) Forecast, by Application 2019 & 2032
- Table 104: India Hematology Analyzers Industry Volume (K Unit) Forecast, by Application 2019 & 2032
- Table 105: Australia Hematology Analyzers Industry Revenue (Million) Forecast, by Application 2019 & 2032
- Table 106: Australia Hematology Analyzers Industry Volume (K Unit) Forecast, by Application 2019 & 2032
- Table 107: South Korea Hematology Analyzers Industry Revenue (Million) Forecast, by Application 2019 & 2032
- Table 108: South Korea Hematology Analyzers Industry Volume (K Unit) Forecast, by Application 2019 & 2032
- Table 109: Rest of Asia Pacific Hematology Analyzers Industry Revenue (Million) Forecast, by Application 2019 & 2032
- Table 110: Rest of Asia Pacific Hematology Analyzers Industry Volume (K Unit) Forecast, by Application 2019 & 2032
- Table 111: Global Hematology Analyzers Industry Revenue Million Forecast, by Product Type 2019 & 2032
- Table 112: Global Hematology Analyzers Industry Volume K Unit Forecast, by Product Type 2019 & 2032
- Table 113: Global Hematology Analyzers Industry Revenue Million Forecast, by End User 2019 & 2032
- Table 114: Global Hematology Analyzers Industry Volume K Unit Forecast, by End User 2019 & 2032
- Table 115: Global Hematology Analyzers Industry Revenue Million Forecast, by Country 2019 & 2032
- Table 116: Global Hematology Analyzers Industry Volume K Unit Forecast, by Country 2019 & 2032
- Table 117: GCC Hematology Analyzers Industry Revenue (Million) Forecast, by Application 2019 & 2032
- Table 118: GCC Hematology Analyzers Industry Volume (K Unit) Forecast, by Application 2019 & 2032
- Table 119: South Africa Hematology Analyzers Industry Revenue (Million) Forecast, by Application 2019 & 2032
- Table 120: South Africa Hematology Analyzers Industry Volume (K Unit) Forecast, by Application 2019 & 2032
- Table 121: Rest of Middle East and Africa Hematology Analyzers Industry Revenue (Million) Forecast, by Application 2019 & 2032
- Table 122: Rest of Middle East and Africa Hematology Analyzers Industry Volume (K Unit) Forecast, by Application 2019 & 2032
- Table 123: Global Hematology Analyzers Industry Revenue Million Forecast, by Product Type 2019 & 2032
- Table 124: Global Hematology Analyzers Industry Volume K Unit Forecast, by Product Type 2019 & 2032
- Table 125: Global Hematology Analyzers Industry Revenue Million Forecast, by End User 2019 & 2032
- Table 126: Global Hematology Analyzers Industry Volume K Unit Forecast, by End User 2019 & 2032
- Table 127: Global Hematology Analyzers Industry Revenue Million Forecast, by Country 2019 & 2032
- Table 128: Global Hematology Analyzers Industry Volume K Unit Forecast, by Country 2019 & 2032
- Table 129: Brazil Hematology Analyzers Industry Revenue (Million) Forecast, by Application 2019 & 2032
- Table 130: Brazil Hematology Analyzers Industry Volume (K Unit) Forecast, by Application 2019 & 2032
- Table 131: Argentina Hematology Analyzers Industry Revenue (Million) Forecast, by Application 2019 & 2032
- Table 132: Argentina Hematology Analyzers Industry Volume (K Unit) Forecast, by Application 2019 & 2032
- Table 133: Rest of South America Hematology Analyzers Industry Revenue (Million) Forecast, by Application 2019 & 2032
- Table 134: Rest of South America Hematology Analyzers Industry Volume (K Unit) Forecast, by Application 2019 & 2032
Frequently Asked Questions
1. What is the projected Compound Annual Growth Rate (CAGR) of the Hematology Analyzers Industry?
The projected CAGR is approximately 7.10%.
2. Which companies are prominent players in the Hematology Analyzers Industry?
Key companies in the market include Stratec Biomedical Systems (DIATRON), Horiba Ltd, Siemens Healthineers, Abbott Laboratories, F Hoffmann-La Roche Ltd, Ortho Clinical Diagnostics, Boule Diagnostics AB, Bio-Rad Laboratories, Beckman Coulter Inc (Danaher Corporation), Sysmex Corporation, Accurex Biomedical Pvt Ltd , Nihon Kohden Corporation.
3. What are the main segments of the Hematology Analyzers Industry?
The market segments include Product Type, End User.
4. Can you provide details about the market size?
The market size is estimated to be USD 6.23 Million as of 2022.
5. What are some drivers contributing to market growth?
Rising Burden of Blood Disorders; Increasing Technological Advancements and Rising Adoption Rates of Automated Hematology Instruments.
6. What are the notable trends driving market growth?
3 Part Hematology Analyzer is the Segment by Instruments Expected to Hold Significant Market Share Over the Forecast Period.
7. Are there any restraints impacting market growth?
High Cost of Hematology Analyzers; Time-consuming and Stringent Rregulatory Policies.
8. Can you provide examples of recent developments in the market?
In May 2022, Nihon Kohden India established a new hematology analyzer reagent factory.
9. What pricing options are available for accessing the report?
Pricing options include single-user, multi-user, and enterprise licenses priced at USD 4750, USD 5250, and USD 8750 respectively.
10. Is the market size provided in terms of value or volume?
The market size is provided in terms of value, measured in Million and volume, measured in K Unit.
11. Are there any specific market keywords associated with the report?
Yes, the market keyword associated with the report is "Hematology Analyzers Industry," which aids in identifying and referencing the specific market segment covered.
12. How do I determine which pricing option suits my needs best?
The pricing options vary based on user requirements and access needs. Individual users may opt for single-user licenses, while businesses requiring broader access may choose multi-user or enterprise licenses for cost-effective access to the report.
13. Are there any additional resources or data provided in the Hematology Analyzers Industry report?
While the report offers comprehensive insights, it's advisable to review the specific contents or supplementary materials provided to ascertain if additional resources or data are available.
14. How can I stay updated on further developments or reports in the Hematology Analyzers Industry?
To stay informed about further developments, trends, and reports in the Hematology Analyzers Industry, consider subscribing to industry newsletters, following relevant companies and organizations, or regularly checking reputable industry news sources and publications.
Methodology
Step 1 - Identification of Relevant Samples Size from Population Database


Step 2 - Approaches for Defining Global Market Size (Value, Volume* & Price*)

Note*: In applicable scenarios
Step 3 - Data Sources
Primary Research
- Web Analytics
- Survey Reports
- Research Institute
- Latest Research Reports
- Opinion Leaders
Secondary Research
- Annual Reports
- White Paper
- Latest Press Release
- Industry Association
- Paid Database
- Investor Presentations

Step 4 - Data Triangulation
Involves using different sources of information in order to increase the validity of a study
These sources are likely to be stakeholders in a program - participants, other researchers, program staff, other community members, and so on.
Then we put all data in single framework & apply various statistical tools to find out the dynamic on the market.
During the analysis stage, feedback from the stakeholder groups would be compared to determine areas of agreement as well as areas of divergence
