

Key Insights
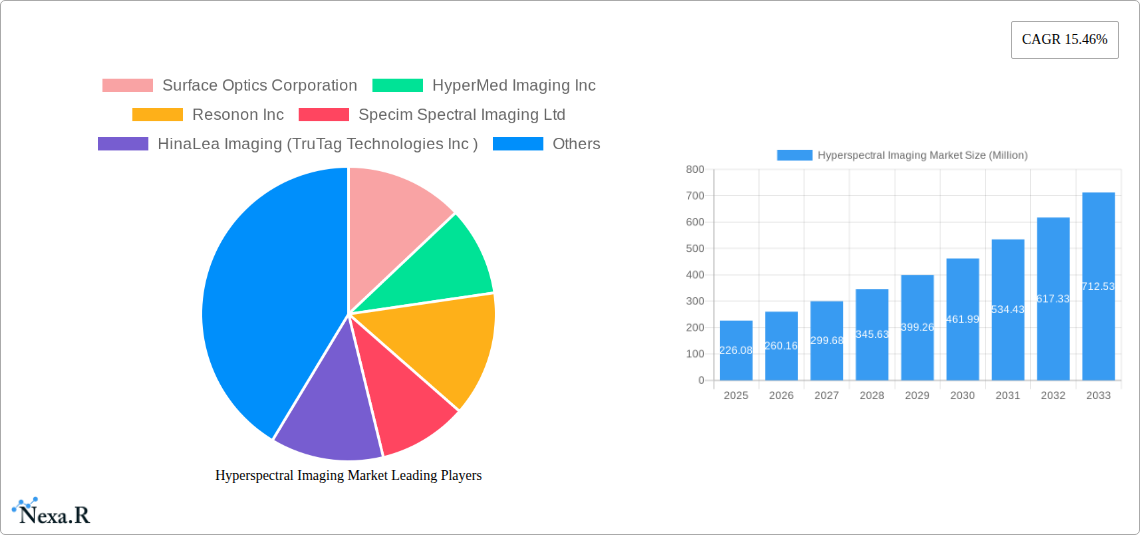
The hyperspectral imaging market is experiencing robust growth, projected to reach \$226.08 million in 2025 and exhibiting a Compound Annual Growth Rate (CAGR) of 15.46% from 2025 to 2033. This expansion is driven by increasing demand across diverse sectors. The food and agriculture sector leverages hyperspectral imaging for quality control, detecting contaminants, and optimizing yields. The healthcare industry utilizes the technology for advanced diagnostics, disease detection, and personalized medicine. Furthermore, applications in defense (surveillance, target identification), mining (mineral exploration and analysis), and metrology (precision measurements) are fueling market growth. Technological advancements leading to smaller, more affordable, and easier-to-use systems are also contributing factors. While the market faces some restraints, such as the relatively high cost of advanced systems and the need for specialized expertise in data analysis, these challenges are being mitigated by ongoing innovation and the increasing accessibility of the technology. The market is geographically diverse, with North America and Europe currently holding significant shares, but the Asia-Pacific region is anticipated to witness considerable growth due to rising industrialization and adoption in emerging economies.
The competitive landscape is characterized by a mix of established players and emerging companies. Key players like Surface Optics Corporation, HyperMed Imaging Inc., and Resonon Inc. are driving innovation and market penetration. However, the market is also attractive to new entrants due to the high growth potential. The segmentation by end-user provides a detailed understanding of market dynamics within each sector. The forecast period of 2025-2033 suggests continued expansion, potentially exceeding \$1 billion by 2033, driven by increasing adoption and technological advancements. Further research into specific applications and geographical regions will offer a more granular understanding of the market's future trajectory. Strategic partnerships and mergers & acquisitions are expected to further shape the competitive landscape, accelerating innovation and market penetration.
Hyperspectral Imaging Market: A Comprehensive Report (2019-2033)
This comprehensive report provides an in-depth analysis of the Hyperspectral Imaging market, encompassing market dynamics, growth trends, regional dominance, product landscape, key players, and future outlook. The study period spans from 2019 to 2033, with 2025 serving as the base and estimated year. The report caters to industry professionals, investors, and researchers seeking a clear understanding of this rapidly evolving technology sector. The market is segmented by end-user: Food and Agriculture, Healthcare, Defense, Mining and Metrology, and Other End-user Verticals. The parent market is the advanced imaging market, and hyperspectral imaging is a key child market within it. The total market size is projected to reach xx Million by 2033.
Hyperspectral Imaging Market Dynamics & Structure
The hyperspectral imaging market is characterized by moderate concentration, with several key players vying for market share. Technological innovation, particularly in sensor technology and data processing capabilities, is a primary driver of growth. Stringent regulatory frameworks, especially in sectors like healthcare and defense, influence market adoption. Competitive pressures from alternative imaging technologies exist, but the unique capabilities of hyperspectral imaging—providing detailed spectral information—continue to differentiate it. The market is also seeing increasing M&A activity as larger companies seek to expand their capabilities and market reach.
- Market Concentration: Moderately concentrated, with top 5 players holding approximately xx% of market share in 2025.
- Technological Innovation: Significant advancements in sensor miniaturization, improved spectral resolution, and faster data processing are driving market expansion.
- Regulatory Landscape: Stringent regulations in certain end-user verticals (e.g., medical device approvals) impact market entry and growth.
- Competitive Substitutes: Traditional imaging technologies, such as multispectral imaging, present competitive pressure.
- End-User Demographics: Growth is driven by increasing adoption across diverse sectors, including food and agriculture, healthcare, and defense.
- M&A Activity: A moderate number of M&A deals (xx in 2024) have occurred, indicating consolidation and expansion efforts within the market.
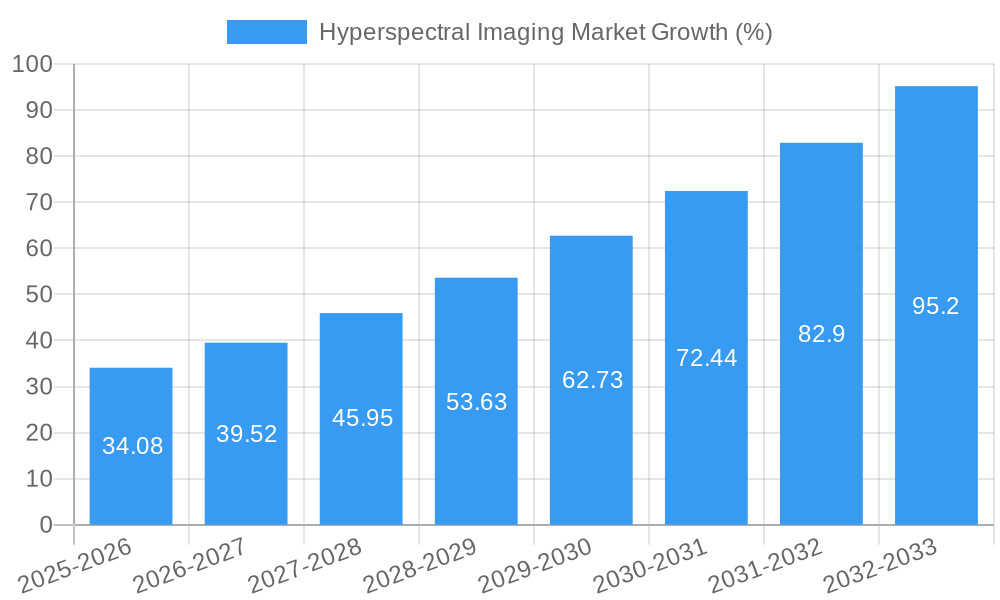
Hyperspectral Imaging Market Growth Trends & Insights
The hyperspectral imaging market is experiencing robust growth, driven by increasing demand across various applications. The market size, valued at xx Million in 2025, is projected to reach xx Million by 2033, exhibiting a CAGR of xx% during the forecast period (2025-2033). This growth is fueled by technological advancements leading to improved image quality, reduced costs, and wider accessibility. Adoption rates are increasing, particularly in the food and agriculture sector for quality control and precision farming. Consumer behavior is shifting towards the adoption of data-driven decision-making across multiple industries. The market penetration remains relatively low, but it’s expected to rise significantly in the coming years, mainly due to increased awareness and benefits realization. Technological disruptions, like the development of more compact and affordable sensors, contribute to accelerated market growth.
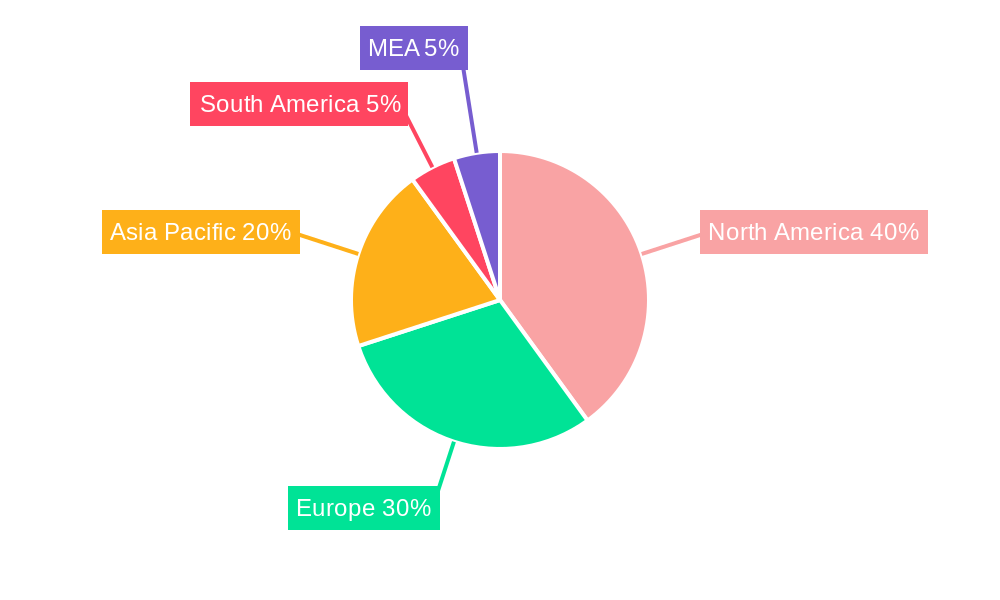
Dominant Regions, Countries, or Segments in Hyperspectral Imaging Market
North America currently holds the largest market share within the hyperspectral imaging market, driven by significant technological advancements and strong presence of key players. However, the Asia-Pacific region is exhibiting the fastest growth rate, fueled by increasing investments in technology and infrastructure, particularly in countries like China and India. Within the end-user segments, the Food and Agriculture sector is currently dominating, driven by the need for improved quality control, yield optimization, and disease detection.
- North America: Dominant due to strong R&D investments and presence of major players.
- Asia-Pacific: Fastest-growing region, driven by technological advancements and expanding infrastructure.
- Food and Agriculture: Leading end-user segment driven by the demand for efficient and precise quality control and yield optimization.
- Key Drivers: Government initiatives promoting technological adoption, increasing investments in R&D, and growing awareness of the benefits of hyperspectral imaging.
Hyperspectral Imaging Market Product Landscape
Hyperspectral imaging products encompass a range of cameras, spectrometers, and software solutions tailored for diverse applications. Recent innovations focus on improved spectral and spatial resolution, faster data processing, and more user-friendly interfaces. These advancements enhance the accuracy, speed, and ease of use of hyperspectral imaging systems, broadening their appeal across various end-user industries. Unique selling propositions include superior data quality, comprehensive spectral information, and the ability to analyze materials in real-time.
Key Drivers, Barriers & Challenges in Hyperspectral Imaging Market
Key Drivers: The market is driven by the increasing need for precise, non-destructive analysis across numerous industries, the development of more compact and affordable sensors, and the rising adoption of advanced data analytics techniques for efficient interpretation of hyperspectral data.
Key Challenges & Restraints: High initial investment costs, the complexity of data analysis, and the need for specialized expertise can limit market penetration. Supply chain disruptions and potential regulatory hurdles also pose challenges. The competitive landscape, with established players and emerging startups, adds to the complexity.
Emerging Opportunities in Hyperspectral Imaging Market
Untapped markets in developing economies present significant growth potential. The application of hyperspectral imaging in novel areas like environmental monitoring, medical diagnostics, and material identification is expanding rapidly. Evolving consumer preferences for safer and higher quality products are further driving adoption of hyperspectral technology in various industries.
Growth Accelerators in the Hyperspectral Imaging Market Industry
Technological breakthroughs in sensor technology, data processing, and machine learning algorithms are accelerating market growth. Strategic partnerships between technology providers and end-users are fostering innovation and market expansion. Increased government funding for R&D and supportive policies are also catalyzing market growth.
Key Players Shaping the Hyperspectral Imaging Market Market
- Surface Optics Corporation
- HyperMed Imaging Inc
- Resonon Inc
- Specim Spectral Imaging Ltd
- HinaLea Imaging (TruTag Technologies Inc)
- Headwall Photonics Inc
- Telops Inc
- Cubert GmbH
- BaySpec Inc
- Galileo Group Inc
- XIMEA GmbH
- Norsk Elektro Optikk AS
- Brimrose Corporation of America
- Corning Incorporated
- ITRES Research Limited
Notable Milestones in Hyperspectral Imaging Market Sector
- December 2023: SPECIM launched its upgraded FX50 middle-wave infrared hyperspectral camera, featuring enhanced resolution and speed.
- November 2023: European Space Imaging (EUSI) and Pixxel partnered to bring hyperspectral imaging to the European market.
- June 2023: HinaLea Imaging unveiled its Model 4455 SWIR hyperspectral camera with extended spectral range.
In-Depth Hyperspectral Imaging Market Market Outlook
The future of the hyperspectral imaging market is promising, driven by continued technological advancements, increased adoption across diverse sectors, and the emergence of new applications. Strategic partnerships and collaborations will play a key role in accelerating market growth. The market holds significant potential for innovation and expansion, particularly in areas requiring precise, non-destructive analysis. The ongoing development of more user-friendly software and reduced costs will further drive market penetration.
Hyperspectral Imaging Market Segmentation
-
1. End-user Industry
- 1.1. Food and Agriculture
- 1.2. Healthcare
- 1.3. Defense
- 1.4. Mining and Metrology
- 1.5. Recycling
- 1.6. Other End-user Verticals
Hyperspectral Imaging Market Segmentation By Geography
- 1. North America
- 2. Europe
- 3. Asia
- 4. Australia and New Zealand
- 5. Latin America
- 6. Middle East and Africa
Hyperspectral Imaging Market REPORT HIGHLIGHTS
| Aspects | Details |
|---|---|
| Study Period | 2019-2033 |
| Base Year | 2024 |
| Estimated Year | 2025 |
| Forecast Period | 2025-2033 |
| Historical Period | 2019-2024 |
| Growth Rate | CAGR of 15.46% from 2019-2033 |
| Segmentation |
|
Table of Contents
- 1. Introduction
- 1.1. Research Scope
- 1.2. Market Segmentation
- 1.3. Research Methodology
- 1.4. Definitions and Assumptions
- 2. Executive Summary
- 2.1. Introduction
- 3. Market Dynamics
- 3.1. Introduction
- 3.2. Market Drivers
- 3.2.1. Technological Advancements; Increasing Demand for Data Accuracy and Consistency
- 3.3. Market Restrains
- 3.3.1. High Costs Associated with the Use of Hyperspectral Imaging
- 3.4. Market Trends
- 3.4.1. Healthcare to be the Fastest Growing End User Segment
- 4. Market Factor Analysis
- 4.1. Porters Five Forces
- 4.2. Supply/Value Chain
- 4.3. PESTEL analysis
- 4.4. Market Entropy
- 4.5. Patent/Trademark Analysis
- 5. Global Hyperspectral Imaging Market Analysis, Insights and Forecast, 2019-2031
- 5.1. Market Analysis, Insights and Forecast - by End-user Industry
- 5.1.1. Food and Agriculture
- 5.1.2. Healthcare
- 5.1.3. Defense
- 5.1.4. Mining and Metrology
- 5.1.5. Recycling
- 5.1.6. Other End-user Verticals
- 5.2. Market Analysis, Insights and Forecast - by Region
- 5.2.1. North America
- 5.2.2. Europe
- 5.2.3. Asia
- 5.2.4. Australia and New Zealand
- 5.2.5. Latin America
- 5.2.6. Middle East and Africa
- 5.1. Market Analysis, Insights and Forecast - by End-user Industry
- 6. North America Hyperspectral Imaging Market Analysis, Insights and Forecast, 2019-2031
- 6.1. Market Analysis, Insights and Forecast - by End-user Industry
- 6.1.1. Food and Agriculture
- 6.1.2. Healthcare
- 6.1.3. Defense
- 6.1.4. Mining and Metrology
- 6.1.5. Recycling
- 6.1.6. Other End-user Verticals
- 6.1. Market Analysis, Insights and Forecast - by End-user Industry
- 7. Europe Hyperspectral Imaging Market Analysis, Insights and Forecast, 2019-2031
- 7.1. Market Analysis, Insights and Forecast - by End-user Industry
- 7.1.1. Food and Agriculture
- 7.1.2. Healthcare
- 7.1.3. Defense
- 7.1.4. Mining and Metrology
- 7.1.5. Recycling
- 7.1.6. Other End-user Verticals
- 7.1. Market Analysis, Insights and Forecast - by End-user Industry
- 8. Asia Hyperspectral Imaging Market Analysis, Insights and Forecast, 2019-2031
- 8.1. Market Analysis, Insights and Forecast - by End-user Industry
- 8.1.1. Food and Agriculture
- 8.1.2. Healthcare
- 8.1.3. Defense
- 8.1.4. Mining and Metrology
- 8.1.5. Recycling
- 8.1.6. Other End-user Verticals
- 8.1. Market Analysis, Insights and Forecast - by End-user Industry
- 9. Australia and New Zealand Hyperspectral Imaging Market Analysis, Insights and Forecast, 2019-2031
- 9.1. Market Analysis, Insights and Forecast - by End-user Industry
- 9.1.1. Food and Agriculture
- 9.1.2. Healthcare
- 9.1.3. Defense
- 9.1.4. Mining and Metrology
- 9.1.5. Recycling
- 9.1.6. Other End-user Verticals
- 9.1. Market Analysis, Insights and Forecast - by End-user Industry
- 10. Latin America Hyperspectral Imaging Market Analysis, Insights and Forecast, 2019-2031
- 10.1. Market Analysis, Insights and Forecast - by End-user Industry
- 10.1.1. Food and Agriculture
- 10.1.2. Healthcare
- 10.1.3. Defense
- 10.1.4. Mining and Metrology
- 10.1.5. Recycling
- 10.1.6. Other End-user Verticals
- 10.1. Market Analysis, Insights and Forecast - by End-user Industry
- 11. Middle East and Africa Hyperspectral Imaging Market Analysis, Insights and Forecast, 2019-2031
- 11.1. Market Analysis, Insights and Forecast - by End-user Industry
- 11.1.1. Food and Agriculture
- 11.1.2. Healthcare
- 11.1.3. Defense
- 11.1.4. Mining and Metrology
- 11.1.5. Recycling
- 11.1.6. Other End-user Verticals
- 11.1. Market Analysis, Insights and Forecast - by End-user Industry
- 12. North America Hyperspectral Imaging Market Analysis, Insights and Forecast, 2019-2031
- 12.1. Market Analysis, Insights and Forecast - By Country/Sub-region
- 12.1.1 United States
- 12.1.2 Canada
- 12.1.3 Mexico
- 13. Europe Hyperspectral Imaging Market Analysis, Insights and Forecast, 2019-2031
- 13.1. Market Analysis, Insights and Forecast - By Country/Sub-region
- 13.1.1 Germany
- 13.1.2 United Kingdom
- 13.1.3 France
- 13.1.4 Spain
- 13.1.5 Italy
- 13.1.6 Spain
- 13.1.7 Belgium
- 13.1.8 Netherland
- 13.1.9 Nordics
- 13.1.10 Rest of Europe
- 14. Asia Pacific Hyperspectral Imaging Market Analysis, Insights and Forecast, 2019-2031
- 14.1. Market Analysis, Insights and Forecast - By Country/Sub-region
- 14.1.1 China
- 14.1.2 Japan
- 14.1.3 India
- 14.1.4 South Korea
- 14.1.5 Southeast Asia
- 14.1.6 Australia
- 14.1.7 Indonesia
- 14.1.8 Phillipes
- 14.1.9 Singapore
- 14.1.10 Thailandc
- 14.1.11 Rest of Asia Pacific
- 15. South America Hyperspectral Imaging Market Analysis, Insights and Forecast, 2019-2031
- 15.1. Market Analysis, Insights and Forecast - By Country/Sub-region
- 15.1.1 Brazil
- 15.1.2 Argentina
- 15.1.3 Peru
- 15.1.4 Chile
- 15.1.5 Colombia
- 15.1.6 Ecuador
- 15.1.7 Venezuela
- 15.1.8 Rest of South America
- 16. North America Hyperspectral Imaging Market Analysis, Insights and Forecast, 2019-2031
- 16.1. Market Analysis, Insights and Forecast - By Country/Sub-region
- 16.1.1 United States
- 16.1.2 Canada
- 16.1.3 Mexico
- 17. MEA Hyperspectral Imaging Market Analysis, Insights and Forecast, 2019-2031
- 17.1. Market Analysis, Insights and Forecast - By Country/Sub-region
- 17.1.1 United Arab Emirates
- 17.1.2 Saudi Arabia
- 17.1.3 South Africa
- 17.1.4 Rest of Middle East and Africa
- 18. Competitive Analysis
- 18.1. Global Market Share Analysis 2024
- 18.2. Company Profiles
- 18.2.1 Surface Optics Corporation
- 18.2.1.1. Overview
- 18.2.1.2. Products
- 18.2.1.3. SWOT Analysis
- 18.2.1.4. Recent Developments
- 18.2.1.5. Financials (Based on Availability)
- 18.2.2 HyperMed Imaging Inc
- 18.2.2.1. Overview
- 18.2.2.2. Products
- 18.2.2.3. SWOT Analysis
- 18.2.2.4. Recent Developments
- 18.2.2.5. Financials (Based on Availability)
- 18.2.3 Resonon Inc
- 18.2.3.1. Overview
- 18.2.3.2. Products
- 18.2.3.3. SWOT Analysis
- 18.2.3.4. Recent Developments
- 18.2.3.5. Financials (Based on Availability)
- 18.2.4 Specim Spectral Imaging Ltd
- 18.2.4.1. Overview
- 18.2.4.2. Products
- 18.2.4.3. SWOT Analysis
- 18.2.4.4. Recent Developments
- 18.2.4.5. Financials (Based on Availability)
- 18.2.5 HinaLea Imaging (TruTag Technologies Inc )
- 18.2.5.1. Overview
- 18.2.5.2. Products
- 18.2.5.3. SWOT Analysis
- 18.2.5.4. Recent Developments
- 18.2.5.5. Financials (Based on Availability)
- 18.2.6 Headwall Photonics Inc
- 18.2.6.1. Overview
- 18.2.6.2. Products
- 18.2.6.3. SWOT Analysis
- 18.2.6.4. Recent Developments
- 18.2.6.5. Financials (Based on Availability)
- 18.2.7 Telops Inc
- 18.2.7.1. Overview
- 18.2.7.2. Products
- 18.2.7.3. SWOT Analysis
- 18.2.7.4. Recent Developments
- 18.2.7.5. Financials (Based on Availability)
- 18.2.8 Cubert GmbH
- 18.2.8.1. Overview
- 18.2.8.2. Products
- 18.2.8.3. SWOT Analysis
- 18.2.8.4. Recent Developments
- 18.2.8.5. Financials (Based on Availability)
- 18.2.9 BaySpec Inc
- 18.2.9.1. Overview
- 18.2.9.2. Products
- 18.2.9.3. SWOT Analysis
- 18.2.9.4. Recent Developments
- 18.2.9.5. Financials (Based on Availability)
- 18.2.10 Galileo Group Inc
- 18.2.10.1. Overview
- 18.2.10.2. Products
- 18.2.10.3. SWOT Analysis
- 18.2.10.4. Recent Developments
- 18.2.10.5. Financials (Based on Availability)
- 18.2.11 XIMEA GmbH
- 18.2.11.1. Overview
- 18.2.11.2. Products
- 18.2.11.3. SWOT Analysis
- 18.2.11.4. Recent Developments
- 18.2.11.5. Financials (Based on Availability)
- 18.2.12 Norsk Elektro Optikk AS
- 18.2.12.1. Overview
- 18.2.12.2. Products
- 18.2.12.3. SWOT Analysis
- 18.2.12.4. Recent Developments
- 18.2.12.5. Financials (Based on Availability)
- 18.2.13 Brimrose Corporation of America
- 18.2.13.1. Overview
- 18.2.13.2. Products
- 18.2.13.3. SWOT Analysis
- 18.2.13.4. Recent Developments
- 18.2.13.5. Financials (Based on Availability)
- 18.2.14 Corning Incorporated
- 18.2.14.1. Overview
- 18.2.14.2. Products
- 18.2.14.3. SWOT Analysis
- 18.2.14.4. Recent Developments
- 18.2.14.5. Financials (Based on Availability)
- 18.2.15 ITRES Research Limited
- 18.2.15.1. Overview
- 18.2.15.2. Products
- 18.2.15.3. SWOT Analysis
- 18.2.15.4. Recent Developments
- 18.2.15.5. Financials (Based on Availability)
- 18.2.1 Surface Optics Corporation
List of Figures
- Figure 1: Global Hyperspectral Imaging Market Revenue Breakdown (Million, %) by Region 2024 & 2032
- Figure 2: North America Hyperspectral Imaging Market Revenue (Million), by Country 2024 & 2032
- Figure 3: North America Hyperspectral Imaging Market Revenue Share (%), by Country 2024 & 2032
- Figure 4: Europe Hyperspectral Imaging Market Revenue (Million), by Country 2024 & 2032
- Figure 5: Europe Hyperspectral Imaging Market Revenue Share (%), by Country 2024 & 2032
- Figure 6: Asia Pacific Hyperspectral Imaging Market Revenue (Million), by Country 2024 & 2032
- Figure 7: Asia Pacific Hyperspectral Imaging Market Revenue Share (%), by Country 2024 & 2032
- Figure 8: South America Hyperspectral Imaging Market Revenue (Million), by Country 2024 & 2032
- Figure 9: South America Hyperspectral Imaging Market Revenue Share (%), by Country 2024 & 2032
- Figure 10: North America Hyperspectral Imaging Market Revenue (Million), by Country 2024 & 2032
- Figure 11: North America Hyperspectral Imaging Market Revenue Share (%), by Country 2024 & 2032
- Figure 12: MEA Hyperspectral Imaging Market Revenue (Million), by Country 2024 & 2032
- Figure 13: MEA Hyperspectral Imaging Market Revenue Share (%), by Country 2024 & 2032
- Figure 14: North America Hyperspectral Imaging Market Revenue (Million), by End-user Industry 2024 & 2032
- Figure 15: North America Hyperspectral Imaging Market Revenue Share (%), by End-user Industry 2024 & 2032
- Figure 16: North America Hyperspectral Imaging Market Revenue (Million), by Country 2024 & 2032
- Figure 17: North America Hyperspectral Imaging Market Revenue Share (%), by Country 2024 & 2032
- Figure 18: Europe Hyperspectral Imaging Market Revenue (Million), by End-user Industry 2024 & 2032
- Figure 19: Europe Hyperspectral Imaging Market Revenue Share (%), by End-user Industry 2024 & 2032
- Figure 20: Europe Hyperspectral Imaging Market Revenue (Million), by Country 2024 & 2032
- Figure 21: Europe Hyperspectral Imaging Market Revenue Share (%), by Country 2024 & 2032
- Figure 22: Asia Hyperspectral Imaging Market Revenue (Million), by End-user Industry 2024 & 2032
- Figure 23: Asia Hyperspectral Imaging Market Revenue Share (%), by End-user Industry 2024 & 2032
- Figure 24: Asia Hyperspectral Imaging Market Revenue (Million), by Country 2024 & 2032
- Figure 25: Asia Hyperspectral Imaging Market Revenue Share (%), by Country 2024 & 2032
- Figure 26: Australia and New Zealand Hyperspectral Imaging Market Revenue (Million), by End-user Industry 2024 & 2032
- Figure 27: Australia and New Zealand Hyperspectral Imaging Market Revenue Share (%), by End-user Industry 2024 & 2032
- Figure 28: Australia and New Zealand Hyperspectral Imaging Market Revenue (Million), by Country 2024 & 2032
- Figure 29: Australia and New Zealand Hyperspectral Imaging Market Revenue Share (%), by Country 2024 & 2032
- Figure 30: Latin America Hyperspectral Imaging Market Revenue (Million), by End-user Industry 2024 & 2032
- Figure 31: Latin America Hyperspectral Imaging Market Revenue Share (%), by End-user Industry 2024 & 2032
- Figure 32: Latin America Hyperspectral Imaging Market Revenue (Million), by Country 2024 & 2032
- Figure 33: Latin America Hyperspectral Imaging Market Revenue Share (%), by Country 2024 & 2032
- Figure 34: Middle East and Africa Hyperspectral Imaging Market Revenue (Million), by End-user Industry 2024 & 2032
- Figure 35: Middle East and Africa Hyperspectral Imaging Market Revenue Share (%), by End-user Industry 2024 & 2032
- Figure 36: Middle East and Africa Hyperspectral Imaging Market Revenue (Million), by Country 2024 & 2032
- Figure 37: Middle East and Africa Hyperspectral Imaging Market Revenue Share (%), by Country 2024 & 2032
List of Tables
- Table 1: Global Hyperspectral Imaging Market Revenue Million Forecast, by Region 2019 & 2032
- Table 2: Global Hyperspectral Imaging Market Revenue Million Forecast, by End-user Industry 2019 & 2032
- Table 3: Global Hyperspectral Imaging Market Revenue Million Forecast, by Region 2019 & 2032
- Table 4: Global Hyperspectral Imaging Market Revenue Million Forecast, by Country 2019 & 2032
- Table 5: United States Hyperspectral Imaging Market Revenue (Million) Forecast, by Application 2019 & 2032
- Table 6: Canada Hyperspectral Imaging Market Revenue (Million) Forecast, by Application 2019 & 2032
- Table 7: Mexico Hyperspectral Imaging Market Revenue (Million) Forecast, by Application 2019 & 2032
- Table 8: Global Hyperspectral Imaging Market Revenue Million Forecast, by Country 2019 & 2032
- Table 9: Germany Hyperspectral Imaging Market Revenue (Million) Forecast, by Application 2019 & 2032
- Table 10: United Kingdom Hyperspectral Imaging Market Revenue (Million) Forecast, by Application 2019 & 2032
- Table 11: France Hyperspectral Imaging Market Revenue (Million) Forecast, by Application 2019 & 2032
- Table 12: Spain Hyperspectral Imaging Market Revenue (Million) Forecast, by Application 2019 & 2032
- Table 13: Italy Hyperspectral Imaging Market Revenue (Million) Forecast, by Application 2019 & 2032
- Table 14: Spain Hyperspectral Imaging Market Revenue (Million) Forecast, by Application 2019 & 2032
- Table 15: Belgium Hyperspectral Imaging Market Revenue (Million) Forecast, by Application 2019 & 2032
- Table 16: Netherland Hyperspectral Imaging Market Revenue (Million) Forecast, by Application 2019 & 2032
- Table 17: Nordics Hyperspectral Imaging Market Revenue (Million) Forecast, by Application 2019 & 2032
- Table 18: Rest of Europe Hyperspectral Imaging Market Revenue (Million) Forecast, by Application 2019 & 2032
- Table 19: Global Hyperspectral Imaging Market Revenue Million Forecast, by Country 2019 & 2032
- Table 20: China Hyperspectral Imaging Market Revenue (Million) Forecast, by Application 2019 & 2032
- Table 21: Japan Hyperspectral Imaging Market Revenue (Million) Forecast, by Application 2019 & 2032
- Table 22: India Hyperspectral Imaging Market Revenue (Million) Forecast, by Application 2019 & 2032
- Table 23: South Korea Hyperspectral Imaging Market Revenue (Million) Forecast, by Application 2019 & 2032
- Table 24: Southeast Asia Hyperspectral Imaging Market Revenue (Million) Forecast, by Application 2019 & 2032
- Table 25: Australia Hyperspectral Imaging Market Revenue (Million) Forecast, by Application 2019 & 2032
- Table 26: Indonesia Hyperspectral Imaging Market Revenue (Million) Forecast, by Application 2019 & 2032
- Table 27: Phillipes Hyperspectral Imaging Market Revenue (Million) Forecast, by Application 2019 & 2032
- Table 28: Singapore Hyperspectral Imaging Market Revenue (Million) Forecast, by Application 2019 & 2032
- Table 29: Thailandc Hyperspectral Imaging Market Revenue (Million) Forecast, by Application 2019 & 2032
- Table 30: Rest of Asia Pacific Hyperspectral Imaging Market Revenue (Million) Forecast, by Application 2019 & 2032
- Table 31: Global Hyperspectral Imaging Market Revenue Million Forecast, by Country 2019 & 2032
- Table 32: Brazil Hyperspectral Imaging Market Revenue (Million) Forecast, by Application 2019 & 2032
- Table 33: Argentina Hyperspectral Imaging Market Revenue (Million) Forecast, by Application 2019 & 2032
- Table 34: Peru Hyperspectral Imaging Market Revenue (Million) Forecast, by Application 2019 & 2032
- Table 35: Chile Hyperspectral Imaging Market Revenue (Million) Forecast, by Application 2019 & 2032
- Table 36: Colombia Hyperspectral Imaging Market Revenue (Million) Forecast, by Application 2019 & 2032
- Table 37: Ecuador Hyperspectral Imaging Market Revenue (Million) Forecast, by Application 2019 & 2032
- Table 38: Venezuela Hyperspectral Imaging Market Revenue (Million) Forecast, by Application 2019 & 2032
- Table 39: Rest of South America Hyperspectral Imaging Market Revenue (Million) Forecast, by Application 2019 & 2032
- Table 40: Global Hyperspectral Imaging Market Revenue Million Forecast, by Country 2019 & 2032
- Table 41: United States Hyperspectral Imaging Market Revenue (Million) Forecast, by Application 2019 & 2032
- Table 42: Canada Hyperspectral Imaging Market Revenue (Million) Forecast, by Application 2019 & 2032
- Table 43: Mexico Hyperspectral Imaging Market Revenue (Million) Forecast, by Application 2019 & 2032
- Table 44: Global Hyperspectral Imaging Market Revenue Million Forecast, by Country 2019 & 2032
- Table 45: United Arab Emirates Hyperspectral Imaging Market Revenue (Million) Forecast, by Application 2019 & 2032
- Table 46: Saudi Arabia Hyperspectral Imaging Market Revenue (Million) Forecast, by Application 2019 & 2032
- Table 47: South Africa Hyperspectral Imaging Market Revenue (Million) Forecast, by Application 2019 & 2032
- Table 48: Rest of Middle East and Africa Hyperspectral Imaging Market Revenue (Million) Forecast, by Application 2019 & 2032
- Table 49: Global Hyperspectral Imaging Market Revenue Million Forecast, by End-user Industry 2019 & 2032
- Table 50: Global Hyperspectral Imaging Market Revenue Million Forecast, by Country 2019 & 2032
- Table 51: Global Hyperspectral Imaging Market Revenue Million Forecast, by End-user Industry 2019 & 2032
- Table 52: Global Hyperspectral Imaging Market Revenue Million Forecast, by Country 2019 & 2032
- Table 53: Global Hyperspectral Imaging Market Revenue Million Forecast, by End-user Industry 2019 & 2032
- Table 54: Global Hyperspectral Imaging Market Revenue Million Forecast, by Country 2019 & 2032
- Table 55: Global Hyperspectral Imaging Market Revenue Million Forecast, by End-user Industry 2019 & 2032
- Table 56: Global Hyperspectral Imaging Market Revenue Million Forecast, by Country 2019 & 2032
- Table 57: Global Hyperspectral Imaging Market Revenue Million Forecast, by End-user Industry 2019 & 2032
- Table 58: Global Hyperspectral Imaging Market Revenue Million Forecast, by Country 2019 & 2032
- Table 59: Global Hyperspectral Imaging Market Revenue Million Forecast, by End-user Industry 2019 & 2032
- Table 60: Global Hyperspectral Imaging Market Revenue Million Forecast, by Country 2019 & 2032
Frequently Asked Questions
1. What is the projected Compound Annual Growth Rate (CAGR) of the Hyperspectral Imaging Market?
The projected CAGR is approximately 15.46%.
2. Which companies are prominent players in the Hyperspectral Imaging Market?
Key companies in the market include Surface Optics Corporation, HyperMed Imaging Inc, Resonon Inc, Specim Spectral Imaging Ltd, HinaLea Imaging (TruTag Technologies Inc ), Headwall Photonics Inc, Telops Inc, Cubert GmbH, BaySpec Inc, Galileo Group Inc, XIMEA GmbH, Norsk Elektro Optikk AS, Brimrose Corporation of America, Corning Incorporated, ITRES Research Limited.
3. What are the main segments of the Hyperspectral Imaging Market?
The market segments include End-user Industry.
4. Can you provide details about the market size?
The market size is estimated to be USD 226.08 Million as of 2022.
5. What are some drivers contributing to market growth?
Technological Advancements; Increasing Demand for Data Accuracy and Consistency.
6. What are the notable trends driving market growth?
Healthcare to be the Fastest Growing End User Segment.
7. Are there any restraints impacting market growth?
High Costs Associated with the Use of Hyperspectral Imaging.
8. Can you provide examples of recent developments in the market?
December 2023 - SPECIM recently launched an upgraded FX50 middle wave infrared hyperspectral camera model. The camera covers the full mid-wave infrared spectral range of 2.7 - 5.3 μm and has a 640-pixel spatial resolution, 35 nm spectral resolution, 30 μm adequate pixel size, and a maximum frame rate of 377 fps.
9. What pricing options are available for accessing the report?
Pricing options include single-user, multi-user, and enterprise licenses priced at USD 4750, USD 5250, and USD 8750 respectively.
10. Is the market size provided in terms of value or volume?
The market size is provided in terms of value, measured in Million.
11. Are there any specific market keywords associated with the report?
Yes, the market keyword associated with the report is "Hyperspectral Imaging Market," which aids in identifying and referencing the specific market segment covered.
12. How do I determine which pricing option suits my needs best?
The pricing options vary based on user requirements and access needs. Individual users may opt for single-user licenses, while businesses requiring broader access may choose multi-user or enterprise licenses for cost-effective access to the report.
13. Are there any additional resources or data provided in the Hyperspectral Imaging Market report?
While the report offers comprehensive insights, it's advisable to review the specific contents or supplementary materials provided to ascertain if additional resources or data are available.
14. How can I stay updated on further developments or reports in the Hyperspectral Imaging Market?
To stay informed about further developments, trends, and reports in the Hyperspectral Imaging Market, consider subscribing to industry newsletters, following relevant companies and organizations, or regularly checking reputable industry news sources and publications.
Methodology
Step 1 - Identification of Relevant Samples Size from Population Database


Step 2 - Approaches for Defining Global Market Size (Value, Volume* & Price*)

Note*: In applicable scenarios
Step 3 - Data Sources
Primary Research
- Web Analytics
- Survey Reports
- Research Institute
- Latest Research Reports
- Opinion Leaders
Secondary Research
- Annual Reports
- White Paper
- Latest Press Release
- Industry Association
- Paid Database
- Investor Presentations

Step 4 - Data Triangulation
Involves using different sources of information in order to increase the validity of a study
These sources are likely to be stakeholders in a program - participants, other researchers, program staff, other community members, and so on.
Then we put all data in single framework & apply various statistical tools to find out the dynamic on the market.
During the analysis stage, feedback from the stakeholder groups would be compared to determine areas of agreement as well as areas of divergence
