

Key Insights
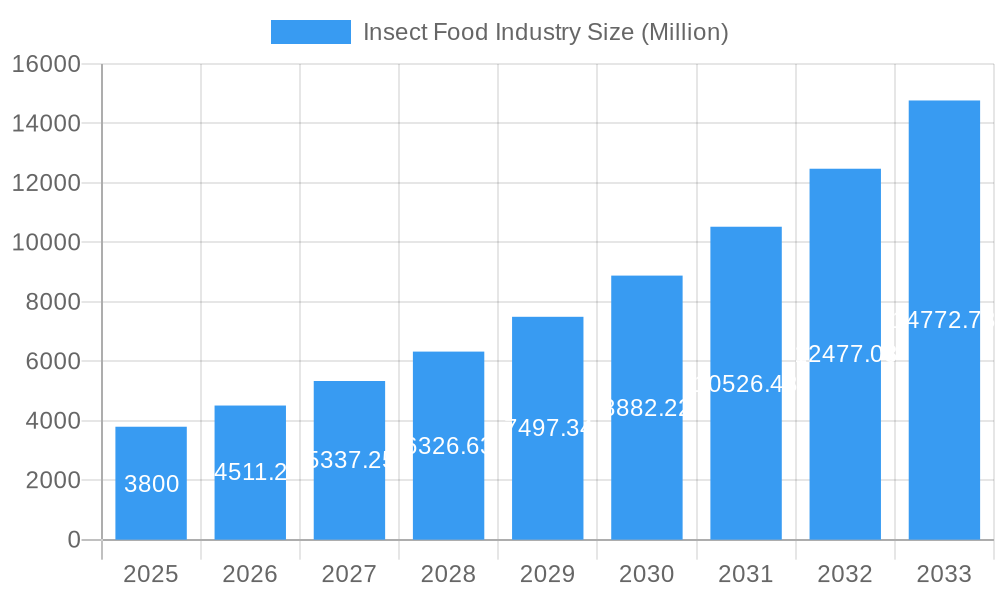
The insect food industry, valued at $3.80 billion in 2025, is experiencing robust growth, projected to expand at a Compound Annual Growth Rate (CAGR) of 18.89% from 2025 to 2033. This surge is driven by several key factors. Increasing consumer awareness of the environmental benefits of entomophagy (insect consumption) – significantly lower carbon footprint and land usage compared to traditional livestock – is a major driver. Growing concerns about food security and the need for sustainable protein sources are further fueling market expansion. The rising popularity of insect-based protein in dietary supplements, pet food, and functional foods is also contributing to this growth trajectory. Furthermore, technological advancements in insect farming, processing, and product development are enhancing the appeal and accessibility of insect-based foods, overcoming consumer apprehension through improved palatability and product diversity. Beetles, caterpillars, and Hymenoptera (ants, bees, wasps) currently dominate the insect types market segment, though other types are gaining traction as research expands the culinary applications of various insects. The "as a whole" product type currently commands a significant market share, while "as an ingredient" segment is witnessing remarkable growth, with innovations in incorporating insect flour and protein concentrates into processed foods.
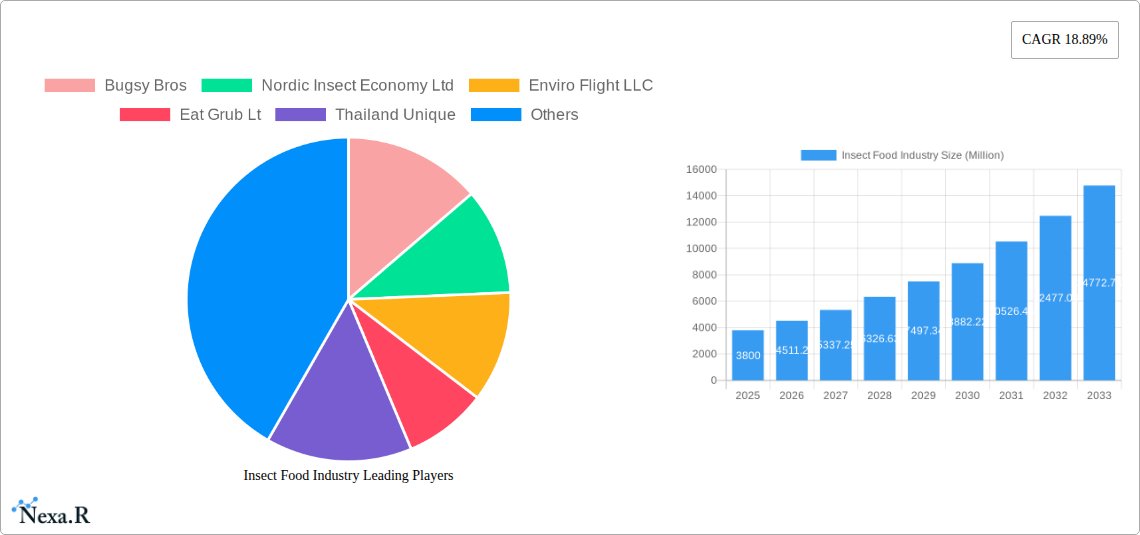
Insect Food Industry Market Size (In Billion)
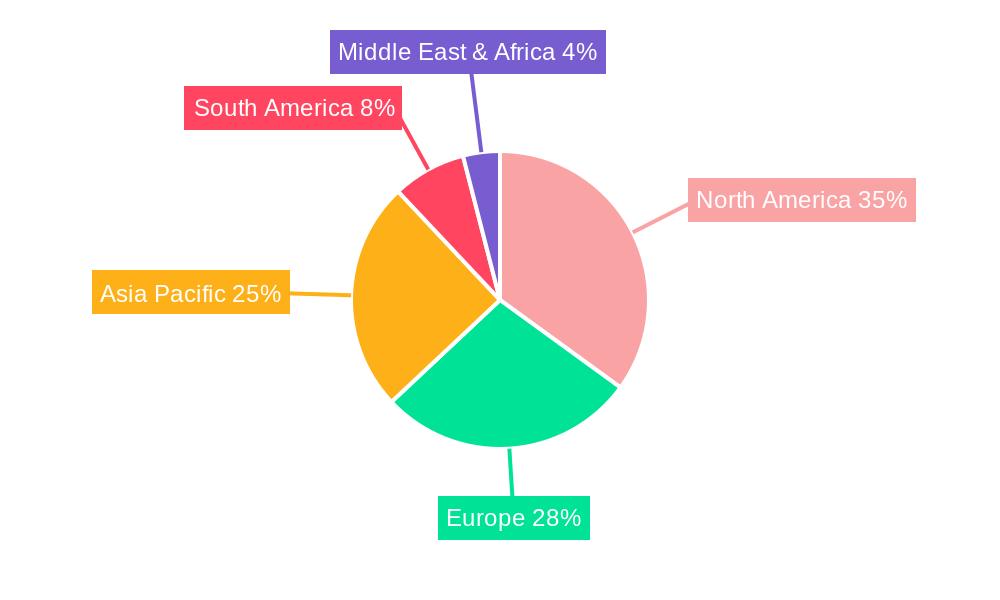
Geographical distribution reveals a dynamic landscape. North America, with its established health-conscious consumer base and significant investments in sustainable food solutions, holds a substantial market share. Europe follows closely, driven by strong consumer interest in innovative and sustainable food products and a supportive regulatory environment. Asia-Pacific, particularly China and Thailand, are emerging as key markets, reflecting growing populations, rising disposable incomes, and a rich history of insect consumption. While the South American and Middle Eastern markets are currently smaller, they present substantial growth opportunities as consumer awareness and acceptance increase. The industry's future will be shaped by regulatory developments, overcoming consumer perceptions, and sustained innovation in product diversification and processing technologies. Further investment in research and development is needed to unlock the full potential of insect-based food products and build upon the burgeoning global market.
Insect Food Industry Company Market Share
Insect Food Industry Market Report: 2019-2033
This comprehensive report provides a detailed analysis of the insect food industry, encompassing market dynamics, growth trends, key players, and future outlook. With a focus on the parent market of alternative protein sources and the child market of edible insects, this report is an essential resource for industry professionals, investors, and researchers seeking to understand this rapidly evolving sector. The study period covers 2019-2033, with a base year of 2025 and a forecast period of 2025-2033. The report utilizes both quantitative and qualitative data to offer a complete picture of the market landscape. Estimated market values are presented in million units.
Insect Food Industry Market Dynamics & Structure
The insect food market is currently undergoing a phase of notable consolidation, characterized by substantial investment inflows and a rise in mergers and acquisitions. Technological advancements, particularly in automated insect farming techniques and efficient processing methods, are proving to be pivotal drivers of growth. However, the landscape remains complex due to the diverse and evolving regulatory frameworks across different geographical regions, which present both significant opportunities and considerable challenges for market participants. While consumer acceptance is steadily increasing, it still represents a key area requiring strategic focus and education to overcome ingrained perceptions. The competitive environment includes established protein sources and a growing array of other novel protein alternatives. The demographic profile of end-users is also broadening, moving beyond early adopters to encompass a more mainstream consumer base increasingly drawn to the health and sustainability benefits.
- Market Concentration: The top 5 players are projected to hold approximately xx% of the market share by 2024. Continued consolidation is anticipated throughout the forecast period, extending to 2033.
- Technological Innovation: Key areas of focus include the implementation of advanced automation in farming operations, precision agriculture techniques for optimal insect rearing, and the development of highly efficient processing technologies for transforming insects into marketable food products.
- Regulatory Frameworks: The absence of uniform regulations across various regions presents a significant hurdle for market growth and the standardization of insect-based food products. Harmonization efforts are crucial for wider adoption.
- Competitive Substitutes: The market competes with a wide range of alternatives, including traditional animal proteins (meat, poultry, fish), widely adopted plant-based proteins, and emerging technologies like lab-grown or cultivated meat.
- End-User Demographics: The consumer base is rapidly expanding beyond niche health-conscious and environmentally aware groups. A significant shift is observed towards appealing to broader consumer segments driven by an increasing awareness of health benefits and the imperative of sustainable food systems.
- M&A Trends: The insect food industry has witnessed a significant uptick in merger and acquisition activities in recent years. With xx deals recorded in 2024 and an estimated xx predicted for 2025, these trends strongly indicate ongoing industry consolidation and strategic realignment.
Insect Food Industry Growth Trends & Insights
The insect food market is demonstrating robust and sustained growth, primarily propelled by escalating consumer demand for protein sources that are both environmentally sustainable and nutritionally superior. The market size has undergone a significant expansion, growing from an estimated xx million in 2019 to a projected xx million by 2025. This upward trajectory is expected to continue with a Compound Annual Growth Rate (CAGR) of xx% from 2025 to 2033. This remarkable expansion is a direct reflection of heightened global awareness regarding the substantial environmental advantages of insect farming compared to conventional livestock, as well as the impressive nutritional profile of insect-derived products. Furthermore, ongoing technological advancements are actively contributing to the reduction of production costs and the enhancement of product quality, thereby accelerating broader market adoption. Shifts in consumer behavior, leaning towards healthier dietary choices and a greater emphasis on sustainable consumption, are creating highly favorable conditions for continued market expansion. Evolving dietary preferences and a heightened sense of urgency around climate change mitigation are collectively fostering increased acceptance and demand for insect-based food alternatives.
Dominant Regions, Countries, or Segments in Insect Food Industry
Currently, Europe and North America are the leading regions for the insect food industry, with significant growth also observed in parts of Asia. Within insect types, beetles and crickets (Orthoptera) dominate the market due to their ease of farming and consumer acceptance. The "As a Whole" product type currently holds the largest market share, followed by "Raw: As a Ingredient" used in other food products.
- Leading Region: Europe (xx% market share in 2025). Strong regulatory support and consumer awareness contribute to its dominance.
- Leading Country: Netherlands (xx% of European market share). Known for supportive policies and a thriving insect farming sector.
- Leading Insect Type: Beetles (xx% market share). High protein content and ease of cultivation contribute to their market dominance.
- Leading Product Type: As a Whole (xx% market share). Consumer preference for ready-to-eat products boosts its dominance.
- Key Drivers: Government initiatives promoting sustainable food systems, increasing consumer awareness of the environmental and nutritional benefits of insects, and technological advances leading to more efficient and cost-effective insect farming.
Insect Food Industry Product Landscape
The insect food product landscape is diversifying rapidly, with innovations focusing on improving taste, texture, and overall consumer appeal. Products range from whole insects to flours, protein bars, and other processed foods. Technological advancements are enhancing insect farming techniques, improving product quality and consistency. Unique selling propositions often highlight the sustainability, nutritional value, and novel culinary experiences associated with insect-based products.
Key Drivers, Barriers & Challenges in Insect Food Industry
Key Drivers: Growing demand for sustainable protein sources, rising awareness of environmental impacts of traditional livestock farming, increasing consumer acceptance of alternative protein sources, and technological advancements leading to more efficient and cost-effective insect farming.
Challenges: Negative consumer perception, regulatory uncertainties in various regions, limited supply chain infrastructure, and competition from established protein sources. The lack of standardization and consumer education contributes to a limited market penetration (currently at xx% in 2025).
Emerging Opportunities in Insect Food Industry
Emerging opportunities include expanding into new markets, developing innovative product applications (e.g., pet food, aquaculture feed), and catering to evolving consumer preferences for sustainable and ethical food choices. Focusing on product diversification, improving processing techniques to enhance taste and texture, and building strong supply chains are key to capitalizing on these opportunities.
Growth Accelerators in the Insect Food Industry
Technological breakthroughs in insect farming and processing, strategic partnerships between insect producers and food companies, and expansion into new geographical markets are key growth accelerators. Government policies supporting sustainable agriculture and increased consumer education play crucial roles in driving long-term growth. The potential for insect-based products in diverse sectors, such as pet food and animal feed, presents significant growth avenues.
Key Players Shaping the Insect Food Industry Market
- Bugsy Bros
- Nordic Insect Economy Ltd
- Enviro Flight LLC
- Eat Grub Ltd
- Thailand Unique
- Exo Inc
- Proti-Farm
- Entomo Farms Ltd
- Deli Bugs Ltd
- Kreca Ento-Feed BV
Notable Milestones in Insect Food Industry Sector
- September 2022: Lotte Confectionery, a major South Korean confectionery company, and Aspire Food Group, a global leader in insect farming, formalized a Memorandum of Understanding (MOU) to explore and develop innovative protein alternatives and edible insect products.
- September 2022: InnovaFeed, a leading insect farming company, successfully secured USD 250 million in funding. This significant investment is earmarked for the expansion of its black soldier fly production facilities, aiming to scale up its operations and meet growing market demand.
- April 2022: The ValuSect consortium, an initiative dedicated to advancing the edible insect sector, provided EUR 460,000 in specialized services and support to 18 nascent and established edible insect enterprises, fostering their growth and innovation.
In-Depth Insect Food Industry Market Outlook
The insect food industry is strategically positioned for substantial future growth, fueled by a confluence of factors including escalating consumer interest in sustainable and nutritious food options, continuous technological innovation in production and processing, and the emergence of supportive policy and regulatory initiatives. The long-term outlook for the sector is exceptionally positive, characterized by a significant potential for market expansion across a diverse range of product categories and a broad spectrum of geographical regions. Strategic alliances, collaborative partnerships, and well-executed market penetration strategies will be paramount for companies aiming to achieve sustained success and capitalize on emerging opportunities. Projections for 2033 indicate a market size reaching approximately xx million, underscoring the profound growth trajectory anticipated for this dynamic sector.
Insect Food Industry Segmentation
- 1. Production Analysis
- 2. Consumption Analysis
- 3. Import Market Analysis (Value & Volume)
- 4. Export Market Analysis (Value & Volume)
- 5. Price Trend Analysis
Insect Food Industry Segmentation By Geography
-
1. North America
- 1.1. United States
- 1.2. Canada
- 1.3. Mexico
-
2. South America
- 2.1. Brazil
- 2.2. Argentina
- 2.3. Rest of South America
-
3. Europe
- 3.1. United Kingdom
- 3.2. Germany
- 3.3. France
- 3.4. Italy
- 3.5. Spain
- 3.6. Russia
- 3.7. Benelux
- 3.8. Nordics
- 3.9. Rest of Europe
-
4. Middle East & Africa
- 4.1. Turkey
- 4.2. Israel
- 4.3. GCC
- 4.4. North Africa
- 4.5. South Africa
- 4.6. Rest of Middle East & Africa
-
5. Asia Pacific
- 5.1. China
- 5.2. India
- 5.3. Japan
- 5.4. South Korea
- 5.5. ASEAN
- 5.6. Oceania
- 5.7. Rest of Asia Pacific
Insect Food Industry Regional Market Share
Geographic Coverage of Insect Food Industry
Insect Food Industry REPORT HIGHLIGHTS
| Aspects | Details |
|---|---|
| Study Period | 2020-2034 |
| Base Year | 2025 |
| Estimated Year | 2026 |
| Forecast Period | 2026-2034 |
| Historical Period | 2020-2025 |
| Growth Rate | CAGR of 18.89% from 2020-2034 |
| Segmentation |
|
Table of Contents
- 1. Introduction
- 1.1. Research Scope
- 1.2. Market Segmentation
- 1.3. Research Objective
- 1.4. Definitions and Assumptions
- 2. Executive Summary
- 2.1. Market Snapshot
- 3. Market Dynamics
- 3.1. Market Drivers
- 3.2. Market Restrains
- 3.3. Market Trends
- 3.4. Market Opportunities
- 4. Market Factor Analysis
- 4.1. Porters Five Forces
- 4.1.1. Bargaining Power of Suppliers
- 4.1.2. Bargaining Power of Buyers
- 4.1.3. Threat of New Entrants
- 4.1.4. Threat of Substitutes
- 4.1.5. Competitive Rivalry
- 4.2. PESTEL analysis
- 4.3. BCG Analysis
- 4.3.1. Stars (High Growth, High Market Share)
- 4.3.2. Cash Cows (Low Growth, High Market Share)
- 4.3.3. Question Mark (High Growth, Low Market Share)
- 4.3.4. Dogs (Low Growth, Low Market Share)
- 4.4. Ansoff Matrix Analysis
- 4.5. Supply Chain Analysis
- 4.6. Regulatory Landscape
- 4.7. Current Market Potential and Opportunity Assessment (TAM–SAM–SOM Framework)
- 4.8. NRP Analyst Note
- 4.1. Porters Five Forces
- 5. Market Analysis, Insights and Forecast 2021-2033
- 5.1. Market Analysis, Insights and Forecast - by Production Analysis
- 5.2. Market Analysis, Insights and Forecast - by Consumption Analysis
- 5.3. Market Analysis, Insights and Forecast - by Import Market Analysis (Value & Volume)
- 5.4. Market Analysis, Insights and Forecast - by Export Market Analysis (Value & Volume)
- 5.5. Market Analysis, Insights and Forecast - by Price Trend Analysis
- 5.6. Market Analysis, Insights and Forecast - by Region
- 5.6.1. North America
- 5.6.2. South America
- 5.6.3. Europe
- 5.6.4. Middle East & Africa
- 5.6.5. Asia Pacific
- 6. Global Insect Food Industry Analysis, Insights and Forecast, 2021-2033
- 6.1. Market Analysis, Insights and Forecast - by Production Analysis
- 6.2. Market Analysis, Insights and Forecast - by Consumption Analysis
- 6.3. Market Analysis, Insights and Forecast - by Import Market Analysis (Value & Volume)
- 6.4. Market Analysis, Insights and Forecast - by Export Market Analysis (Value & Volume)
- 6.5. Market Analysis, Insights and Forecast - by Price Trend Analysis
- 7. North America Insect Food Industry Analysis, Insights and Forecast, 2020-2032
- 7.1. Market Analysis, Insights and Forecast - by Production Analysis
- 7.2. Market Analysis, Insights and Forecast - by Consumption Analysis
- 7.3. Market Analysis, Insights and Forecast - by Import Market Analysis (Value & Volume)
- 7.4. Market Analysis, Insights and Forecast - by Export Market Analysis (Value & Volume)
- 7.5. Market Analysis, Insights and Forecast - by Price Trend Analysis
- 8. South America Insect Food Industry Analysis, Insights and Forecast, 2020-2032
- 8.1. Market Analysis, Insights and Forecast - by Production Analysis
- 8.2. Market Analysis, Insights and Forecast - by Consumption Analysis
- 8.3. Market Analysis, Insights and Forecast - by Import Market Analysis (Value & Volume)
- 8.4. Market Analysis, Insights and Forecast - by Export Market Analysis (Value & Volume)
- 8.5. Market Analysis, Insights and Forecast - by Price Trend Analysis
- 9. Europe Insect Food Industry Analysis, Insights and Forecast, 2020-2032
- 9.1. Market Analysis, Insights and Forecast - by Production Analysis
- 9.2. Market Analysis, Insights and Forecast - by Consumption Analysis
- 9.3. Market Analysis, Insights and Forecast - by Import Market Analysis (Value & Volume)
- 9.4. Market Analysis, Insights and Forecast - by Export Market Analysis (Value & Volume)
- 9.5. Market Analysis, Insights and Forecast - by Price Trend Analysis
- 10. Middle East & Africa Insect Food Industry Analysis, Insights and Forecast, 2020-2032
- 10.1. Market Analysis, Insights and Forecast - by Production Analysis
- 10.2. Market Analysis, Insights and Forecast - by Consumption Analysis
- 10.3. Market Analysis, Insights and Forecast - by Import Market Analysis (Value & Volume)
- 10.4. Market Analysis, Insights and Forecast - by Export Market Analysis (Value & Volume)
- 10.5. Market Analysis, Insights and Forecast - by Price Trend Analysis
- 11. Asia Pacific Insect Food Industry Analysis, Insights and Forecast, 2020-2032
- 11.1. Market Analysis, Insights and Forecast - by Production Analysis
- 11.2. Market Analysis, Insights and Forecast - by Consumption Analysis
- 11.3. Market Analysis, Insights and Forecast - by Import Market Analysis (Value & Volume)
- 11.4. Market Analysis, Insights and Forecast - by Export Market Analysis (Value & Volume)
- 11.5. Market Analysis, Insights and Forecast - by Price Trend Analysis
- 12. Competitive Analysis
- 12.1. Company Profiles
- 12.1.1 Bugsy Bros
- 12.1.1.1. Company Overview
- 12.1.1.2. Products
- 12.1.1.3. Company Financials
- 12.1.1.4. SWOT Analysis
- 12.1.2 Nordic Insect Economy Ltd
- 12.1.2.1. Company Overview
- 12.1.2.2. Products
- 12.1.2.3. Company Financials
- 12.1.2.4. SWOT Analysis
- 12.1.3 Enviro Flight LLC
- 12.1.3.1. Company Overview
- 12.1.3.2. Products
- 12.1.3.3. Company Financials
- 12.1.3.4. SWOT Analysis
- 12.1.4 Eat Grub Lt
- 12.1.4.1. Company Overview
- 12.1.4.2. Products
- 12.1.4.3. Company Financials
- 12.1.4.4. SWOT Analysis
- 12.1.5 Thailand Unique
- 12.1.5.1. Company Overview
- 12.1.5.2. Products
- 12.1.5.3. Company Financials
- 12.1.5.4. SWOT Analysis
- 12.1.6 Exo Inc
- 12.1.6.1. Company Overview
- 12.1.6.2. Products
- 12.1.6.3. Company Financials
- 12.1.6.4. SWOT Analysis
- 12.1.7 Proti - Farm
- 12.1.7.1. Company Overview
- 12.1.7.2. Products
- 12.1.7.3. Company Financials
- 12.1.7.4. SWOT Analysis
- 12.1.8 Entomo Farms Ltd
- 12.1.8.1. Company Overview
- 12.1.8.2. Products
- 12.1.8.3. Company Financials
- 12.1.8.4. SWOT Analysis
- 12.1.9 Deli Bugs Ltd
- 12.1.9.1. Company Overview
- 12.1.9.2. Products
- 12.1.9.3. Company Financials
- 12.1.9.4. SWOT Analysis
- 12.1.10 Kreca Ento - Feed BV
- 12.1.10.1. Company Overview
- 12.1.10.2. Products
- 12.1.10.3. Company Financials
- 12.1.10.4. SWOT Analysis
- 12.1.1 Bugsy Bros
- 12.2. Market Entropy
- 12.2.1 Company's Key Areas Served
- 12.2.2 Recent Developments
- 12.3. Company Market Share Analysis 2025
- 12.3.1 Top 5 Companies Market Share Analysis
- 12.3.2 Top 3 Companies Market Share Analysis
- 12.4. List of Potential Customers
- 13. Research Methodology
List of Figures
- Figure 1: Global Insect Food Industry Revenue Breakdown (Million, %) by Region 2025 & 2033
- Figure 2: North America Insect Food Industry Revenue (Million), by Production Analysis 2025 & 2033
- Figure 3: North America Insect Food Industry Revenue Share (%), by Production Analysis 2025 & 2033
- Figure 4: North America Insect Food Industry Revenue (Million), by Consumption Analysis 2025 & 2033
- Figure 5: North America Insect Food Industry Revenue Share (%), by Consumption Analysis 2025 & 2033
- Figure 6: North America Insect Food Industry Revenue (Million), by Import Market Analysis (Value & Volume) 2025 & 2033
- Figure 7: North America Insect Food Industry Revenue Share (%), by Import Market Analysis (Value & Volume) 2025 & 2033
- Figure 8: North America Insect Food Industry Revenue (Million), by Export Market Analysis (Value & Volume) 2025 & 2033
- Figure 9: North America Insect Food Industry Revenue Share (%), by Export Market Analysis (Value & Volume) 2025 & 2033
- Figure 10: North America Insect Food Industry Revenue (Million), by Price Trend Analysis 2025 & 2033
- Figure 11: North America Insect Food Industry Revenue Share (%), by Price Trend Analysis 2025 & 2033
- Figure 12: North America Insect Food Industry Revenue (Million), by Country 2025 & 2033
- Figure 13: North America Insect Food Industry Revenue Share (%), by Country 2025 & 2033
- Figure 14: South America Insect Food Industry Revenue (Million), by Production Analysis 2025 & 2033
- Figure 15: South America Insect Food Industry Revenue Share (%), by Production Analysis 2025 & 2033
- Figure 16: South America Insect Food Industry Revenue (Million), by Consumption Analysis 2025 & 2033
- Figure 17: South America Insect Food Industry Revenue Share (%), by Consumption Analysis 2025 & 2033
- Figure 18: South America Insect Food Industry Revenue (Million), by Import Market Analysis (Value & Volume) 2025 & 2033
- Figure 19: South America Insect Food Industry Revenue Share (%), by Import Market Analysis (Value & Volume) 2025 & 2033
- Figure 20: South America Insect Food Industry Revenue (Million), by Export Market Analysis (Value & Volume) 2025 & 2033
- Figure 21: South America Insect Food Industry Revenue Share (%), by Export Market Analysis (Value & Volume) 2025 & 2033
- Figure 22: South America Insect Food Industry Revenue (Million), by Price Trend Analysis 2025 & 2033
- Figure 23: South America Insect Food Industry Revenue Share (%), by Price Trend Analysis 2025 & 2033
- Figure 24: South America Insect Food Industry Revenue (Million), by Country 2025 & 2033
- Figure 25: South America Insect Food Industry Revenue Share (%), by Country 2025 & 2033
- Figure 26: Europe Insect Food Industry Revenue (Million), by Production Analysis 2025 & 2033
- Figure 27: Europe Insect Food Industry Revenue Share (%), by Production Analysis 2025 & 2033
- Figure 28: Europe Insect Food Industry Revenue (Million), by Consumption Analysis 2025 & 2033
- Figure 29: Europe Insect Food Industry Revenue Share (%), by Consumption Analysis 2025 & 2033
- Figure 30: Europe Insect Food Industry Revenue (Million), by Import Market Analysis (Value & Volume) 2025 & 2033
- Figure 31: Europe Insect Food Industry Revenue Share (%), by Import Market Analysis (Value & Volume) 2025 & 2033
- Figure 32: Europe Insect Food Industry Revenue (Million), by Export Market Analysis (Value & Volume) 2025 & 2033
- Figure 33: Europe Insect Food Industry Revenue Share (%), by Export Market Analysis (Value & Volume) 2025 & 2033
- Figure 34: Europe Insect Food Industry Revenue (Million), by Price Trend Analysis 2025 & 2033
- Figure 35: Europe Insect Food Industry Revenue Share (%), by Price Trend Analysis 2025 & 2033
- Figure 36: Europe Insect Food Industry Revenue (Million), by Country 2025 & 2033
- Figure 37: Europe Insect Food Industry Revenue Share (%), by Country 2025 & 2033
- Figure 38: Middle East & Africa Insect Food Industry Revenue (Million), by Production Analysis 2025 & 2033
- Figure 39: Middle East & Africa Insect Food Industry Revenue Share (%), by Production Analysis 2025 & 2033
- Figure 40: Middle East & Africa Insect Food Industry Revenue (Million), by Consumption Analysis 2025 & 2033
- Figure 41: Middle East & Africa Insect Food Industry Revenue Share (%), by Consumption Analysis 2025 & 2033
- Figure 42: Middle East & Africa Insect Food Industry Revenue (Million), by Import Market Analysis (Value & Volume) 2025 & 2033
- Figure 43: Middle East & Africa Insect Food Industry Revenue Share (%), by Import Market Analysis (Value & Volume) 2025 & 2033
- Figure 44: Middle East & Africa Insect Food Industry Revenue (Million), by Export Market Analysis (Value & Volume) 2025 & 2033
- Figure 45: Middle East & Africa Insect Food Industry Revenue Share (%), by Export Market Analysis (Value & Volume) 2025 & 2033
- Figure 46: Middle East & Africa Insect Food Industry Revenue (Million), by Price Trend Analysis 2025 & 2033
- Figure 47: Middle East & Africa Insect Food Industry Revenue Share (%), by Price Trend Analysis 2025 & 2033
- Figure 48: Middle East & Africa Insect Food Industry Revenue (Million), by Country 2025 & 2033
- Figure 49: Middle East & Africa Insect Food Industry Revenue Share (%), by Country 2025 & 2033
- Figure 50: Asia Pacific Insect Food Industry Revenue (Million), by Production Analysis 2025 & 2033
- Figure 51: Asia Pacific Insect Food Industry Revenue Share (%), by Production Analysis 2025 & 2033
- Figure 52: Asia Pacific Insect Food Industry Revenue (Million), by Consumption Analysis 2025 & 2033
- Figure 53: Asia Pacific Insect Food Industry Revenue Share (%), by Consumption Analysis 2025 & 2033
- Figure 54: Asia Pacific Insect Food Industry Revenue (Million), by Import Market Analysis (Value & Volume) 2025 & 2033
- Figure 55: Asia Pacific Insect Food Industry Revenue Share (%), by Import Market Analysis (Value & Volume) 2025 & 2033
- Figure 56: Asia Pacific Insect Food Industry Revenue (Million), by Export Market Analysis (Value & Volume) 2025 & 2033
- Figure 57: Asia Pacific Insect Food Industry Revenue Share (%), by Export Market Analysis (Value & Volume) 2025 & 2033
- Figure 58: Asia Pacific Insect Food Industry Revenue (Million), by Price Trend Analysis 2025 & 2033
- Figure 59: Asia Pacific Insect Food Industry Revenue Share (%), by Price Trend Analysis 2025 & 2033
- Figure 60: Asia Pacific Insect Food Industry Revenue (Million), by Country 2025 & 2033
- Figure 61: Asia Pacific Insect Food Industry Revenue Share (%), by Country 2025 & 2033
List of Tables
- Table 1: Global Insect Food Industry Revenue Million Forecast, by Production Analysis 2020 & 2033
- Table 2: Global Insect Food Industry Revenue Million Forecast, by Consumption Analysis 2020 & 2033
- Table 3: Global Insect Food Industry Revenue Million Forecast, by Import Market Analysis (Value & Volume) 2020 & 2033
- Table 4: Global Insect Food Industry Revenue Million Forecast, by Export Market Analysis (Value & Volume) 2020 & 2033
- Table 5: Global Insect Food Industry Revenue Million Forecast, by Price Trend Analysis 2020 & 2033
- Table 6: Global Insect Food Industry Revenue Million Forecast, by Region 2020 & 2033
- Table 7: Global Insect Food Industry Revenue Million Forecast, by Production Analysis 2020 & 2033
- Table 8: Global Insect Food Industry Revenue Million Forecast, by Consumption Analysis 2020 & 2033
- Table 9: Global Insect Food Industry Revenue Million Forecast, by Import Market Analysis (Value & Volume) 2020 & 2033
- Table 10: Global Insect Food Industry Revenue Million Forecast, by Export Market Analysis (Value & Volume) 2020 & 2033
- Table 11: Global Insect Food Industry Revenue Million Forecast, by Price Trend Analysis 2020 & 2033
- Table 12: Global Insect Food Industry Revenue Million Forecast, by Country 2020 & 2033
- Table 13: United States Insect Food Industry Revenue (Million) Forecast, by Application 2020 & 2033
- Table 14: Canada Insect Food Industry Revenue (Million) Forecast, by Application 2020 & 2033
- Table 15: Mexico Insect Food Industry Revenue (Million) Forecast, by Application 2020 & 2033
- Table 16: Global Insect Food Industry Revenue Million Forecast, by Production Analysis 2020 & 2033
- Table 17: Global Insect Food Industry Revenue Million Forecast, by Consumption Analysis 2020 & 2033
- Table 18: Global Insect Food Industry Revenue Million Forecast, by Import Market Analysis (Value & Volume) 2020 & 2033
- Table 19: Global Insect Food Industry Revenue Million Forecast, by Export Market Analysis (Value & Volume) 2020 & 2033
- Table 20: Global Insect Food Industry Revenue Million Forecast, by Price Trend Analysis 2020 & 2033
- Table 21: Global Insect Food Industry Revenue Million Forecast, by Country 2020 & 2033
- Table 22: Brazil Insect Food Industry Revenue (Million) Forecast, by Application 2020 & 2033
- Table 23: Argentina Insect Food Industry Revenue (Million) Forecast, by Application 2020 & 2033
- Table 24: Rest of South America Insect Food Industry Revenue (Million) Forecast, by Application 2020 & 2033
- Table 25: Global Insect Food Industry Revenue Million Forecast, by Production Analysis 2020 & 2033
- Table 26: Global Insect Food Industry Revenue Million Forecast, by Consumption Analysis 2020 & 2033
- Table 27: Global Insect Food Industry Revenue Million Forecast, by Import Market Analysis (Value & Volume) 2020 & 2033
- Table 28: Global Insect Food Industry Revenue Million Forecast, by Export Market Analysis (Value & Volume) 2020 & 2033
- Table 29: Global Insect Food Industry Revenue Million Forecast, by Price Trend Analysis 2020 & 2033
- Table 30: Global Insect Food Industry Revenue Million Forecast, by Country 2020 & 2033
- Table 31: United Kingdom Insect Food Industry Revenue (Million) Forecast, by Application 2020 & 2033
- Table 32: Germany Insect Food Industry Revenue (Million) Forecast, by Application 2020 & 2033
- Table 33: France Insect Food Industry Revenue (Million) Forecast, by Application 2020 & 2033
- Table 34: Italy Insect Food Industry Revenue (Million) Forecast, by Application 2020 & 2033
- Table 35: Spain Insect Food Industry Revenue (Million) Forecast, by Application 2020 & 2033
- Table 36: Russia Insect Food Industry Revenue (Million) Forecast, by Application 2020 & 2033
- Table 37: Benelux Insect Food Industry Revenue (Million) Forecast, by Application 2020 & 2033
- Table 38: Nordics Insect Food Industry Revenue (Million) Forecast, by Application 2020 & 2033
- Table 39: Rest of Europe Insect Food Industry Revenue (Million) Forecast, by Application 2020 & 2033
- Table 40: Global Insect Food Industry Revenue Million Forecast, by Production Analysis 2020 & 2033
- Table 41: Global Insect Food Industry Revenue Million Forecast, by Consumption Analysis 2020 & 2033
- Table 42: Global Insect Food Industry Revenue Million Forecast, by Import Market Analysis (Value & Volume) 2020 & 2033
- Table 43: Global Insect Food Industry Revenue Million Forecast, by Export Market Analysis (Value & Volume) 2020 & 2033
- Table 44: Global Insect Food Industry Revenue Million Forecast, by Price Trend Analysis 2020 & 2033
- Table 45: Global Insect Food Industry Revenue Million Forecast, by Country 2020 & 2033
- Table 46: Turkey Insect Food Industry Revenue (Million) Forecast, by Application 2020 & 2033
- Table 47: Israel Insect Food Industry Revenue (Million) Forecast, by Application 2020 & 2033
- Table 48: GCC Insect Food Industry Revenue (Million) Forecast, by Application 2020 & 2033
- Table 49: North Africa Insect Food Industry Revenue (Million) Forecast, by Application 2020 & 2033
- Table 50: South Africa Insect Food Industry Revenue (Million) Forecast, by Application 2020 & 2033
- Table 51: Rest of Middle East & Africa Insect Food Industry Revenue (Million) Forecast, by Application 2020 & 2033
- Table 52: Global Insect Food Industry Revenue Million Forecast, by Production Analysis 2020 & 2033
- Table 53: Global Insect Food Industry Revenue Million Forecast, by Consumption Analysis 2020 & 2033
- Table 54: Global Insect Food Industry Revenue Million Forecast, by Import Market Analysis (Value & Volume) 2020 & 2033
- Table 55: Global Insect Food Industry Revenue Million Forecast, by Export Market Analysis (Value & Volume) 2020 & 2033
- Table 56: Global Insect Food Industry Revenue Million Forecast, by Price Trend Analysis 2020 & 2033
- Table 57: Global Insect Food Industry Revenue Million Forecast, by Country 2020 & 2033
- Table 58: China Insect Food Industry Revenue (Million) Forecast, by Application 2020 & 2033
- Table 59: India Insect Food Industry Revenue (Million) Forecast, by Application 2020 & 2033
- Table 60: Japan Insect Food Industry Revenue (Million) Forecast, by Application 2020 & 2033
- Table 61: South Korea Insect Food Industry Revenue (Million) Forecast, by Application 2020 & 2033
- Table 62: ASEAN Insect Food Industry Revenue (Million) Forecast, by Application 2020 & 2033
- Table 63: Oceania Insect Food Industry Revenue (Million) Forecast, by Application 2020 & 2033
- Table 64: Rest of Asia Pacific Insect Food Industry Revenue (Million) Forecast, by Application 2020 & 2033
Frequently Asked Questions
1. What is the projected Compound Annual Growth Rate (CAGR) of the Insect Food Industry?
The projected CAGR is approximately 18.89%.
2. Which companies are prominent players in the Insect Food Industry?
Key companies in the market include Bugsy Bros, Nordic Insect Economy Ltd, Enviro Flight LLC, Eat Grub Lt, Thailand Unique, Exo Inc, Proti - Farm, Entomo Farms Ltd, Deli Bugs Ltd, Kreca Ento - Feed BV.
3. What are the main segments of the Insect Food Industry?
The market segments include Production Analysis, Consumption Analysis, Import Market Analysis (Value & Volume), Export Market Analysis (Value & Volume), Price Trend Analysis.
4. Can you provide details about the market size?
The market size is estimated to be USD 3.80 Million as of 2022.
5. What are some drivers contributing to market growth?
Decreasing Per Capita Arable Land; Increased Demand for Food.
6. What are the notable trends driving market growth?
Easy Availability and High Protein Content in The Edible Insects.
7. Are there any restraints impacting market growth?
High Initial Investments; Requirement of Precision Agriculture.
8. Can you provide examples of recent developments in the market?
September 2022: Lotte Confectionery, a leading South Korean snack and ice cream maker, signed a memorandum of understanding (MOU) with Aspire Food Group, a Canadian firm renowned for its advanced insect agriculture and food technology, to cooperate in areas of protein alternatives and edible insects.
9. What pricing options are available for accessing the report?
Pricing options include single-user, multi-user, and enterprise licenses priced at USD 4750, USD 5250, and USD 8750 respectively.
10. Is the market size provided in terms of value or volume?
The market size is provided in terms of value, measured in Million.
11. Are there any specific market keywords associated with the report?
Yes, the market keyword associated with the report is "Insect Food Industry," which aids in identifying and referencing the specific market segment covered.
12. How do I determine which pricing option suits my needs best?
The pricing options vary based on user requirements and access needs. Individual users may opt for single-user licenses, while businesses requiring broader access may choose multi-user or enterprise licenses for cost-effective access to the report.
13. Are there any additional resources or data provided in the Insect Food Industry report?
While the report offers comprehensive insights, it's advisable to review the specific contents or supplementary materials provided to ascertain if additional resources or data are available.
14. How can I stay updated on further developments or reports in the Insect Food Industry?
To stay informed about further developments, trends, and reports in the Insect Food Industry, consider subscribing to industry newsletters, following relevant companies and organizations, or regularly checking reputable industry news sources and publications.
Methodology
Step 1 - Identification of Relevant Samples Size from Population Database


Step 2 - Approaches for Defining Global Market Size (Value, Volume* & Price*)

Note*: In applicable scenarios
Step 3 - Data Sources
Primary Research
- Web Analytics
- Survey Reports
- Research Institute
- Latest Research Reports
- Opinion Leaders
Secondary Research
- Annual Reports
- White Paper
- Latest Press Release
- Industry Association
- Paid Database
- Investor Presentations

Step 4 - Data Triangulation
Involves using different sources of information in order to increase the validity of a study
These sources are likely to be stakeholders in a program - participants, other researchers, program staff, other community members, and so on.
Then we put all data in single framework & apply various statistical tools to find out the dynamic on the market.
During the analysis stage, feedback from the stakeholder groups would be compared to determine areas of agreement as well as areas of divergence