

Key Insights
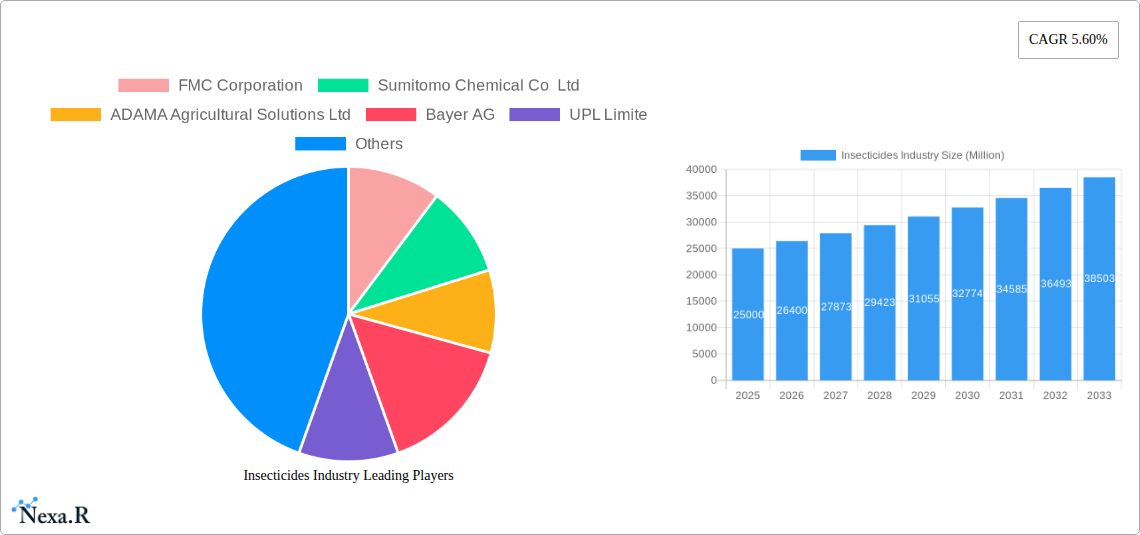
The global insecticides market is forecast to reach $8.36 billion by 2025, with a projected Compound Annual Growth Rate (CAGR) of 14.25% from 2025 to 2033. This growth is propelled by escalating global food demand requiring enhanced crop yields and the imperative for effective pest management. The increasing prevalence of insect resistance to conventional pesticides drives the adoption of advanced insecticide formulations. Evolving agricultural methodologies, including precision agriculture and Integrated Pest Management (IPM) strategies, further stimulate market expansion. The market is segmented by application (chemigation, foliar, fumigation, seed treatment, soil treatment) and crop type (commercial, fruits & vegetables, grains & cereals, pulses & oilseeds, turf & ornamental). Chemigation and foliar applications currently lead due to their proven efficacy. However, heightened environmental consciousness is fostering demand for bio-pesticides and sustainable pest control solutions, unlocking new market avenues. Key industry participants, including FMC Corporation, Sumitomo Chemical, Adama, Bayer, UPL, Syngenta, Jiangsu Yangnong, Corteva, Nufarm, and BASF, are instrumental in shaping market dynamics through innovation and strategic alliances.
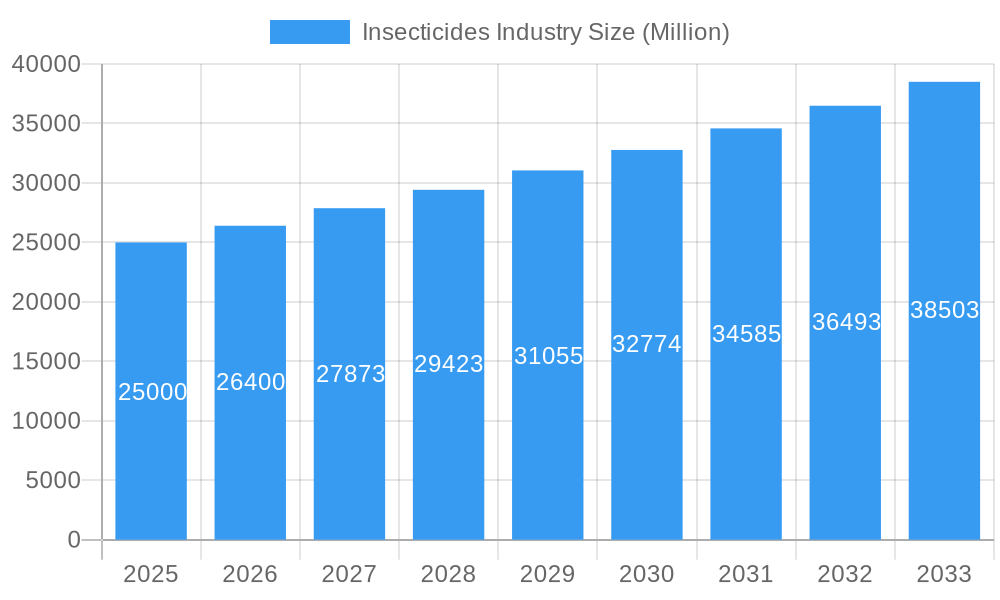
Insecticides Industry Market Size (In Billion)
Market growth is tempered by stringent regulatory frameworks for pesticide use, impacting product approvals and increasing R&D costs. Volatile raw material prices and environmental concerns associated with insecticide usage also present challenges. Nevertheless, ongoing advancements in developing targeted and eco-friendly insecticides, alongside significant R&D investments, are anticipated to offset these restraints. Market dominance is expected to remain with regions like North America, Europe, and Asia-Pacific, aligning with global agricultural output. Future growth trajectories will be shaped by technological innovations, evolving regulatory environments, and the widespread adoption of sustainable agricultural practices worldwide.
Insecticides Industry Company Market Share
Insecticides Industry Market Report: 2019-2033
This comprehensive report provides a detailed analysis of the Insecticides Industry, encompassing market dynamics, growth trends, regional segmentation, product landscape, and key players. The study period covers 2019-2033, with a base year of 2025 and a forecast period of 2025-2033. This in-depth analysis is crucial for industry professionals, investors, and stakeholders seeking a complete understanding of this vital sector. The report segments the market by application mode (Chemigation, Foliar, Fumigation, Seed Treatment, Soil Treatment) and crop type (Commercial Crops, Fruits & Vegetables, Grains & Cereals, Pulses & Oilseeds, Turf & Ornamental). Key players analyzed include FMC Corporation, Sumitomo Chemical Co Ltd, ADAMA Agricultural Solutions Ltd, Bayer AG, UPL Limited, Syngenta Group, Jiangsu Yangnong Chemical Co Ltd, Corteva Agriscience, Nufarm Ltd, and BASF SE.
Insecticides Industry Market Dynamics & Structure
The Insecticides Industry is characterized by moderate concentration, with a few multinational corporations holding significant market share. Technological innovation, driven by the need for more effective and sustainable pest control solutions, is a key driver. Stringent regulatory frameworks, varying across different regions, impact product development and market access. The market also faces competition from biological and other integrated pest management (IPM) approaches. End-user demographics, primarily farmers and agricultural businesses, are influenced by factors like farming practices, technological adoption, and economic conditions. Mergers and acquisitions (M&A) activity is moderately frequent, reflecting consolidation within the industry.
- Market Concentration: The top 10 companies hold approximately xx% of the global market share in 2025.
- Technological Innovation: Significant investments are made in developing novel insecticide formulations with improved efficacy and reduced environmental impact.
- Regulatory Landscape: Stringent regulations regarding pesticide registration and use vary significantly across different geographic regions, impacting market access and product development.
- Competitive Substitutes: Biopesticides and integrated pest management (IPM) strategies are posing increasing competition.
- M&A Activity: An estimated xx M&A deals occurred in the historical period (2019-2024), with an average deal value of xx million units.
- Innovation Barriers: High research and development costs, lengthy regulatory approval processes, and stringent environmental regulations pose significant barriers to innovation.
Insecticides Industry Growth Trends & Insights
The global insecticides market exhibited a CAGR of xx% during the historical period (2019-2024), reaching xx million units in 2024. This growth is driven by factors such as increasing crop production, rising pest resistance, expanding agricultural land, and the adoption of improved pest management practices. The market is expected to continue its growth trajectory, with a projected CAGR of xx% from 2025 to 2033, reaching an estimated xx million units by 2033. Technological disruptions, particularly in the development of targeted and bio-based insecticides, are transforming the market landscape. Consumer behavior is shifting toward a greater demand for sustainable and environmentally friendly pest control solutions.
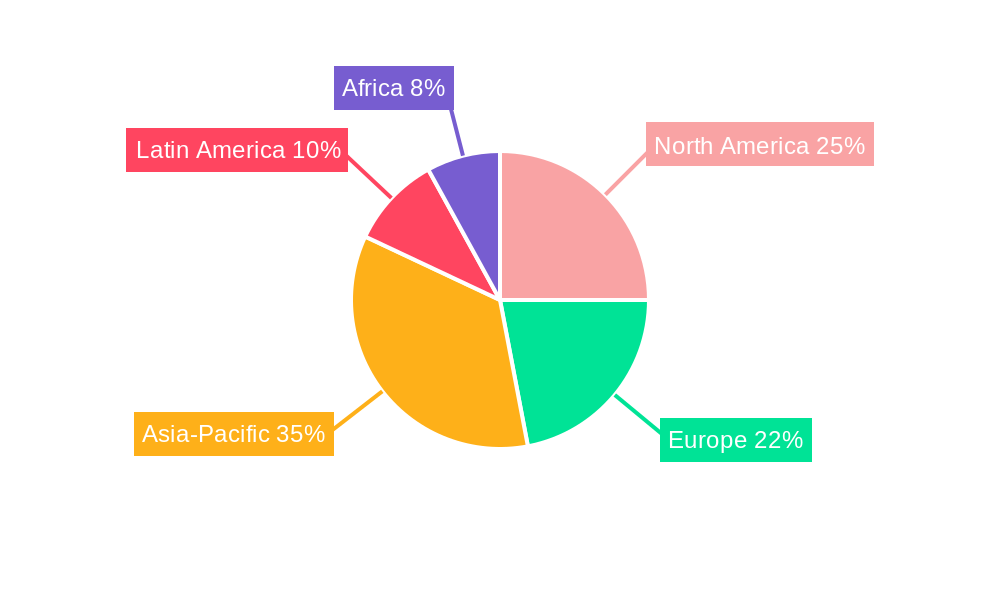
Dominant Regions, Countries, or Segments in Insecticides Industry
Asia-Pacific is currently the dominant region, followed by North America and Europe. Within application modes, foliar application holds the largest market share, driven by its widespread adoption across various crops. Among crop types, grains & cereals and fruits & vegetables are significant segments due to the high volume of production and susceptibility to pest infestations.
- Key Drivers in Asia-Pacific: Rapid growth in agricultural production, increasing pesticide adoption, and favorable government policies contribute to regional dominance.
- Foliar Application Dominance: Ease of application, cost-effectiveness, and broad applicability across diverse crops contribute to its market leadership.
- Growth Potential in Africa and Latin America: These regions offer significant untapped potential due to increasing agricultural activities and rising awareness of pest control.
- Grains & Cereals and Fruits & Vegetables: These segments contribute the largest share in crop type segment due to high susceptibility to various pests and larger acreage.
Insecticides Industry Product Landscape
The insecticides market offers a diverse range of products, including organophosphates, carbamates, pyrethroids, neonicotinoids, and biological insecticides. Recent innovations focus on enhancing efficacy, reducing environmental impact, and developing targeted pest control solutions. Unique selling propositions include improved selectivity, reduced toxicity, and enhanced compatibility with other crop protection products. Advancements in formulation technology (e.g., microencapsulation) lead to better performance and reduced application rates.
Key Drivers, Barriers & Challenges in Insecticides Industry
Key Drivers: Increasing crop production, rising pest resistance, expanding agricultural land, and growing awareness of crop protection needs are key drivers. Technological advancements leading to the development of more effective and sustainable products further propel growth.
Key Challenges: Stringent regulations, concerns about environmental impact, growing consumer preference for eco-friendly products and the high cost of R&D are significant hurdles. Supply chain disruptions due to geopolitical events and increased raw material prices pose a further challenge. The xx% increase in raw material prices during 2022-2023 caused a xx% increase in production costs, thereby impacting overall market profitability.
Emerging Opportunities in Insecticides Industry
Untapped markets in developing economies, particularly in Africa and parts of Asia, offer considerable opportunities. The increasing adoption of precision agriculture and smart farming technologies presents opportunities for the development of targeted and precision insecticide applications. Growing consumer demand for organic and bio-based insecticides opens avenues for innovation in this segment.
Growth Accelerators in the Insecticides Industry
Technological breakthroughs in the development of new active ingredients, more precise application methods, and innovative formulations are key growth accelerators. Strategic partnerships and collaborations among pesticide manufacturers, research institutions, and agricultural companies will accelerate innovation and product development. Expansion into new markets and geographies will also contribute to industry growth.
Key Players Shaping the Insecticides Industry Market
- FMC Corporation
- Sumitomo Chemical Co Ltd
- ADAMA Agricultural Solutions Ltd
- Bayer AG
- UPL Limited
- Syngenta Group
- Jiangsu Yangnong Chemical Co Ltd
- Corteva Agriscience
- Nufarm Ltd
- BASF SE
Notable Milestones in Insecticides Industry Sector
- September 2022: FMC launched Talstar Plus Insecticide in India for groundnut, cotton, and sugarcane crops.
- September 2022: FMC India launched Corprima insecticide combining Rynaxypyr technology for fruit borer control.
- January 2023: Bayer partnered with Oerth Bio to develop eco-friendly crop protection solutions.
In-Depth Insecticides Industry Market Outlook
The insecticides market is poised for sustained growth, driven by technological advancements, strategic partnerships, and the expansion into emerging markets. The increasing demand for sustainable and effective pest control solutions will shape product development and market dynamics. Companies focusing on innovation, sustainability, and market diversification will be best positioned to capitalize on future growth opportunities. The market is expected to reach xx million units by 2033, presenting significant potential for both established players and new entrants.
Insecticides Industry Segmentation
-
1. Application Mode
- 1.1. Chemigation
- 1.2. Foliar
- 1.3. Fumigation
- 1.4. Seed Treatment
- 1.5. Soil Treatment
-
2. Crop Type
- 2.1. Commercial Crops
- 2.2. Fruits & Vegetables
- 2.3. Grains & Cereals
- 2.4. Pulses & Oilseeds
- 2.5. Turf & Ornamental
-
3. Application Mode
- 3.1. Chemigation
- 3.2. Foliar
- 3.3. Fumigation
- 3.4. Seed Treatment
- 3.5. Soil Treatment
-
4. Crop Type
- 4.1. Commercial Crops
- 4.2. Fruits & Vegetables
- 4.3. Grains & Cereals
- 4.4. Pulses & Oilseeds
- 4.5. Turf & Ornamental
Insecticides Industry Segmentation By Geography
-
1. North America
- 1.1. United States
- 1.2. Canada
- 1.3. Mexico
-
2. South America
- 2.1. Brazil
- 2.2. Argentina
- 2.3. Rest of South America
-
3. Europe
- 3.1. United Kingdom
- 3.2. Germany
- 3.3. France
- 3.4. Italy
- 3.5. Spain
- 3.6. Russia
- 3.7. Benelux
- 3.8. Nordics
- 3.9. Rest of Europe
-
4. Middle East & Africa
- 4.1. Turkey
- 4.2. Israel
- 4.3. GCC
- 4.4. North Africa
- 4.5. South Africa
- 4.6. Rest of Middle East & Africa
-
5. Asia Pacific
- 5.1. China
- 5.2. India
- 5.3. Japan
- 5.4. South Korea
- 5.5. ASEAN
- 5.6. Oceania
- 5.7. Rest of Asia Pacific
Insecticides Industry Regional Market Share
Geographic Coverage of Insecticides Industry
Insecticides Industry REPORT HIGHLIGHTS
| Aspects | Details |
|---|---|
| Study Period | 2020-2034 |
| Base Year | 2025 |
| Estimated Year | 2026 |
| Forecast Period | 2026-2034 |
| Historical Period | 2020-2025 |
| Growth Rate | CAGR of 14.25% from 2020-2034 |
| Segmentation |
|
Table of Contents
- 1. Introduction
- 1.1. Research Scope
- 1.2. Market Segmentation
- 1.3. Research Objective
- 1.4. Definitions and Assumptions
- 2. Executive Summary
- 2.1. Market Snapshot
- 3. Market Dynamics
- 3.1. Market Drivers
- 3.2. Market Restrains
- 3.3. Market Trends
- 3.4. Market Opportunities
- 4. Market Factor Analysis
- 4.1. Porters Five Forces
- 4.1.1. Bargaining Power of Suppliers
- 4.1.2. Bargaining Power of Buyers
- 4.1.3. Threat of New Entrants
- 4.1.4. Threat of Substitutes
- 4.1.5. Competitive Rivalry
- 4.2. PESTEL analysis
- 4.3. BCG Analysis
- 4.3.1. Stars (High Growth, High Market Share)
- 4.3.2. Cash Cows (Low Growth, High Market Share)
- 4.3.3. Question Mark (High Growth, Low Market Share)
- 4.3.4. Dogs (Low Growth, Low Market Share)
- 4.4. Ansoff Matrix Analysis
- 4.5. Supply Chain Analysis
- 4.6. Regulatory Landscape
- 4.7. Current Market Potential and Opportunity Assessment (TAM–SAM–SOM Framework)
- 4.8. NRP Analyst Note
- 4.1. Porters Five Forces
- 5. Market Analysis, Insights and Forecast 2021-2033
- 5.1. Market Analysis, Insights and Forecast - by Application Mode
- 5.1.1. Chemigation
- 5.1.2. Foliar
- 5.1.3. Fumigation
- 5.1.4. Seed Treatment
- 5.1.5. Soil Treatment
- 5.2. Market Analysis, Insights and Forecast - by Crop Type
- 5.2.1. Commercial Crops
- 5.2.2. Fruits & Vegetables
- 5.2.3. Grains & Cereals
- 5.2.4. Pulses & Oilseeds
- 5.2.5. Turf & Ornamental
- 5.3. Market Analysis, Insights and Forecast - by Application Mode
- 5.3.1. Chemigation
- 5.3.2. Foliar
- 5.3.3. Fumigation
- 5.3.4. Seed Treatment
- 5.3.5. Soil Treatment
- 5.4. Market Analysis, Insights and Forecast - by Crop Type
- 5.4.1. Commercial Crops
- 5.4.2. Fruits & Vegetables
- 5.4.3. Grains & Cereals
- 5.4.4. Pulses & Oilseeds
- 5.4.5. Turf & Ornamental
- 5.5. Market Analysis, Insights and Forecast - by Region
- 5.5.1. North America
- 5.5.2. South America
- 5.5.3. Europe
- 5.5.4. Middle East & Africa
- 5.5.5. Asia Pacific
- 5.1. Market Analysis, Insights and Forecast - by Application Mode
- 6. Global Insecticides Industry Analysis, Insights and Forecast, 2021-2033
- 6.1. Market Analysis, Insights and Forecast - by Application Mode
- 6.1.1. Chemigation
- 6.1.2. Foliar
- 6.1.3. Fumigation
- 6.1.4. Seed Treatment
- 6.1.5. Soil Treatment
- 6.2. Market Analysis, Insights and Forecast - by Crop Type
- 6.2.1. Commercial Crops
- 6.2.2. Fruits & Vegetables
- 6.2.3. Grains & Cereals
- 6.2.4. Pulses & Oilseeds
- 6.2.5. Turf & Ornamental
- 6.3. Market Analysis, Insights and Forecast - by Application Mode
- 6.3.1. Chemigation
- 6.3.2. Foliar
- 6.3.3. Fumigation
- 6.3.4. Seed Treatment
- 6.3.5. Soil Treatment
- 6.4. Market Analysis, Insights and Forecast - by Crop Type
- 6.4.1. Commercial Crops
- 6.4.2. Fruits & Vegetables
- 6.4.3. Grains & Cereals
- 6.4.4. Pulses & Oilseeds
- 6.4.5. Turf & Ornamental
- 6.1. Market Analysis, Insights and Forecast - by Application Mode
- 7. North America Insecticides Industry Analysis, Insights and Forecast, 2020-2032
- 7.1. Market Analysis, Insights and Forecast - by Application Mode
- 7.1.1. Chemigation
- 7.1.2. Foliar
- 7.1.3. Fumigation
- 7.1.4. Seed Treatment
- 7.1.5. Soil Treatment
- 7.2. Market Analysis, Insights and Forecast - by Crop Type
- 7.2.1. Commercial Crops
- 7.2.2. Fruits & Vegetables
- 7.2.3. Grains & Cereals
- 7.2.4. Pulses & Oilseeds
- 7.2.5. Turf & Ornamental
- 7.3. Market Analysis, Insights and Forecast - by Application Mode
- 7.3.1. Chemigation
- 7.3.2. Foliar
- 7.3.3. Fumigation
- 7.3.4. Seed Treatment
- 7.3.5. Soil Treatment
- 7.4. Market Analysis, Insights and Forecast - by Crop Type
- 7.4.1. Commercial Crops
- 7.4.2. Fruits & Vegetables
- 7.4.3. Grains & Cereals
- 7.4.4. Pulses & Oilseeds
- 7.4.5. Turf & Ornamental
- 7.1. Market Analysis, Insights and Forecast - by Application Mode
- 8. South America Insecticides Industry Analysis, Insights and Forecast, 2020-2032
- 8.1. Market Analysis, Insights and Forecast - by Application Mode
- 8.1.1. Chemigation
- 8.1.2. Foliar
- 8.1.3. Fumigation
- 8.1.4. Seed Treatment
- 8.1.5. Soil Treatment
- 8.2. Market Analysis, Insights and Forecast - by Crop Type
- 8.2.1. Commercial Crops
- 8.2.2. Fruits & Vegetables
- 8.2.3. Grains & Cereals
- 8.2.4. Pulses & Oilseeds
- 8.2.5. Turf & Ornamental
- 8.3. Market Analysis, Insights and Forecast - by Application Mode
- 8.3.1. Chemigation
- 8.3.2. Foliar
- 8.3.3. Fumigation
- 8.3.4. Seed Treatment
- 8.3.5. Soil Treatment
- 8.4. Market Analysis, Insights and Forecast - by Crop Type
- 8.4.1. Commercial Crops
- 8.4.2. Fruits & Vegetables
- 8.4.3. Grains & Cereals
- 8.4.4. Pulses & Oilseeds
- 8.4.5. Turf & Ornamental
- 8.1. Market Analysis, Insights and Forecast - by Application Mode
- 9. Europe Insecticides Industry Analysis, Insights and Forecast, 2020-2032
- 9.1. Market Analysis, Insights and Forecast - by Application Mode
- 9.1.1. Chemigation
- 9.1.2. Foliar
- 9.1.3. Fumigation
- 9.1.4. Seed Treatment
- 9.1.5. Soil Treatment
- 9.2. Market Analysis, Insights and Forecast - by Crop Type
- 9.2.1. Commercial Crops
- 9.2.2. Fruits & Vegetables
- 9.2.3. Grains & Cereals
- 9.2.4. Pulses & Oilseeds
- 9.2.5. Turf & Ornamental
- 9.3. Market Analysis, Insights and Forecast - by Application Mode
- 9.3.1. Chemigation
- 9.3.2. Foliar
- 9.3.3. Fumigation
- 9.3.4. Seed Treatment
- 9.3.5. Soil Treatment
- 9.4. Market Analysis, Insights and Forecast - by Crop Type
- 9.4.1. Commercial Crops
- 9.4.2. Fruits & Vegetables
- 9.4.3. Grains & Cereals
- 9.4.4. Pulses & Oilseeds
- 9.4.5. Turf & Ornamental
- 9.1. Market Analysis, Insights and Forecast - by Application Mode
- 10. Middle East & Africa Insecticides Industry Analysis, Insights and Forecast, 2020-2032
- 10.1. Market Analysis, Insights and Forecast - by Application Mode
- 10.1.1. Chemigation
- 10.1.2. Foliar
- 10.1.3. Fumigation
- 10.1.4. Seed Treatment
- 10.1.5. Soil Treatment
- 10.2. Market Analysis, Insights and Forecast - by Crop Type
- 10.2.1. Commercial Crops
- 10.2.2. Fruits & Vegetables
- 10.2.3. Grains & Cereals
- 10.2.4. Pulses & Oilseeds
- 10.2.5. Turf & Ornamental
- 10.3. Market Analysis, Insights and Forecast - by Application Mode
- 10.3.1. Chemigation
- 10.3.2. Foliar
- 10.3.3. Fumigation
- 10.3.4. Seed Treatment
- 10.3.5. Soil Treatment
- 10.4. Market Analysis, Insights and Forecast - by Crop Type
- 10.4.1. Commercial Crops
- 10.4.2. Fruits & Vegetables
- 10.4.3. Grains & Cereals
- 10.4.4. Pulses & Oilseeds
- 10.4.5. Turf & Ornamental
- 10.1. Market Analysis, Insights and Forecast - by Application Mode
- 11. Asia Pacific Insecticides Industry Analysis, Insights and Forecast, 2020-2032
- 11.1. Market Analysis, Insights and Forecast - by Application Mode
- 11.1.1. Chemigation
- 11.1.2. Foliar
- 11.1.3. Fumigation
- 11.1.4. Seed Treatment
- 11.1.5. Soil Treatment
- 11.2. Market Analysis, Insights and Forecast - by Crop Type
- 11.2.1. Commercial Crops
- 11.2.2. Fruits & Vegetables
- 11.2.3. Grains & Cereals
- 11.2.4. Pulses & Oilseeds
- 11.2.5. Turf & Ornamental
- 11.3. Market Analysis, Insights and Forecast - by Application Mode
- 11.3.1. Chemigation
- 11.3.2. Foliar
- 11.3.3. Fumigation
- 11.3.4. Seed Treatment
- 11.3.5. Soil Treatment
- 11.4. Market Analysis, Insights and Forecast - by Crop Type
- 11.4.1. Commercial Crops
- 11.4.2. Fruits & Vegetables
- 11.4.3. Grains & Cereals
- 11.4.4. Pulses & Oilseeds
- 11.4.5. Turf & Ornamental
- 11.1. Market Analysis, Insights and Forecast - by Application Mode
- 12. Competitive Analysis
- 12.1. Company Profiles
- 12.1.1 FMC Corporation
- 12.1.1.1. Company Overview
- 12.1.1.2. Products
- 12.1.1.3. Company Financials
- 12.1.1.4. SWOT Analysis
- 12.1.2 Sumitomo Chemical Co Ltd
- 12.1.2.1. Company Overview
- 12.1.2.2. Products
- 12.1.2.3. Company Financials
- 12.1.2.4. SWOT Analysis
- 12.1.3 ADAMA Agricultural Solutions Ltd
- 12.1.3.1. Company Overview
- 12.1.3.2. Products
- 12.1.3.3. Company Financials
- 12.1.3.4. SWOT Analysis
- 12.1.4 Bayer AG
- 12.1.4.1. Company Overview
- 12.1.4.2. Products
- 12.1.4.3. Company Financials
- 12.1.4.4. SWOT Analysis
- 12.1.5 UPL Limite
- 12.1.5.1. Company Overview
- 12.1.5.2. Products
- 12.1.5.3. Company Financials
- 12.1.5.4. SWOT Analysis
- 12.1.6 Syngenta Group
- 12.1.6.1. Company Overview
- 12.1.6.2. Products
- 12.1.6.3. Company Financials
- 12.1.6.4. SWOT Analysis
- 12.1.7 Jiangsu Yangnong Chemical Co Ltd
- 12.1.7.1. Company Overview
- 12.1.7.2. Products
- 12.1.7.3. Company Financials
- 12.1.7.4. SWOT Analysis
- 12.1.8 Corteva Agriscience
- 12.1.8.1. Company Overview
- 12.1.8.2. Products
- 12.1.8.3. Company Financials
- 12.1.8.4. SWOT Analysis
- 12.1.9 Nufarm Ltd
- 12.1.9.1. Company Overview
- 12.1.9.2. Products
- 12.1.9.3. Company Financials
- 12.1.9.4. SWOT Analysis
- 12.1.10 BASF SE
- 12.1.10.1. Company Overview
- 12.1.10.2. Products
- 12.1.10.3. Company Financials
- 12.1.10.4. SWOT Analysis
- 12.1.1 FMC Corporation
- 12.2. Market Entropy
- 12.2.1 Company's Key Areas Served
- 12.2.2 Recent Developments
- 12.3. Company Market Share Analysis 2025
- 12.3.1 Top 5 Companies Market Share Analysis
- 12.3.2 Top 3 Companies Market Share Analysis
- 12.4. List of Potential Customers
- 13. Research Methodology
List of Figures
- Figure 1: Global Insecticides Industry Revenue Breakdown (billion, %) by Region 2025 & 2033
- Figure 2: North America Insecticides Industry Revenue (billion), by Application Mode 2025 & 2033
- Figure 3: North America Insecticides Industry Revenue Share (%), by Application Mode 2025 & 2033
- Figure 4: North America Insecticides Industry Revenue (billion), by Crop Type 2025 & 2033
- Figure 5: North America Insecticides Industry Revenue Share (%), by Crop Type 2025 & 2033
- Figure 6: North America Insecticides Industry Revenue (billion), by Application Mode 2025 & 2033
- Figure 7: North America Insecticides Industry Revenue Share (%), by Application Mode 2025 & 2033
- Figure 8: North America Insecticides Industry Revenue (billion), by Crop Type 2025 & 2033
- Figure 9: North America Insecticides Industry Revenue Share (%), by Crop Type 2025 & 2033
- Figure 10: North America Insecticides Industry Revenue (billion), by Country 2025 & 2033
- Figure 11: North America Insecticides Industry Revenue Share (%), by Country 2025 & 2033
- Figure 12: South America Insecticides Industry Revenue (billion), by Application Mode 2025 & 2033
- Figure 13: South America Insecticides Industry Revenue Share (%), by Application Mode 2025 & 2033
- Figure 14: South America Insecticides Industry Revenue (billion), by Crop Type 2025 & 2033
- Figure 15: South America Insecticides Industry Revenue Share (%), by Crop Type 2025 & 2033
- Figure 16: South America Insecticides Industry Revenue (billion), by Application Mode 2025 & 2033
- Figure 17: South America Insecticides Industry Revenue Share (%), by Application Mode 2025 & 2033
- Figure 18: South America Insecticides Industry Revenue (billion), by Crop Type 2025 & 2033
- Figure 19: South America Insecticides Industry Revenue Share (%), by Crop Type 2025 & 2033
- Figure 20: South America Insecticides Industry Revenue (billion), by Country 2025 & 2033
- Figure 21: South America Insecticides Industry Revenue Share (%), by Country 2025 & 2033
- Figure 22: Europe Insecticides Industry Revenue (billion), by Application Mode 2025 & 2033
- Figure 23: Europe Insecticides Industry Revenue Share (%), by Application Mode 2025 & 2033
- Figure 24: Europe Insecticides Industry Revenue (billion), by Crop Type 2025 & 2033
- Figure 25: Europe Insecticides Industry Revenue Share (%), by Crop Type 2025 & 2033
- Figure 26: Europe Insecticides Industry Revenue (billion), by Application Mode 2025 & 2033
- Figure 27: Europe Insecticides Industry Revenue Share (%), by Application Mode 2025 & 2033
- Figure 28: Europe Insecticides Industry Revenue (billion), by Crop Type 2025 & 2033
- Figure 29: Europe Insecticides Industry Revenue Share (%), by Crop Type 2025 & 2033
- Figure 30: Europe Insecticides Industry Revenue (billion), by Country 2025 & 2033
- Figure 31: Europe Insecticides Industry Revenue Share (%), by Country 2025 & 2033
- Figure 32: Middle East & Africa Insecticides Industry Revenue (billion), by Application Mode 2025 & 2033
- Figure 33: Middle East & Africa Insecticides Industry Revenue Share (%), by Application Mode 2025 & 2033
- Figure 34: Middle East & Africa Insecticides Industry Revenue (billion), by Crop Type 2025 & 2033
- Figure 35: Middle East & Africa Insecticides Industry Revenue Share (%), by Crop Type 2025 & 2033
- Figure 36: Middle East & Africa Insecticides Industry Revenue (billion), by Application Mode 2025 & 2033
- Figure 37: Middle East & Africa Insecticides Industry Revenue Share (%), by Application Mode 2025 & 2033
- Figure 38: Middle East & Africa Insecticides Industry Revenue (billion), by Crop Type 2025 & 2033
- Figure 39: Middle East & Africa Insecticides Industry Revenue Share (%), by Crop Type 2025 & 2033
- Figure 40: Middle East & Africa Insecticides Industry Revenue (billion), by Country 2025 & 2033
- Figure 41: Middle East & Africa Insecticides Industry Revenue Share (%), by Country 2025 & 2033
- Figure 42: Asia Pacific Insecticides Industry Revenue (billion), by Application Mode 2025 & 2033
- Figure 43: Asia Pacific Insecticides Industry Revenue Share (%), by Application Mode 2025 & 2033
- Figure 44: Asia Pacific Insecticides Industry Revenue (billion), by Crop Type 2025 & 2033
- Figure 45: Asia Pacific Insecticides Industry Revenue Share (%), by Crop Type 2025 & 2033
- Figure 46: Asia Pacific Insecticides Industry Revenue (billion), by Application Mode 2025 & 2033
- Figure 47: Asia Pacific Insecticides Industry Revenue Share (%), by Application Mode 2025 & 2033
- Figure 48: Asia Pacific Insecticides Industry Revenue (billion), by Crop Type 2025 & 2033
- Figure 49: Asia Pacific Insecticides Industry Revenue Share (%), by Crop Type 2025 & 2033
- Figure 50: Asia Pacific Insecticides Industry Revenue (billion), by Country 2025 & 2033
- Figure 51: Asia Pacific Insecticides Industry Revenue Share (%), by Country 2025 & 2033
List of Tables
- Table 1: Global Insecticides Industry Revenue billion Forecast, by Application Mode 2020 & 2033
- Table 2: Global Insecticides Industry Revenue billion Forecast, by Crop Type 2020 & 2033
- Table 3: Global Insecticides Industry Revenue billion Forecast, by Application Mode 2020 & 2033
- Table 4: Global Insecticides Industry Revenue billion Forecast, by Crop Type 2020 & 2033
- Table 5: Global Insecticides Industry Revenue billion Forecast, by Region 2020 & 2033
- Table 6: Global Insecticides Industry Revenue billion Forecast, by Application Mode 2020 & 2033
- Table 7: Global Insecticides Industry Revenue billion Forecast, by Crop Type 2020 & 2033
- Table 8: Global Insecticides Industry Revenue billion Forecast, by Application Mode 2020 & 2033
- Table 9: Global Insecticides Industry Revenue billion Forecast, by Crop Type 2020 & 2033
- Table 10: Global Insecticides Industry Revenue billion Forecast, by Country 2020 & 2033
- Table 11: United States Insecticides Industry Revenue (billion) Forecast, by Application 2020 & 2033
- Table 12: Canada Insecticides Industry Revenue (billion) Forecast, by Application 2020 & 2033
- Table 13: Mexico Insecticides Industry Revenue (billion) Forecast, by Application 2020 & 2033
- Table 14: Global Insecticides Industry Revenue billion Forecast, by Application Mode 2020 & 2033
- Table 15: Global Insecticides Industry Revenue billion Forecast, by Crop Type 2020 & 2033
- Table 16: Global Insecticides Industry Revenue billion Forecast, by Application Mode 2020 & 2033
- Table 17: Global Insecticides Industry Revenue billion Forecast, by Crop Type 2020 & 2033
- Table 18: Global Insecticides Industry Revenue billion Forecast, by Country 2020 & 2033
- Table 19: Brazil Insecticides Industry Revenue (billion) Forecast, by Application 2020 & 2033
- Table 20: Argentina Insecticides Industry Revenue (billion) Forecast, by Application 2020 & 2033
- Table 21: Rest of South America Insecticides Industry Revenue (billion) Forecast, by Application 2020 & 2033
- Table 22: Global Insecticides Industry Revenue billion Forecast, by Application Mode 2020 & 2033
- Table 23: Global Insecticides Industry Revenue billion Forecast, by Crop Type 2020 & 2033
- Table 24: Global Insecticides Industry Revenue billion Forecast, by Application Mode 2020 & 2033
- Table 25: Global Insecticides Industry Revenue billion Forecast, by Crop Type 2020 & 2033
- Table 26: Global Insecticides Industry Revenue billion Forecast, by Country 2020 & 2033
- Table 27: United Kingdom Insecticides Industry Revenue (billion) Forecast, by Application 2020 & 2033
- Table 28: Germany Insecticides Industry Revenue (billion) Forecast, by Application 2020 & 2033
- Table 29: France Insecticides Industry Revenue (billion) Forecast, by Application 2020 & 2033
- Table 30: Italy Insecticides Industry Revenue (billion) Forecast, by Application 2020 & 2033
- Table 31: Spain Insecticides Industry Revenue (billion) Forecast, by Application 2020 & 2033
- Table 32: Russia Insecticides Industry Revenue (billion) Forecast, by Application 2020 & 2033
- Table 33: Benelux Insecticides Industry Revenue (billion) Forecast, by Application 2020 & 2033
- Table 34: Nordics Insecticides Industry Revenue (billion) Forecast, by Application 2020 & 2033
- Table 35: Rest of Europe Insecticides Industry Revenue (billion) Forecast, by Application 2020 & 2033
- Table 36: Global Insecticides Industry Revenue billion Forecast, by Application Mode 2020 & 2033
- Table 37: Global Insecticides Industry Revenue billion Forecast, by Crop Type 2020 & 2033
- Table 38: Global Insecticides Industry Revenue billion Forecast, by Application Mode 2020 & 2033
- Table 39: Global Insecticides Industry Revenue billion Forecast, by Crop Type 2020 & 2033
- Table 40: Global Insecticides Industry Revenue billion Forecast, by Country 2020 & 2033
- Table 41: Turkey Insecticides Industry Revenue (billion) Forecast, by Application 2020 & 2033
- Table 42: Israel Insecticides Industry Revenue (billion) Forecast, by Application 2020 & 2033
- Table 43: GCC Insecticides Industry Revenue (billion) Forecast, by Application 2020 & 2033
- Table 44: North Africa Insecticides Industry Revenue (billion) Forecast, by Application 2020 & 2033
- Table 45: South Africa Insecticides Industry Revenue (billion) Forecast, by Application 2020 & 2033
- Table 46: Rest of Middle East & Africa Insecticides Industry Revenue (billion) Forecast, by Application 2020 & 2033
- Table 47: Global Insecticides Industry Revenue billion Forecast, by Application Mode 2020 & 2033
- Table 48: Global Insecticides Industry Revenue billion Forecast, by Crop Type 2020 & 2033
- Table 49: Global Insecticides Industry Revenue billion Forecast, by Application Mode 2020 & 2033
- Table 50: Global Insecticides Industry Revenue billion Forecast, by Crop Type 2020 & 2033
- Table 51: Global Insecticides Industry Revenue billion Forecast, by Country 2020 & 2033
- Table 52: China Insecticides Industry Revenue (billion) Forecast, by Application 2020 & 2033
- Table 53: India Insecticides Industry Revenue (billion) Forecast, by Application 2020 & 2033
- Table 54: Japan Insecticides Industry Revenue (billion) Forecast, by Application 2020 & 2033
- Table 55: South Korea Insecticides Industry Revenue (billion) Forecast, by Application 2020 & 2033
- Table 56: ASEAN Insecticides Industry Revenue (billion) Forecast, by Application 2020 & 2033
- Table 57: Oceania Insecticides Industry Revenue (billion) Forecast, by Application 2020 & 2033
- Table 58: Rest of Asia Pacific Insecticides Industry Revenue (billion) Forecast, by Application 2020 & 2033
Frequently Asked Questions
1. What is the projected Compound Annual Growth Rate (CAGR) of the Insecticides Industry?
The projected CAGR is approximately 14.25%.
2. Which companies are prominent players in the Insecticides Industry?
Key companies in the market include FMC Corporation, Sumitomo Chemical Co Ltd, ADAMA Agricultural Solutions Ltd, Bayer AG, UPL Limite, Syngenta Group, Jiangsu Yangnong Chemical Co Ltd, Corteva Agriscience, Nufarm Ltd, BASF SE.
3. What are the main segments of the Insecticides Industry?
The market segments include Application Mode, Crop Type, Application Mode, Crop Type.
4. Can you provide details about the market size?
The market size is estimated to be USD 8.36 billion as of 2022.
5. What are some drivers contributing to market growth?
Seed Treatment As A Solution To Enhance Yield; Growing Awareness For Seed Treatment Among The Farmers; Rising Trend Of Organic Farming.
6. What are the notable trends driving market growth?
The expansion of cropland areas with changes in climate conditions is contributing to the growth of the market.
7. Are there any restraints impacting market growth?
Limitations Across Farm-Level Seed Treatment; Rising Environmental Concerns.
8. Can you provide examples of recent developments in the market?
January 2023: Bayer formed a new partnership with Oerth Bio to enhance crop protection technology and create more eco-friendly crop protection solutions.September 2022: FMC launched Talstar Plus Insecticide to protect Indian farmers of groundnut, cotton, and sugarcane crops from sucking and chewing pests.September 2022: FMC India launched Corprima, an insecticide that combines the company's Rynaxypyr insect control technology to provide crop protection against fruit borers, a major problem for Indian farmers.
9. What pricing options are available for accessing the report?
Pricing options include single-user, multi-user, and enterprise licenses priced at USD 3800, USD 4500, and USD 5800 respectively.
10. Is the market size provided in terms of value or volume?
The market size is provided in terms of value, measured in billion.
11. Are there any specific market keywords associated with the report?
Yes, the market keyword associated with the report is "Insecticides Industry," which aids in identifying and referencing the specific market segment covered.
12. How do I determine which pricing option suits my needs best?
The pricing options vary based on user requirements and access needs. Individual users may opt for single-user licenses, while businesses requiring broader access may choose multi-user or enterprise licenses for cost-effective access to the report.
13. Are there any additional resources or data provided in the Insecticides Industry report?
While the report offers comprehensive insights, it's advisable to review the specific contents or supplementary materials provided to ascertain if additional resources or data are available.
14. How can I stay updated on further developments or reports in the Insecticides Industry?
To stay informed about further developments, trends, and reports in the Insecticides Industry, consider subscribing to industry newsletters, following relevant companies and organizations, or regularly checking reputable industry news sources and publications.
Methodology
Step 1 - Identification of Relevant Samples Size from Population Database


Step 2 - Approaches for Defining Global Market Size (Value, Volume* & Price*)

Note*: In applicable scenarios
Step 3 - Data Sources
Primary Research
- Web Analytics
- Survey Reports
- Research Institute
- Latest Research Reports
- Opinion Leaders
Secondary Research
- Annual Reports
- White Paper
- Latest Press Release
- Industry Association
- Paid Database
- Investor Presentations

Step 4 - Data Triangulation
Involves using different sources of information in order to increase the validity of a study
These sources are likely to be stakeholders in a program - participants, other researchers, program staff, other community members, and so on.
Then we put all data in single framework & apply various statistical tools to find out the dynamic on the market.
During the analysis stage, feedback from the stakeholder groups would be compared to determine areas of agreement as well as areas of divergence