

Key Insights
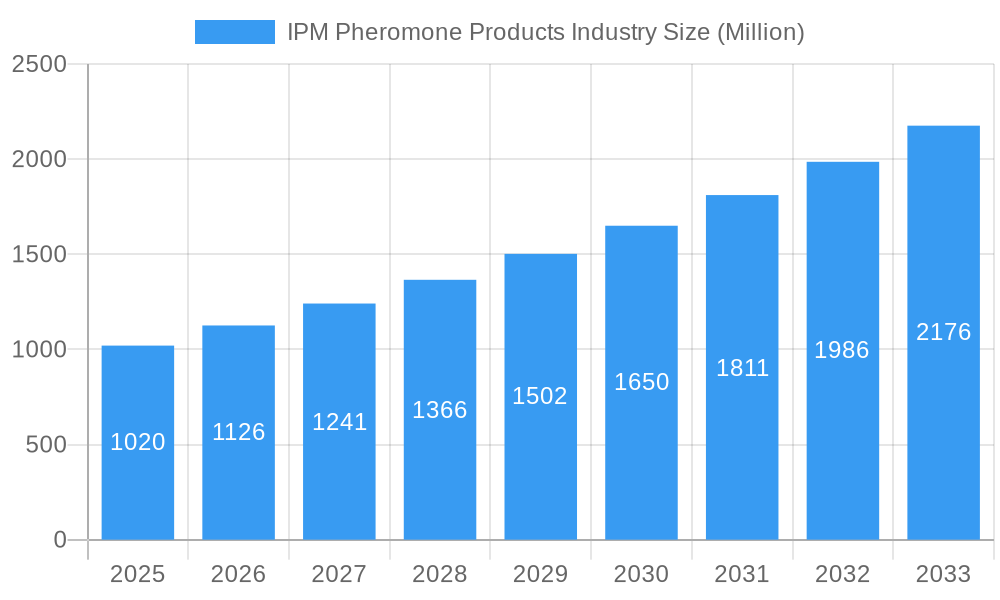
The Integrated Pest Management (IPM) pheromone products market is experiencing robust growth, projected to reach a market size exceeding $1.02 billion by 2025 and exhibiting a Compound Annual Growth Rate (CAGR) of 10.50% from 2025 to 2033. This expansion is driven by several key factors. The increasing awareness of the detrimental effects of synthetic pesticides on human health and the environment is fueling the adoption of eco-friendly IPM strategies. Furthermore, the growing demand for high-quality agricultural produce and the rising prevalence of pest infestations in various crops are significant contributors to market growth. The market is segmented by type (pheromones, aggregation pheromones, others), function (mating disruption, detection & monitoring, mass trapping), mode of application (traps, lures, dispensers), and crop type (field crops, vegetable crops, other crops). The significant adoption of mating disruption techniques, particularly in field crops, is a major growth driver. The development of more effective and sustainable pheromone-based products, coupled with increasing technological advancements in dispensing mechanisms, is further bolstering market expansion. Leading companies like Russell IPM, Syngenta Bioline, and BASF SE are actively investing in research and development to enhance product efficacy and expand their market reach. Regional growth is expected to be driven by strong demand in North America and Europe, followed by significant expansion in the Asia-Pacific region due to its substantial agricultural sector. Challenges remain, including the high initial investment cost of implementing pheromone-based IPM programs and the need for continuous research and development to overcome challenges like pheromone degradation and resistance development.
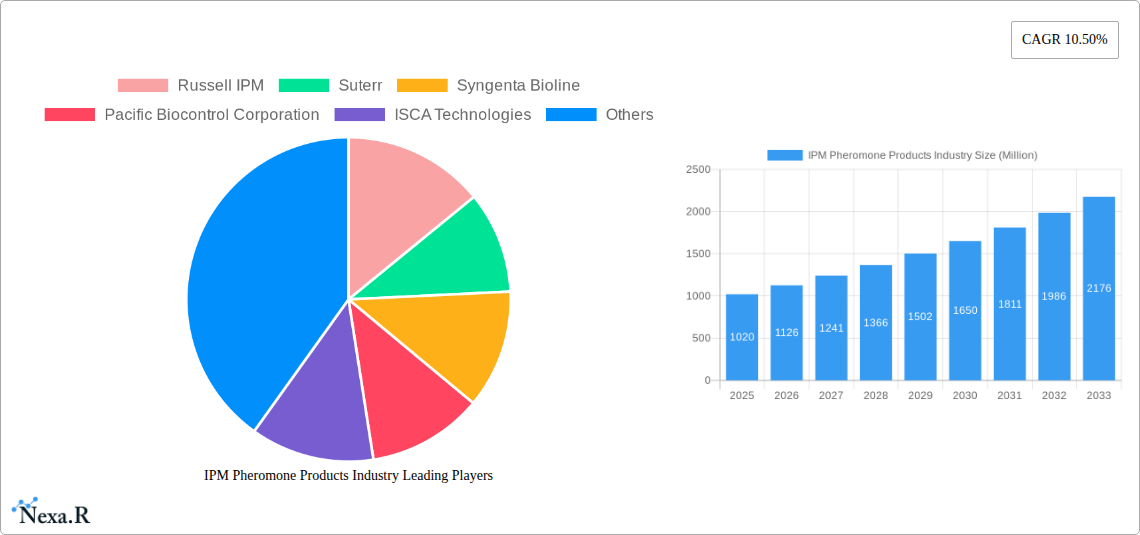
IPM Pheromone Products Industry Market Size (In Billion)
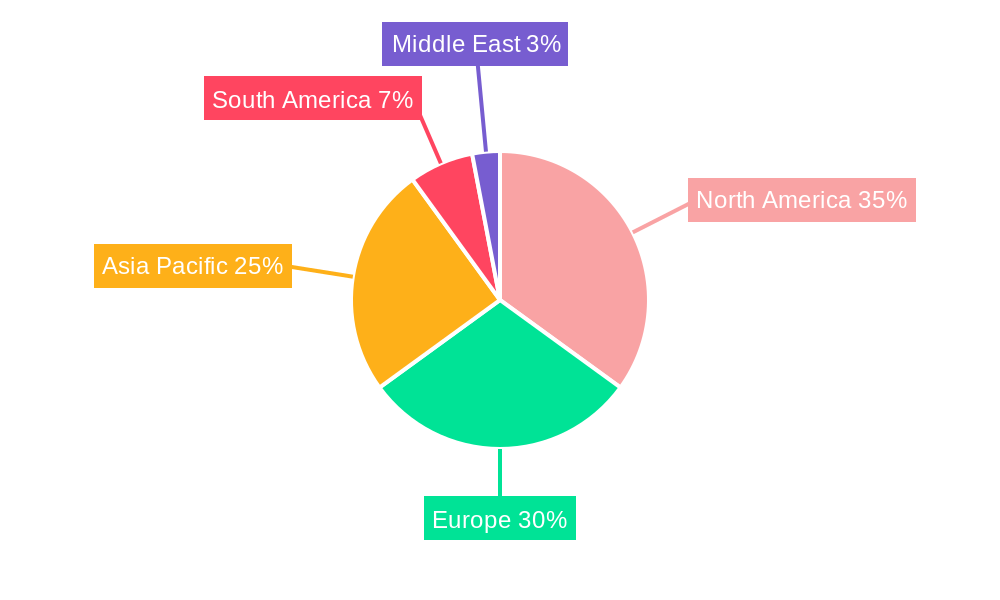
The geographical distribution of the market reflects differing adoption rates of IPM strategies across the globe. North America and Europe currently hold significant market share due to the established agricultural practices and stringent regulations favoring sustainable pest management. However, the Asia-Pacific region presents a considerable growth opportunity due to the expanding agricultural sector and increasing government support for sustainable agricultural practices. The South American and Middle Eastern markets are also anticipated to witness growth, albeit at a slower pace, driven by increasing awareness of eco-friendly pest management techniques and growing concerns about food safety and environmental protection. The continued focus on innovation in pheromone formulations and application technologies will play a crucial role in shaping the competitive landscape and fueling the growth of this market segment throughout the forecast period.
IPM Pheromone Products Industry Company Market Share
IPM Pheromone Products Industry Market Report: 2019-2033
This comprehensive report provides an in-depth analysis of the IPM (Integrated Pest Management) Pheromone Products industry, encompassing market dynamics, growth trends, regional dominance, product landscape, and key players. The study period covers 2019-2033, with 2025 as the base and estimated year, and a forecast period of 2025-2033. The report is meticulously crafted for industry professionals, investors, and researchers seeking a complete understanding of this dynamic market.
IPM Pheromone Products Industry Market Dynamics & Structure
This section provides a comprehensive analysis of the IPM Pheromone Products industry, delving into its market concentration, technological advancements, the prevailing regulatory landscape, competitive dynamics, end-user demographics, and merger & acquisition (M&A) activity. The global market size for IPM Pheromone Products in 2024 is estimated at approximately xx Million units, reflecting a growing adoption of sustainable pest management solutions.
Market Structure & Concentration: The IPM Pheromone Products market is characterized by a moderately consolidated structure, with several key players dominating a significant portion of the market share. However, the dynamic ecosystem also includes a growing number of smaller, agile, and specialized firms, which contributes to innovation and potential market disruption. It is anticipated that this market concentration will remain relatively stable in the forecast period, with a continued emphasis on strategic consolidation and niche specialization.
- Estimated Market Share (2024): Syngenta Bioline (20%), Russell IPM (15%), BASF SE (12%), Others (53%). These figures represent an informed estimation of the market's current landscape.
- M&A Activity (2019-2024): The period from 2019 to 2024 has witnessed approximately xx significant merger and acquisition deals. These transactions have been primarily driven by strategic objectives to expand comprehensive product portfolios, enhance technological capabilities, and broaden geographical market reach.
- Technological Innovation Drivers: The forefront of innovation in this industry is propelled by continuous advancements in pheromone synthesis techniques, sophisticated formulation technologies for enhanced stability and efficacy, and the development of novel and efficient delivery systems. A significant driving force is the ongoing pursuit of developing more effective, targeted, and environmentally benign pest control solutions.
- Regulatory Frameworks: The global IPM Pheromone Products market operates within a complex and evolving regulatory environment. Varying regulations across different geographical regions significantly influence product development cycles, approval processes, and market access strategies. Increasingly stringent environmental regulations worldwide are a major catalyst for the widespread adoption of sustainable Integrated Pest Management (IPM) practices, including pheromone-based solutions.
- Competitive Product Substitutes: The industry faces competition from a range of pest management strategies. These include conventional chemical pesticides, which have been the traditional choice for many growers, as well as biological control agents and other established IPM techniques. The effectiveness and cost-competitiveness of pheromone products are crucial in navigating this competitive landscape.
- End-User Demographics: The primary end-users of IPM Pheromone Products are diverse, encompassing agricultural producers across various sectors (including field crops, vegetable crops, and orchards), government agencies responsible for public health and agricultural oversight, and professional pest management companies.
IPM Pheromone Products Industry Growth Trends & Insights
This section delves into the market size evolution, adoption rates, technological disruptions, and consumer behavior shifts within the IPM Pheromone Products industry. The global market is projected to witness significant growth driven by the increasing demand for sustainable pest management solutions and stringent regulations against chemical pesticides.
- Market Size Evolution (Million Units): 2019 (xx), 2024 (xx), 2025 (xx), 2033 (xxx)
- CAGR (2025-2033): xx%
- Market Penetration: Increasing adoption in developing economies, driven by rising awareness and government support for sustainable agriculture.
- Technological Disruptions: The integration of precision agriculture technologies (e.g., sensor networks, data analytics) is enhancing the efficacy and efficiency of pheromone-based IPM.
- Consumer Behavior Shifts: Growing consumer demand for pesticide-free produce and increased awareness of environmental concerns are fueling the adoption of pheromone-based solutions.
Dominant Regions, Countries, or Segments in IPM Pheromone Products Industry
This section highlights the leading geographical regions, key countries, and significant market segments that are currently driving the growth and expansion of the IPM Pheromone Products market globally.
By Type: Pheromones, as a product category, currently command the largest market share. This is closely followed by aggregation pheromones, which are crucial for specific pest management strategies. The "Others" segment encompasses highly specialized pheromone blends meticulously tailored to individual pest species and niche applications, representing a segment with substantial untapped growth potential and opportunities for innovation.
By Function: Mating disruption techniques currently dominate the market, owing to their proven effectiveness and broad applicability across a wide range of agricultural settings. Detection and monitoring applications are experiencing steady and robust growth, largely fueled by continuous advancements in sophisticated sensing technologies and data analytics platforms.
By Mode of Application: Insect traps remain the most prevalent and widely adopted method for applying pheromone-based pest management solutions. However, innovative delivery systems such as advanced dispensers and other novel technologies are steadily gaining traction due to their enhanced convenience, improved cost-effectiveness, and precision application capabilities.
By Crops: Field crops constitute the largest market segment for IPM Pheromone Products, followed by vegetable crops. The "Other crops" category, which includes fruits, ornamentals, and various specialty crops, demonstrates significant and promising growth potential, indicating a broadening adoption across diverse agricultural sub-sectors.
- Key Regional Drivers: North America and Europe represent mature markets where the adoption of IPM solutions is well-established. In contrast, the Asia-Pacific region exhibits substantial and rapidly expanding growth potential, driven by burgeoning agricultural activities, increasing population density, and a rising consumer demand for safe and sustainably produced food products.
- Country-Specific Factors: Regional dominance is further shaped by a confluence of factors, including supportive government policies that actively promote sustainable agricultural practices, favorable climatic conditions conducive to diverse agricultural outputs, and the presence of strong agricultural infrastructure that facilitates the adoption of new technologies.
IPM Pheromone Products Industry Product Landscape
The IPM Pheromone Products market is characterized by a diverse range of products, varying in pheromone type, formulation, and delivery mechanisms. Recent innovations focus on enhancing efficacy, user-friendliness, and environmental compatibility. Manufacturers are developing specialized blends for target pest species, incorporating biodegradable materials, and employing innovative delivery systems such as microcapsules and controlled-release dispensers. This boosts the market's attractiveness to environmental-conscious consumers and farmers.
Key Drivers, Barriers & Challenges in IPM Pheromone Products Industry
Key Drivers: The escalating global awareness of environmental concerns associated with conventional pesticides, coupled with a burgeoning demand for pesticide-free and organically grown produce, are paramount drivers for the IPM Pheromone Products industry. Stringent government regulations that actively promote and incentivize sustainable agriculture further bolster this trend. Additionally, continuous technological advancements in pheromone synthesis, formulation, and application technologies are critical enablers of market growth.
Challenges: Despite the promising outlook, the industry faces several hurdles. High initial investment costs for research, development, and widespread implementation can be a barrier for some. In certain regions, a lack of comprehensive farmer education and awareness regarding the benefits and effective utilization of pheromone-based solutions poses a significant challenge. The complexities involved in accurately identifying and effectively managing specific target pests, along with the requirement for precise and timely application protocols, also present operational complexities. Furthermore, the inherent susceptibility of pheromones to environmental factors such as temperature fluctuations and UV radiation necessitates careful product design and application strategies.
Emerging Opportunities in IPM Pheromone Products Industry
Emerging opportunities include expansion into developing economies, development of novel pheromone formulations for emerging pest species, integration with precision agriculture technologies, and the exploration of new application methods such as drones or aerial spraying for efficient and targeted application. The market also shows potential in expanding into the organic food sector, which demands pesticide-free and sustainable agricultural practices.
Growth Accelerators in the IPM Pheromone Products Industry
The long-term growth trajectory of the IPM Pheromone Products industry will be significantly accelerated by several key factors. Continuous technological breakthroughs leading to the development of more effective, targeted, and cost-efficient pheromone products are paramount. Strategic partnerships and collaborations between pheromone manufacturers, agricultural input providers, and end-user stakeholders (farmers, cooperatives) will foster wider adoption and market penetration. Furthermore, strategic expansion into new and emerging geographical markets, where sustainable agriculture is gaining momentum, will unlock substantial growth opportunities. Government support through grants, subsidies, and favorable policy frameworks promoting sustainable agriculture will play a pivotal role. The increasing global consumer demand for organic food, environmentally friendly agricultural practices, and transparent food production systems will further amplify the market's growth potential.
Key Players Shaping the IPM Pheromone Products Industry Market
- Russell IPM
- Suterr
- Syngenta Bioline
- Pacific Biocontrol Corporation
- ISCA Technologies
- Shin-Etsu
- Hercon Environmental
- Sumi Agro France
- Isagro
- BASF SE
Notable Milestones in IPM Pheromone Products Industry Sector
- 2020: Launch of a new generation of biodegradable pheromone dispensers by Syngenta Bioline.
- 2022: Russell IPM acquired a smaller competitor, expanding its product portfolio and market reach.
- 2023: New regulations in the EU regarding the use of certain pesticides further boosted the demand for pheromone-based alternatives. (Specific dates may vary and need verification)
In-Depth IPM Pheromone Products Industry Market Outlook
The IPM Pheromone Products market is poised for substantial and sustained growth in the coming years. This optimistic outlook is primarily driven by heightened global environmental consciousness, increasingly stringent regulatory frameworks governing pesticide use, and remarkable advancements in scientific and technological innovation. The future landscape of this industry promises significant potential for pioneering innovation, with abundant opportunities in developing highly targeted pest control solutions tailored for specific insect species, exploring novel and more efficient application methodologies, and seamlessly integrating pheromone-based systems with the burgeoning field of precision agriculture. The strategic formation of partnerships and robust investments in research and development will act as potent catalysts for accelerated market expansion, particularly in developing economies that are increasingly embracing sustainable agricultural practices as a cornerstone of their food security and environmental stewardship efforts.
IPM Pheromone Products Industry Segmentation
- 1. Production Analysis
- 2. Consumption Analysis
- 3. Import Market Analysis (Value & Volume)
- 4. Export Market Analysis (Value & Volume)
- 5. Price Trend Analysis
IPM Pheromone Products Industry Segmentation By Geography
-
1. North America
- 1.1. United States
- 1.2. Canada
- 1.3. Mexico
-
2. South America
- 2.1. Brazil
- 2.2. Argentina
- 2.3. Rest of South America
-
3. Europe
- 3.1. United Kingdom
- 3.2. Germany
- 3.3. France
- 3.4. Italy
- 3.5. Spain
- 3.6. Russia
- 3.7. Benelux
- 3.8. Nordics
- 3.9. Rest of Europe
-
4. Middle East & Africa
- 4.1. Turkey
- 4.2. Israel
- 4.3. GCC
- 4.4. North Africa
- 4.5. South Africa
- 4.6. Rest of Middle East & Africa
-
5. Asia Pacific
- 5.1. China
- 5.2. India
- 5.3. Japan
- 5.4. South Korea
- 5.5. ASEAN
- 5.6. Oceania
- 5.7. Rest of Asia Pacific
IPM Pheromone Products Industry Regional Market Share
Geographic Coverage of IPM Pheromone Products Industry
IPM Pheromone Products Industry REPORT HIGHLIGHTS
| Aspects | Details |
|---|---|
| Study Period | 2020-2034 |
| Base Year | 2025 |
| Estimated Year | 2026 |
| Forecast Period | 2026-2034 |
| Historical Period | 2020-2025 |
| Growth Rate | CAGR of 10.50% from 2020-2034 |
| Segmentation |
|
Table of Contents
- 1. Introduction
- 1.1. Research Scope
- 1.2. Market Segmentation
- 1.3. Research Methodology
- 1.4. Definitions and Assumptions
- 2. Executive Summary
- 2.1. Introduction
- 3. Market Dynamics
- 3.1. Introduction
- 3.2. Market Drivers
- 3.2.1. Decreasing Per Capita Arable Land; Increased Demand for Food
- 3.3. Market Restrains
- 3.3.1. High Initial Investments; Requirement of Precision Agriculture
- 3.4. Market Trends
- 3.4.1. Strong Demand for High-Value Crops
- 4. Market Factor Analysis
- 4.1. Porters Five Forces
- 4.2. Supply/Value Chain
- 4.3. PESTEL analysis
- 4.4. Market Entropy
- 4.5. Patent/Trademark Analysis
- 5. Global IPM Pheromone Products Industry Analysis, Insights and Forecast, 2020-2032
- 5.1. Market Analysis, Insights and Forecast - by Production Analysis
- 5.2. Market Analysis, Insights and Forecast - by Consumption Analysis
- 5.3. Market Analysis, Insights and Forecast - by Import Market Analysis (Value & Volume)
- 5.4. Market Analysis, Insights and Forecast - by Export Market Analysis (Value & Volume)
- 5.5. Market Analysis, Insights and Forecast - by Price Trend Analysis
- 5.6. Market Analysis, Insights and Forecast - by Region
- 5.6.1. North America
- 5.6.2. South America
- 5.6.3. Europe
- 5.6.4. Middle East & Africa
- 5.6.5. Asia Pacific
- 5.1. Market Analysis, Insights and Forecast - by Production Analysis
- 6. North America IPM Pheromone Products Industry Analysis, Insights and Forecast, 2020-2032
- 6.1. Market Analysis, Insights and Forecast - by Production Analysis
- 6.2. Market Analysis, Insights and Forecast - by Consumption Analysis
- 6.3. Market Analysis, Insights and Forecast - by Import Market Analysis (Value & Volume)
- 6.4. Market Analysis, Insights and Forecast - by Export Market Analysis (Value & Volume)
- 6.5. Market Analysis, Insights and Forecast - by Price Trend Analysis
- 6.1. Market Analysis, Insights and Forecast - by Production Analysis
- 7. South America IPM Pheromone Products Industry Analysis, Insights and Forecast, 2020-2032
- 7.1. Market Analysis, Insights and Forecast - by Production Analysis
- 7.2. Market Analysis, Insights and Forecast - by Consumption Analysis
- 7.3. Market Analysis, Insights and Forecast - by Import Market Analysis (Value & Volume)
- 7.4. Market Analysis, Insights and Forecast - by Export Market Analysis (Value & Volume)
- 7.5. Market Analysis, Insights and Forecast - by Price Trend Analysis
- 7.1. Market Analysis, Insights and Forecast - by Production Analysis
- 8. Europe IPM Pheromone Products Industry Analysis, Insights and Forecast, 2020-2032
- 8.1. Market Analysis, Insights and Forecast - by Production Analysis
- 8.2. Market Analysis, Insights and Forecast - by Consumption Analysis
- 8.3. Market Analysis, Insights and Forecast - by Import Market Analysis (Value & Volume)
- 8.4. Market Analysis, Insights and Forecast - by Export Market Analysis (Value & Volume)
- 8.5. Market Analysis, Insights and Forecast - by Price Trend Analysis
- 8.1. Market Analysis, Insights and Forecast - by Production Analysis
- 9. Middle East & Africa IPM Pheromone Products Industry Analysis, Insights and Forecast, 2020-2032
- 9.1. Market Analysis, Insights and Forecast - by Production Analysis
- 9.2. Market Analysis, Insights and Forecast - by Consumption Analysis
- 9.3. Market Analysis, Insights and Forecast - by Import Market Analysis (Value & Volume)
- 9.4. Market Analysis, Insights and Forecast - by Export Market Analysis (Value & Volume)
- 9.5. Market Analysis, Insights and Forecast - by Price Trend Analysis
- 9.1. Market Analysis, Insights and Forecast - by Production Analysis
- 10. Asia Pacific IPM Pheromone Products Industry Analysis, Insights and Forecast, 2020-2032
- 10.1. Market Analysis, Insights and Forecast - by Production Analysis
- 10.2. Market Analysis, Insights and Forecast - by Consumption Analysis
- 10.3. Market Analysis, Insights and Forecast - by Import Market Analysis (Value & Volume)
- 10.4. Market Analysis, Insights and Forecast - by Export Market Analysis (Value & Volume)
- 10.5. Market Analysis, Insights and Forecast - by Price Trend Analysis
- 10.1. Market Analysis, Insights and Forecast - by Production Analysis
- 11. Competitive Analysis
- 11.1. Global Market Share Analysis 2025
- 11.2. Company Profiles
- 11.2.1 Russell IPM
- 11.2.1.1. Overview
- 11.2.1.2. Products
- 11.2.1.3. SWOT Analysis
- 11.2.1.4. Recent Developments
- 11.2.1.5. Financials (Based on Availability)
- 11.2.2 Suterr
- 11.2.2.1. Overview
- 11.2.2.2. Products
- 11.2.2.3. SWOT Analysis
- 11.2.2.4. Recent Developments
- 11.2.2.5. Financials (Based on Availability)
- 11.2.3 Syngenta Bioline
- 11.2.3.1. Overview
- 11.2.3.2. Products
- 11.2.3.3. SWOT Analysis
- 11.2.3.4. Recent Developments
- 11.2.3.5. Financials (Based on Availability)
- 11.2.4 Pacific Biocontrol Corporation
- 11.2.4.1. Overview
- 11.2.4.2. Products
- 11.2.4.3. SWOT Analysis
- 11.2.4.4. Recent Developments
- 11.2.4.5. Financials (Based on Availability)
- 11.2.5 ISCA Technologies
- 11.2.5.1. Overview
- 11.2.5.2. Products
- 11.2.5.3. SWOT Analysis
- 11.2.5.4. Recent Developments
- 11.2.5.5. Financials (Based on Availability)
- 11.2.6 Shin-Etsu
- 11.2.6.1. Overview
- 11.2.6.2. Products
- 11.2.6.3. SWOT Analysis
- 11.2.6.4. Recent Developments
- 11.2.6.5. Financials (Based on Availability)
- 11.2.7 Hercon Environmental
- 11.2.7.1. Overview
- 11.2.7.2. Products
- 11.2.7.3. SWOT Analysis
- 11.2.7.4. Recent Developments
- 11.2.7.5. Financials (Based on Availability)
- 11.2.8 Sumi Agro France
- 11.2.8.1. Overview
- 11.2.8.2. Products
- 11.2.8.3. SWOT Analysis
- 11.2.8.4. Recent Developments
- 11.2.8.5. Financials (Based on Availability)
- 11.2.9 Isagro
- 11.2.9.1. Overview
- 11.2.9.2. Products
- 11.2.9.3. SWOT Analysis
- 11.2.9.4. Recent Developments
- 11.2.9.5. Financials (Based on Availability)
- 11.2.10 BASF SE
- 11.2.10.1. Overview
- 11.2.10.2. Products
- 11.2.10.3. SWOT Analysis
- 11.2.10.4. Recent Developments
- 11.2.10.5. Financials (Based on Availability)
- 11.2.1 Russell IPM
List of Figures
- Figure 1: Global IPM Pheromone Products Industry Revenue Breakdown (Million, %) by Region 2025 & 2033
- Figure 2: North America IPM Pheromone Products Industry Revenue (Million), by Production Analysis 2025 & 2033
- Figure 3: North America IPM Pheromone Products Industry Revenue Share (%), by Production Analysis 2025 & 2033
- Figure 4: North America IPM Pheromone Products Industry Revenue (Million), by Consumption Analysis 2025 & 2033
- Figure 5: North America IPM Pheromone Products Industry Revenue Share (%), by Consumption Analysis 2025 & 2033
- Figure 6: North America IPM Pheromone Products Industry Revenue (Million), by Import Market Analysis (Value & Volume) 2025 & 2033
- Figure 7: North America IPM Pheromone Products Industry Revenue Share (%), by Import Market Analysis (Value & Volume) 2025 & 2033
- Figure 8: North America IPM Pheromone Products Industry Revenue (Million), by Export Market Analysis (Value & Volume) 2025 & 2033
- Figure 9: North America IPM Pheromone Products Industry Revenue Share (%), by Export Market Analysis (Value & Volume) 2025 & 2033
- Figure 10: North America IPM Pheromone Products Industry Revenue (Million), by Price Trend Analysis 2025 & 2033
- Figure 11: North America IPM Pheromone Products Industry Revenue Share (%), by Price Trend Analysis 2025 & 2033
- Figure 12: North America IPM Pheromone Products Industry Revenue (Million), by Country 2025 & 2033
- Figure 13: North America IPM Pheromone Products Industry Revenue Share (%), by Country 2025 & 2033
- Figure 14: South America IPM Pheromone Products Industry Revenue (Million), by Production Analysis 2025 & 2033
- Figure 15: South America IPM Pheromone Products Industry Revenue Share (%), by Production Analysis 2025 & 2033
- Figure 16: South America IPM Pheromone Products Industry Revenue (Million), by Consumption Analysis 2025 & 2033
- Figure 17: South America IPM Pheromone Products Industry Revenue Share (%), by Consumption Analysis 2025 & 2033
- Figure 18: South America IPM Pheromone Products Industry Revenue (Million), by Import Market Analysis (Value & Volume) 2025 & 2033
- Figure 19: South America IPM Pheromone Products Industry Revenue Share (%), by Import Market Analysis (Value & Volume) 2025 & 2033
- Figure 20: South America IPM Pheromone Products Industry Revenue (Million), by Export Market Analysis (Value & Volume) 2025 & 2033
- Figure 21: South America IPM Pheromone Products Industry Revenue Share (%), by Export Market Analysis (Value & Volume) 2025 & 2033
- Figure 22: South America IPM Pheromone Products Industry Revenue (Million), by Price Trend Analysis 2025 & 2033
- Figure 23: South America IPM Pheromone Products Industry Revenue Share (%), by Price Trend Analysis 2025 & 2033
- Figure 24: South America IPM Pheromone Products Industry Revenue (Million), by Country 2025 & 2033
- Figure 25: South America IPM Pheromone Products Industry Revenue Share (%), by Country 2025 & 2033
- Figure 26: Europe IPM Pheromone Products Industry Revenue (Million), by Production Analysis 2025 & 2033
- Figure 27: Europe IPM Pheromone Products Industry Revenue Share (%), by Production Analysis 2025 & 2033
- Figure 28: Europe IPM Pheromone Products Industry Revenue (Million), by Consumption Analysis 2025 & 2033
- Figure 29: Europe IPM Pheromone Products Industry Revenue Share (%), by Consumption Analysis 2025 & 2033
- Figure 30: Europe IPM Pheromone Products Industry Revenue (Million), by Import Market Analysis (Value & Volume) 2025 & 2033
- Figure 31: Europe IPM Pheromone Products Industry Revenue Share (%), by Import Market Analysis (Value & Volume) 2025 & 2033
- Figure 32: Europe IPM Pheromone Products Industry Revenue (Million), by Export Market Analysis (Value & Volume) 2025 & 2033
- Figure 33: Europe IPM Pheromone Products Industry Revenue Share (%), by Export Market Analysis (Value & Volume) 2025 & 2033
- Figure 34: Europe IPM Pheromone Products Industry Revenue (Million), by Price Trend Analysis 2025 & 2033
- Figure 35: Europe IPM Pheromone Products Industry Revenue Share (%), by Price Trend Analysis 2025 & 2033
- Figure 36: Europe IPM Pheromone Products Industry Revenue (Million), by Country 2025 & 2033
- Figure 37: Europe IPM Pheromone Products Industry Revenue Share (%), by Country 2025 & 2033
- Figure 38: Middle East & Africa IPM Pheromone Products Industry Revenue (Million), by Production Analysis 2025 & 2033
- Figure 39: Middle East & Africa IPM Pheromone Products Industry Revenue Share (%), by Production Analysis 2025 & 2033
- Figure 40: Middle East & Africa IPM Pheromone Products Industry Revenue (Million), by Consumption Analysis 2025 & 2033
- Figure 41: Middle East & Africa IPM Pheromone Products Industry Revenue Share (%), by Consumption Analysis 2025 & 2033
- Figure 42: Middle East & Africa IPM Pheromone Products Industry Revenue (Million), by Import Market Analysis (Value & Volume) 2025 & 2033
- Figure 43: Middle East & Africa IPM Pheromone Products Industry Revenue Share (%), by Import Market Analysis (Value & Volume) 2025 & 2033
- Figure 44: Middle East & Africa IPM Pheromone Products Industry Revenue (Million), by Export Market Analysis (Value & Volume) 2025 & 2033
- Figure 45: Middle East & Africa IPM Pheromone Products Industry Revenue Share (%), by Export Market Analysis (Value & Volume) 2025 & 2033
- Figure 46: Middle East & Africa IPM Pheromone Products Industry Revenue (Million), by Price Trend Analysis 2025 & 2033
- Figure 47: Middle East & Africa IPM Pheromone Products Industry Revenue Share (%), by Price Trend Analysis 2025 & 2033
- Figure 48: Middle East & Africa IPM Pheromone Products Industry Revenue (Million), by Country 2025 & 2033
- Figure 49: Middle East & Africa IPM Pheromone Products Industry Revenue Share (%), by Country 2025 & 2033
- Figure 50: Asia Pacific IPM Pheromone Products Industry Revenue (Million), by Production Analysis 2025 & 2033
- Figure 51: Asia Pacific IPM Pheromone Products Industry Revenue Share (%), by Production Analysis 2025 & 2033
- Figure 52: Asia Pacific IPM Pheromone Products Industry Revenue (Million), by Consumption Analysis 2025 & 2033
- Figure 53: Asia Pacific IPM Pheromone Products Industry Revenue Share (%), by Consumption Analysis 2025 & 2033
- Figure 54: Asia Pacific IPM Pheromone Products Industry Revenue (Million), by Import Market Analysis (Value & Volume) 2025 & 2033
- Figure 55: Asia Pacific IPM Pheromone Products Industry Revenue Share (%), by Import Market Analysis (Value & Volume) 2025 & 2033
- Figure 56: Asia Pacific IPM Pheromone Products Industry Revenue (Million), by Export Market Analysis (Value & Volume) 2025 & 2033
- Figure 57: Asia Pacific IPM Pheromone Products Industry Revenue Share (%), by Export Market Analysis (Value & Volume) 2025 & 2033
- Figure 58: Asia Pacific IPM Pheromone Products Industry Revenue (Million), by Price Trend Analysis 2025 & 2033
- Figure 59: Asia Pacific IPM Pheromone Products Industry Revenue Share (%), by Price Trend Analysis 2025 & 2033
- Figure 60: Asia Pacific IPM Pheromone Products Industry Revenue (Million), by Country 2025 & 2033
- Figure 61: Asia Pacific IPM Pheromone Products Industry Revenue Share (%), by Country 2025 & 2033
List of Tables
- Table 1: Global IPM Pheromone Products Industry Revenue Million Forecast, by Production Analysis 2020 & 2033
- Table 2: Global IPM Pheromone Products Industry Revenue Million Forecast, by Consumption Analysis 2020 & 2033
- Table 3: Global IPM Pheromone Products Industry Revenue Million Forecast, by Import Market Analysis (Value & Volume) 2020 & 2033
- Table 4: Global IPM Pheromone Products Industry Revenue Million Forecast, by Export Market Analysis (Value & Volume) 2020 & 2033
- Table 5: Global IPM Pheromone Products Industry Revenue Million Forecast, by Price Trend Analysis 2020 & 2033
- Table 6: Global IPM Pheromone Products Industry Revenue Million Forecast, by Region 2020 & 2033
- Table 7: Global IPM Pheromone Products Industry Revenue Million Forecast, by Production Analysis 2020 & 2033
- Table 8: Global IPM Pheromone Products Industry Revenue Million Forecast, by Consumption Analysis 2020 & 2033
- Table 9: Global IPM Pheromone Products Industry Revenue Million Forecast, by Import Market Analysis (Value & Volume) 2020 & 2033
- Table 10: Global IPM Pheromone Products Industry Revenue Million Forecast, by Export Market Analysis (Value & Volume) 2020 & 2033
- Table 11: Global IPM Pheromone Products Industry Revenue Million Forecast, by Price Trend Analysis 2020 & 2033
- Table 12: Global IPM Pheromone Products Industry Revenue Million Forecast, by Country 2020 & 2033
- Table 13: United States IPM Pheromone Products Industry Revenue (Million) Forecast, by Application 2020 & 2033
- Table 14: Canada IPM Pheromone Products Industry Revenue (Million) Forecast, by Application 2020 & 2033
- Table 15: Mexico IPM Pheromone Products Industry Revenue (Million) Forecast, by Application 2020 & 2033
- Table 16: Global IPM Pheromone Products Industry Revenue Million Forecast, by Production Analysis 2020 & 2033
- Table 17: Global IPM Pheromone Products Industry Revenue Million Forecast, by Consumption Analysis 2020 & 2033
- Table 18: Global IPM Pheromone Products Industry Revenue Million Forecast, by Import Market Analysis (Value & Volume) 2020 & 2033
- Table 19: Global IPM Pheromone Products Industry Revenue Million Forecast, by Export Market Analysis (Value & Volume) 2020 & 2033
- Table 20: Global IPM Pheromone Products Industry Revenue Million Forecast, by Price Trend Analysis 2020 & 2033
- Table 21: Global IPM Pheromone Products Industry Revenue Million Forecast, by Country 2020 & 2033
- Table 22: Brazil IPM Pheromone Products Industry Revenue (Million) Forecast, by Application 2020 & 2033
- Table 23: Argentina IPM Pheromone Products Industry Revenue (Million) Forecast, by Application 2020 & 2033
- Table 24: Rest of South America IPM Pheromone Products Industry Revenue (Million) Forecast, by Application 2020 & 2033
- Table 25: Global IPM Pheromone Products Industry Revenue Million Forecast, by Production Analysis 2020 & 2033
- Table 26: Global IPM Pheromone Products Industry Revenue Million Forecast, by Consumption Analysis 2020 & 2033
- Table 27: Global IPM Pheromone Products Industry Revenue Million Forecast, by Import Market Analysis (Value & Volume) 2020 & 2033
- Table 28: Global IPM Pheromone Products Industry Revenue Million Forecast, by Export Market Analysis (Value & Volume) 2020 & 2033
- Table 29: Global IPM Pheromone Products Industry Revenue Million Forecast, by Price Trend Analysis 2020 & 2033
- Table 30: Global IPM Pheromone Products Industry Revenue Million Forecast, by Country 2020 & 2033
- Table 31: United Kingdom IPM Pheromone Products Industry Revenue (Million) Forecast, by Application 2020 & 2033
- Table 32: Germany IPM Pheromone Products Industry Revenue (Million) Forecast, by Application 2020 & 2033
- Table 33: France IPM Pheromone Products Industry Revenue (Million) Forecast, by Application 2020 & 2033
- Table 34: Italy IPM Pheromone Products Industry Revenue (Million) Forecast, by Application 2020 & 2033
- Table 35: Spain IPM Pheromone Products Industry Revenue (Million) Forecast, by Application 2020 & 2033
- Table 36: Russia IPM Pheromone Products Industry Revenue (Million) Forecast, by Application 2020 & 2033
- Table 37: Benelux IPM Pheromone Products Industry Revenue (Million) Forecast, by Application 2020 & 2033
- Table 38: Nordics IPM Pheromone Products Industry Revenue (Million) Forecast, by Application 2020 & 2033
- Table 39: Rest of Europe IPM Pheromone Products Industry Revenue (Million) Forecast, by Application 2020 & 2033
- Table 40: Global IPM Pheromone Products Industry Revenue Million Forecast, by Production Analysis 2020 & 2033
- Table 41: Global IPM Pheromone Products Industry Revenue Million Forecast, by Consumption Analysis 2020 & 2033
- Table 42: Global IPM Pheromone Products Industry Revenue Million Forecast, by Import Market Analysis (Value & Volume) 2020 & 2033
- Table 43: Global IPM Pheromone Products Industry Revenue Million Forecast, by Export Market Analysis (Value & Volume) 2020 & 2033
- Table 44: Global IPM Pheromone Products Industry Revenue Million Forecast, by Price Trend Analysis 2020 & 2033
- Table 45: Global IPM Pheromone Products Industry Revenue Million Forecast, by Country 2020 & 2033
- Table 46: Turkey IPM Pheromone Products Industry Revenue (Million) Forecast, by Application 2020 & 2033
- Table 47: Israel IPM Pheromone Products Industry Revenue (Million) Forecast, by Application 2020 & 2033
- Table 48: GCC IPM Pheromone Products Industry Revenue (Million) Forecast, by Application 2020 & 2033
- Table 49: North Africa IPM Pheromone Products Industry Revenue (Million) Forecast, by Application 2020 & 2033
- Table 50: South Africa IPM Pheromone Products Industry Revenue (Million) Forecast, by Application 2020 & 2033
- Table 51: Rest of Middle East & Africa IPM Pheromone Products Industry Revenue (Million) Forecast, by Application 2020 & 2033
- Table 52: Global IPM Pheromone Products Industry Revenue Million Forecast, by Production Analysis 2020 & 2033
- Table 53: Global IPM Pheromone Products Industry Revenue Million Forecast, by Consumption Analysis 2020 & 2033
- Table 54: Global IPM Pheromone Products Industry Revenue Million Forecast, by Import Market Analysis (Value & Volume) 2020 & 2033
- Table 55: Global IPM Pheromone Products Industry Revenue Million Forecast, by Export Market Analysis (Value & Volume) 2020 & 2033
- Table 56: Global IPM Pheromone Products Industry Revenue Million Forecast, by Price Trend Analysis 2020 & 2033
- Table 57: Global IPM Pheromone Products Industry Revenue Million Forecast, by Country 2020 & 2033
- Table 58: China IPM Pheromone Products Industry Revenue (Million) Forecast, by Application 2020 & 2033
- Table 59: India IPM Pheromone Products Industry Revenue (Million) Forecast, by Application 2020 & 2033
- Table 60: Japan IPM Pheromone Products Industry Revenue (Million) Forecast, by Application 2020 & 2033
- Table 61: South Korea IPM Pheromone Products Industry Revenue (Million) Forecast, by Application 2020 & 2033
- Table 62: ASEAN IPM Pheromone Products Industry Revenue (Million) Forecast, by Application 2020 & 2033
- Table 63: Oceania IPM Pheromone Products Industry Revenue (Million) Forecast, by Application 2020 & 2033
- Table 64: Rest of Asia Pacific IPM Pheromone Products Industry Revenue (Million) Forecast, by Application 2020 & 2033
Frequently Asked Questions
1. What is the projected Compound Annual Growth Rate (CAGR) of the IPM Pheromone Products Industry?
The projected CAGR is approximately 10.50%.
2. Which companies are prominent players in the IPM Pheromone Products Industry?
Key companies in the market include Russell IPM, Suterr, Syngenta Bioline, Pacific Biocontrol Corporation, ISCA Technologies, Shin-Etsu, Hercon Environmental, Sumi Agro France, Isagro, BASF SE.
3. What are the main segments of the IPM Pheromone Products Industry?
The market segments include Production Analysis, Consumption Analysis, Import Market Analysis (Value & Volume), Export Market Analysis (Value & Volume), Price Trend Analysis.
4. Can you provide details about the market size?
The market size is estimated to be USD 1.02 Million as of 2022.
5. What are some drivers contributing to market growth?
Decreasing Per Capita Arable Land; Increased Demand for Food.
6. What are the notable trends driving market growth?
Strong Demand for High-Value Crops.
7. Are there any restraints impacting market growth?
High Initial Investments; Requirement of Precision Agriculture.
8. Can you provide examples of recent developments in the market?
N/A
9. What pricing options are available for accessing the report?
Pricing options include single-user, multi-user, and enterprise licenses priced at USD 3800, USD 4500, and USD 5800 respectively.
10. Is the market size provided in terms of value or volume?
The market size is provided in terms of value, measured in Million.
11. Are there any specific market keywords associated with the report?
Yes, the market keyword associated with the report is "IPM Pheromone Products Industry," which aids in identifying and referencing the specific market segment covered.
12. How do I determine which pricing option suits my needs best?
The pricing options vary based on user requirements and access needs. Individual users may opt for single-user licenses, while businesses requiring broader access may choose multi-user or enterprise licenses for cost-effective access to the report.
13. Are there any additional resources or data provided in the IPM Pheromone Products Industry report?
While the report offers comprehensive insights, it's advisable to review the specific contents or supplementary materials provided to ascertain if additional resources or data are available.
14. How can I stay updated on further developments or reports in the IPM Pheromone Products Industry?
To stay informed about further developments, trends, and reports in the IPM Pheromone Products Industry, consider subscribing to industry newsletters, following relevant companies and organizations, or regularly checking reputable industry news sources and publications.
Methodology
Step 1 - Identification of Relevant Samples Size from Population Database


Step 2 - Approaches for Defining Global Market Size (Value, Volume* & Price*)

Note*: In applicable scenarios
Step 3 - Data Sources
Primary Research
- Web Analytics
- Survey Reports
- Research Institute
- Latest Research Reports
- Opinion Leaders
Secondary Research
- Annual Reports
- White Paper
- Latest Press Release
- Industry Association
- Paid Database
- Investor Presentations

Step 4 - Data Triangulation
Involves using different sources of information in order to increase the validity of a study
These sources are likely to be stakeholders in a program - participants, other researchers, program staff, other community members, and so on.
Then we put all data in single framework & apply various statistical tools to find out the dynamic on the market.
During the analysis stage, feedback from the stakeholder groups would be compared to determine areas of agreement as well as areas of divergence