

Key Insights
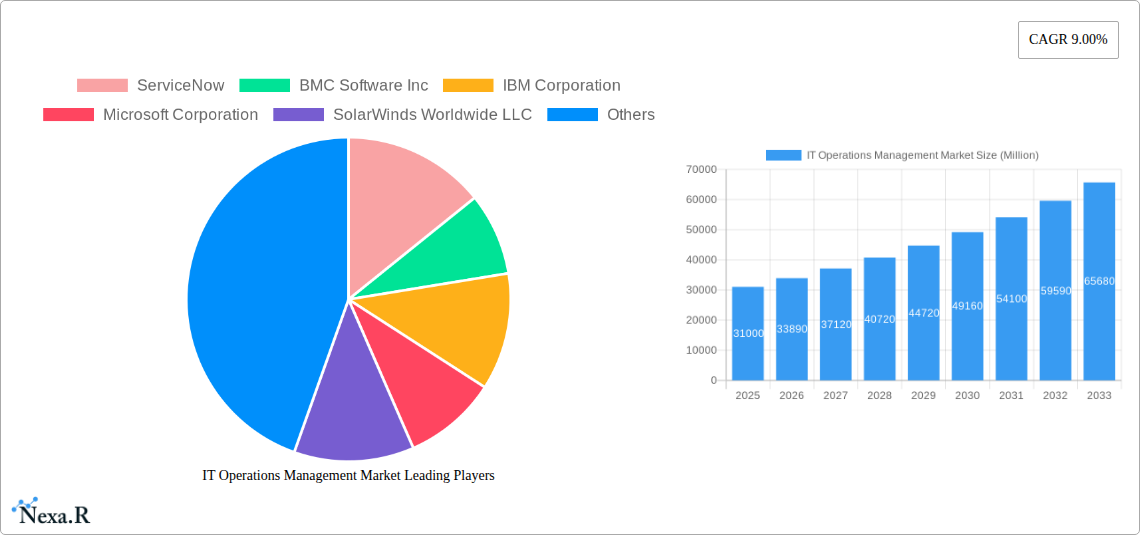
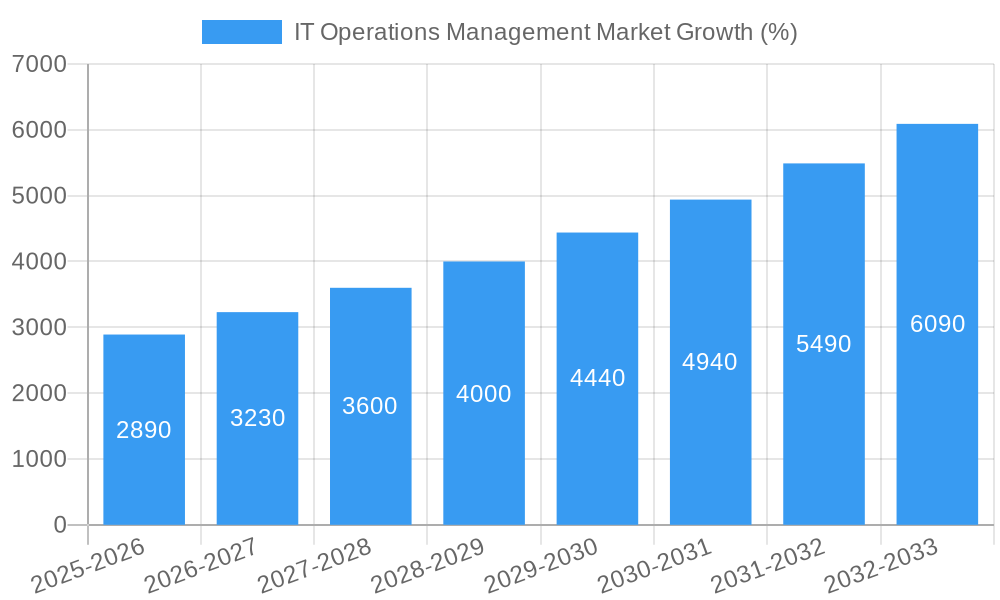
The IT Operations Management (ITOM) market is experiencing robust growth, projected to reach \$31 billion in 2025 and maintain a Compound Annual Growth Rate (CAGR) of 9% through 2033. This expansion is fueled by several key drivers. The increasing complexity of IT infrastructures, driven by cloud adoption, digital transformation initiatives, and the proliferation of IoT devices, necessitates sophisticated ITOM solutions for efficient monitoring, management, and optimization. Furthermore, the rising demand for improved operational efficiency, reduced downtime, and enhanced cybersecurity posture are compelling organizations to invest heavily in advanced ITOM capabilities. The market is witnessing a shift towards AI-powered solutions that leverage machine learning for predictive analytics and automation, enabling proactive issue resolution and enhanced performance. Key players like ServiceNow, BMC Software, IBM, and Microsoft are leading the charge, constantly innovating to cater to the evolving needs of enterprises across diverse industry verticals. Competition is fierce, leading to a continuous improvement in product features, functionalities, and pricing strategies.
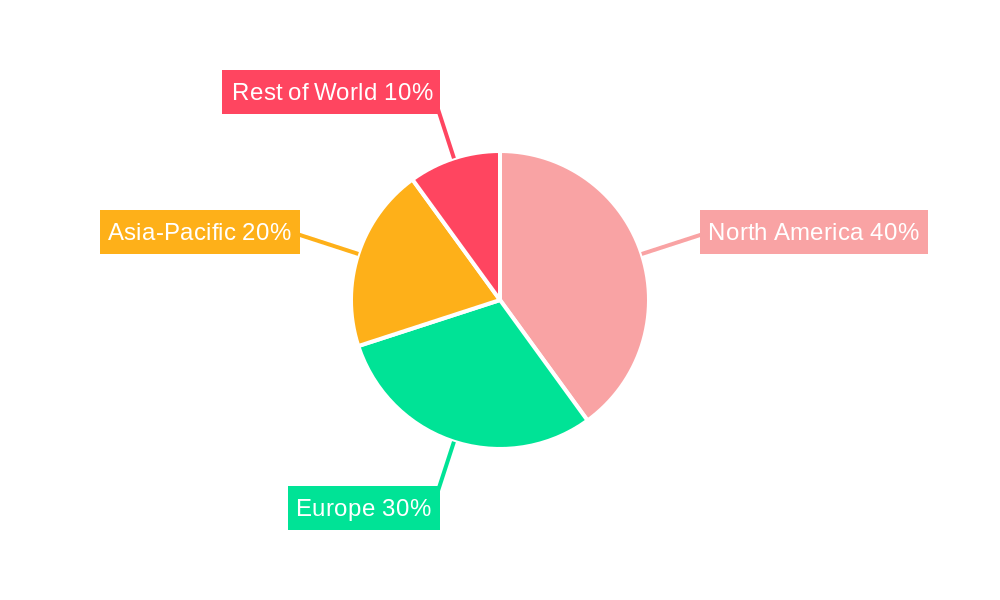
The segmentation of the ITOM market reveals diverse approaches to managing IT operations. While specific segment details are unavailable, it's reasonable to assume a breakdown based on deployment model (cloud, on-premise, hybrid), solution type (monitoring, automation, service desk), and industry vertical (finance, healthcare, manufacturing). Growth in the cloud segment is anticipated to significantly outpace on-premise solutions, driven by the scalability and cost-effectiveness of cloud-based ITOM platforms. Similarly, AI-powered automation solutions are expected to capture a larger market share due to their ability to streamline processes and improve efficiency. Geopolitically, North America and Europe currently hold substantial market shares but other regions like Asia-Pacific are showing strong growth potential due to increasing digitalization initiatives. Constraints to market growth include the high initial investment costs associated with implementing ITOM solutions, the need for skilled personnel, and integration complexities with existing IT systems. However, the long-term benefits of enhanced efficiency and reduced downtime significantly outweigh these challenges, making it an attractive investment for organizations of all sizes.
IT Operations Management Market: A Comprehensive Report (2019-2033)
This in-depth report provides a comprehensive analysis of the IT Operations Management (ITOM) market, encompassing market dynamics, growth trends, regional dominance, product landscape, key players, and future outlook. The report covers the parent market of IT management software and the child market of ITOM, offering a granular view of this rapidly evolving sector. The study period spans from 2019 to 2033, with 2025 serving as the base and estimated year. The forecast period extends from 2025 to 2033, encompassing historical data from 2019 to 2024. The market size is presented in Million units.
IT Operations Management Market Market Dynamics & Structure
The IT Operations Management market is characterized by a moderately concentrated landscape with several major players vying for market share. Technological innovation, particularly in areas like AI, automation, and cloud computing, is a significant driver of market growth. Regulatory frameworks, including data privacy regulations (e.g., GDPR, CCPA), influence vendor strategies and customer adoption. Competitive product substitutes, such as open-source solutions, exert pressure on pricing and features. The end-user demographics are diverse, spanning across various industries and organization sizes, with large enterprises representing a significant portion of the market. Mergers and acquisitions (M&A) activity is frequent, with larger players consolidating their market position through strategic acquisitions.
- Market Concentration: Moderately concentrated, with the top 5 players holding approximately xx% of the market share in 2025.
- Technological Innovation: AI-powered monitoring, automation, and cloud-native solutions are key drivers.
- Regulatory Landscape: Compliance with data privacy regulations impacts vendor strategies and adoption.
- Competitive Substitutes: Open-source alternatives present a competitive threat.
- End-User Demographics: Large enterprises, SMEs, and government organizations constitute the major end-user segments.
- M&A Activity: High level of M&A activity, with xx major deals recorded between 2019 and 2024.
IT Operations Management Market Growth Trends & Insights
The IT Operations Management market has witnessed significant growth over the past few years, driven by the increasing adoption of cloud computing, digital transformation initiatives, and the growing need for efficient IT infrastructure management. The market size is projected to reach xx Million units by 2025, growing at a CAGR of xx% during the forecast period (2025-2033). This growth is fueled by factors such as the increasing complexity of IT environments, the rising demand for improved IT service delivery, and the growing adoption of AIOps. Technological disruptions, such as the shift towards serverless computing and edge computing, are reshaping the ITOM landscape, driving demand for new solutions and services. Consumer behavior shifts, towards cloud-based solutions and subscription models, are further propelling market growth.
- Market Size (2025): xx Million units
- CAGR (2025-2033): xx%
- Market Penetration: xx% in key regions by 2033
- Key Technological Disruptions: Cloud-native ITOM, AIOps, and serverless computing.
Dominant Regions, Countries, or Segments in IT Operations Management Market
North America currently holds the largest market share in the IT Operations Management market, driven by factors such as high technology adoption rates, strong economic growth, and the presence of major technology players. Europe and Asia Pacific are also experiencing significant growth, fueled by increasing digitalization efforts and government initiatives promoting technology adoption. The key drivers for growth across different regions vary but include advancements in cloud infrastructure, expansion of 5G networks, and investments in digital transformation initiatives.
- North America: High adoption rates, strong presence of major players.
- Europe: Growing digitalization efforts, focus on data privacy regulations.
- Asia Pacific: Rapid economic growth, increasing government investments in technology.
- Market Share (2025): North America (xx%), Europe (xx%), Asia Pacific (xx%).
IT Operations Management Market Product Landscape
The IT Operations Management market offers a wide range of products, including monitoring tools, automation platforms, and service management solutions. These products are designed to improve IT efficiency, reduce operational costs, and enhance service delivery. Key advancements include AI-powered analytics, predictive capabilities, and improved integration with other IT tools. Vendors are increasingly focusing on offering cloud-based and SaaS solutions, providing greater scalability and accessibility. Unique selling propositions include enhanced automation, improved visibility into IT operations, and simplified management of complex IT environments.
Key Drivers, Barriers & Challenges in IT Operations Management Market
Key Drivers:
- Increasing adoption of cloud computing and hybrid cloud models.
- The growing need for improved IT service delivery and enhanced customer experience.
- The rise of DevOps and the demand for greater agility and automation.
- Investments in digital transformation initiatives.
Key Challenges:
- Complexity of IT environments and the increasing number of tools and technologies.
- Skill shortages in the IT industry, particularly in areas like AIOps.
- High cost of implementation and maintenance of ITOM solutions.
- Integrating legacy systems with modern ITOM tools.
- Security concerns related to data breaches and cyberattacks. The average cost of a data breach is estimated to be xx Million units, impacting ITOM budgets and strategies.
Emerging Opportunities in IT Operations Management Market
- Growth of AIOps: AI-powered solutions offer greater insights and automation capabilities.
- Expansion of ITOM into Edge Computing: Managing and monitoring devices and applications at the edge of the network.
- Increased focus on IT security: Integrating security features into ITOM tools to prevent breaches.
- Adoption of serverless computing: Managing and monitoring serverless applications.
Growth Accelerators in the IT Operations Management Market Industry
The long-term growth of the IT Operations Management market is driven by continuous technological breakthroughs in AI, machine learning, and automation. Strategic partnerships between ITOM vendors and cloud providers are accelerating market adoption. Expanding into untapped markets, particularly in developing economies, presents significant opportunities for growth. New applications of ITOM, such as in IoT management and cybersecurity, are also driving market expansion.
Key Players Shaping the IT Operations Management Market Market
- ServiceNow
- BMC Software Inc
- IBM Corporation
- Microsoft Corporation
- SolarWinds Worldwide LLC
- Splunk Inc (Cisco Systems Inc)
- Broadcom
- Open Text Corporation
- Zoho Corporation Pvt Ltd
- Dynatrace LLC
- New Relic Inc
- Datadog
- Hewlett Packard Enterprise Development LP
- Dell Inc
- PagerDuty Inc
- ScienceLogi
Notable Milestones in IT Operations Management Market Sector
- August 2024: Hewlett Packard Enterprise (HPE) announced the acquisition of Morpheus Data, significantly enhancing its HPE GreenLake hybrid cloud management capabilities.
- July 2024: Operative IQ launched a new facilities management module, integrating building data into its platform for streamlined operational decisions.
In-Depth IT Operations Management Market Market Outlook
The IT Operations Management market is poised for continued strong growth in the coming years, driven by the factors discussed above. The increasing complexity of IT environments, the growing adoption of cloud computing, and the need for improved IT service delivery will continue to drive demand for ITOM solutions. Strategic partnerships, technological innovation, and expansion into new markets will further accelerate market growth. The focus on AIOps and automation will reshape the ITOM landscape, creating significant opportunities for vendors to provide innovative solutions. The market is expected to reach xx Million units by 2033, presenting significant opportunities for both established players and new entrants.
IT Operations Management Market Segmentation
-
1. Solution Type
- 1.1. Network and Infrastructure Management
- 1.2. Application Performance Management
- 1.3. Configuration Management
- 1.4. Cloud and Hybrid IT Management
- 1.5. IT Operations Analytics
- 1.6. Automation and Orchestration
-
2. Deployment
- 2.1. On Premise
- 2.2. Cloud Based
- 2.3. Hybrid
-
3. End User Vertical
- 3.1. BFSI
- 3.2. IT and Telecom
- 3.3. Healthcare
- 3.4. Retail
- 3.5. Manufacturing
- 3.6. Government and Public Sector
- 3.7. Energy and Utilities
IT Operations Management Market Segmentation By Geography
- 1. North America
- 2. Europe
- 3. Asia
- 4. Australia and New Zealand
- 5. Latin America
- 6. Middle East and Africa
IT Operations Management Market REPORT HIGHLIGHTS
| Aspects | Details |
|---|---|
| Study Period | 2019-2033 |
| Base Year | 2024 |
| Estimated Year | 2025 |
| Forecast Period | 2025-2033 |
| Historical Period | 2019-2024 |
| Growth Rate | CAGR of 9.00% from 2019-2033 |
| Segmentation |
|
Table of Contents
- 1. Introduction
- 1.1. Research Scope
- 1.2. Market Segmentation
- 1.3. Research Methodology
- 1.4. Definitions and Assumptions
- 2. Executive Summary
- 2.1. Introduction
- 3. Market Dynamics
- 3.1. Introduction
- 3.2. Market Drivers
- 3.2.1. Increasing IT Complexity; Adoption of AI and Automation
- 3.3. Market Restrains
- 3.3.1. Increasing IT Complexity; Adoption of AI and Automation
- 3.4. Market Trends
- 3.4.1. IT and Telecom Sector Witnessing Demand
- 4. Market Factor Analysis
- 4.1. Porters Five Forces
- 4.2. Supply/Value Chain
- 4.3. PESTEL analysis
- 4.4. Market Entropy
- 4.5. Patent/Trademark Analysis
- 5. Global IT Operations Management Market Analysis, Insights and Forecast, 2019-2031
- 5.1. Market Analysis, Insights and Forecast - by Solution Type
- 5.1.1. Network and Infrastructure Management
- 5.1.2. Application Performance Management
- 5.1.3. Configuration Management
- 5.1.4. Cloud and Hybrid IT Management
- 5.1.5. IT Operations Analytics
- 5.1.6. Automation and Orchestration
- 5.2. Market Analysis, Insights and Forecast - by Deployment
- 5.2.1. On Premise
- 5.2.2. Cloud Based
- 5.2.3. Hybrid
- 5.3. Market Analysis, Insights and Forecast - by End User Vertical
- 5.3.1. BFSI
- 5.3.2. IT and Telecom
- 5.3.3. Healthcare
- 5.3.4. Retail
- 5.3.5. Manufacturing
- 5.3.6. Government and Public Sector
- 5.3.7. Energy and Utilities
- 5.4. Market Analysis, Insights and Forecast - by Region
- 5.4.1. North America
- 5.4.2. Europe
- 5.4.3. Asia
- 5.4.4. Australia and New Zealand
- 5.4.5. Latin America
- 5.4.6. Middle East and Africa
- 5.1. Market Analysis, Insights and Forecast - by Solution Type
- 6. North America IT Operations Management Market Analysis, Insights and Forecast, 2019-2031
- 6.1. Market Analysis, Insights and Forecast - by Solution Type
- 6.1.1. Network and Infrastructure Management
- 6.1.2. Application Performance Management
- 6.1.3. Configuration Management
- 6.1.4. Cloud and Hybrid IT Management
- 6.1.5. IT Operations Analytics
- 6.1.6. Automation and Orchestration
- 6.2. Market Analysis, Insights and Forecast - by Deployment
- 6.2.1. On Premise
- 6.2.2. Cloud Based
- 6.2.3. Hybrid
- 6.3. Market Analysis, Insights and Forecast - by End User Vertical
- 6.3.1. BFSI
- 6.3.2. IT and Telecom
- 6.3.3. Healthcare
- 6.3.4. Retail
- 6.3.5. Manufacturing
- 6.3.6. Government and Public Sector
- 6.3.7. Energy and Utilities
- 6.1. Market Analysis, Insights and Forecast - by Solution Type
- 7. Europe IT Operations Management Market Analysis, Insights and Forecast, 2019-2031
- 7.1. Market Analysis, Insights and Forecast - by Solution Type
- 7.1.1. Network and Infrastructure Management
- 7.1.2. Application Performance Management
- 7.1.3. Configuration Management
- 7.1.4. Cloud and Hybrid IT Management
- 7.1.5. IT Operations Analytics
- 7.1.6. Automation and Orchestration
- 7.2. Market Analysis, Insights and Forecast - by Deployment
- 7.2.1. On Premise
- 7.2.2. Cloud Based
- 7.2.3. Hybrid
- 7.3. Market Analysis, Insights and Forecast - by End User Vertical
- 7.3.1. BFSI
- 7.3.2. IT and Telecom
- 7.3.3. Healthcare
- 7.3.4. Retail
- 7.3.5. Manufacturing
- 7.3.6. Government and Public Sector
- 7.3.7. Energy and Utilities
- 7.1. Market Analysis, Insights and Forecast - by Solution Type
- 8. Asia IT Operations Management Market Analysis, Insights and Forecast, 2019-2031
- 8.1. Market Analysis, Insights and Forecast - by Solution Type
- 8.1.1. Network and Infrastructure Management
- 8.1.2. Application Performance Management
- 8.1.3. Configuration Management
- 8.1.4. Cloud and Hybrid IT Management
- 8.1.5. IT Operations Analytics
- 8.1.6. Automation and Orchestration
- 8.2. Market Analysis, Insights and Forecast - by Deployment
- 8.2.1. On Premise
- 8.2.2. Cloud Based
- 8.2.3. Hybrid
- 8.3. Market Analysis, Insights and Forecast - by End User Vertical
- 8.3.1. BFSI
- 8.3.2. IT and Telecom
- 8.3.3. Healthcare
- 8.3.4. Retail
- 8.3.5. Manufacturing
- 8.3.6. Government and Public Sector
- 8.3.7. Energy and Utilities
- 8.1. Market Analysis, Insights and Forecast - by Solution Type
- 9. Australia and New Zealand IT Operations Management Market Analysis, Insights and Forecast, 2019-2031
- 9.1. Market Analysis, Insights and Forecast - by Solution Type
- 9.1.1. Network and Infrastructure Management
- 9.1.2. Application Performance Management
- 9.1.3. Configuration Management
- 9.1.4. Cloud and Hybrid IT Management
- 9.1.5. IT Operations Analytics
- 9.1.6. Automation and Orchestration
- 9.2. Market Analysis, Insights and Forecast - by Deployment
- 9.2.1. On Premise
- 9.2.2. Cloud Based
- 9.2.3. Hybrid
- 9.3. Market Analysis, Insights and Forecast - by End User Vertical
- 9.3.1. BFSI
- 9.3.2. IT and Telecom
- 9.3.3. Healthcare
- 9.3.4. Retail
- 9.3.5. Manufacturing
- 9.3.6. Government and Public Sector
- 9.3.7. Energy and Utilities
- 9.1. Market Analysis, Insights and Forecast - by Solution Type
- 10. Latin America IT Operations Management Market Analysis, Insights and Forecast, 2019-2031
- 10.1. Market Analysis, Insights and Forecast - by Solution Type
- 10.1.1. Network and Infrastructure Management
- 10.1.2. Application Performance Management
- 10.1.3. Configuration Management
- 10.1.4. Cloud and Hybrid IT Management
- 10.1.5. IT Operations Analytics
- 10.1.6. Automation and Orchestration
- 10.2. Market Analysis, Insights and Forecast - by Deployment
- 10.2.1. On Premise
- 10.2.2. Cloud Based
- 10.2.3. Hybrid
- 10.3. Market Analysis, Insights and Forecast - by End User Vertical
- 10.3.1. BFSI
- 10.3.2. IT and Telecom
- 10.3.3. Healthcare
- 10.3.4. Retail
- 10.3.5. Manufacturing
- 10.3.6. Government and Public Sector
- 10.3.7. Energy and Utilities
- 10.1. Market Analysis, Insights and Forecast - by Solution Type
- 11. Middle East and Africa IT Operations Management Market Analysis, Insights and Forecast, 2019-2031
- 11.1. Market Analysis, Insights and Forecast - by Solution Type
- 11.1.1. Network and Infrastructure Management
- 11.1.2. Application Performance Management
- 11.1.3. Configuration Management
- 11.1.4. Cloud and Hybrid IT Management
- 11.1.5. IT Operations Analytics
- 11.1.6. Automation and Orchestration
- 11.2. Market Analysis, Insights and Forecast - by Deployment
- 11.2.1. On Premise
- 11.2.2. Cloud Based
- 11.2.3. Hybrid
- 11.3. Market Analysis, Insights and Forecast - by End User Vertical
- 11.3.1. BFSI
- 11.3.2. IT and Telecom
- 11.3.3. Healthcare
- 11.3.4. Retail
- 11.3.5. Manufacturing
- 11.3.6. Government and Public Sector
- 11.3.7. Energy and Utilities
- 11.1. Market Analysis, Insights and Forecast - by Solution Type
- 12. Competitive Analysis
- 12.1. Global Market Share Analysis 2024
- 12.2. Company Profiles
- 12.2.1 ServiceNow
- 12.2.1.1. Overview
- 12.2.1.2. Products
- 12.2.1.3. SWOT Analysis
- 12.2.1.4. Recent Developments
- 12.2.1.5. Financials (Based on Availability)
- 12.2.2 BMC Software Inc
- 12.2.2.1. Overview
- 12.2.2.2. Products
- 12.2.2.3. SWOT Analysis
- 12.2.2.4. Recent Developments
- 12.2.2.5. Financials (Based on Availability)
- 12.2.3 IBM Corporation
- 12.2.3.1. Overview
- 12.2.3.2. Products
- 12.2.3.3. SWOT Analysis
- 12.2.3.4. Recent Developments
- 12.2.3.5. Financials (Based on Availability)
- 12.2.4 Microsoft Corporation
- 12.2.4.1. Overview
- 12.2.4.2. Products
- 12.2.4.3. SWOT Analysis
- 12.2.4.4. Recent Developments
- 12.2.4.5. Financials (Based on Availability)
- 12.2.5 SolarWinds Worldwide LLC
- 12.2.5.1. Overview
- 12.2.5.2. Products
- 12.2.5.3. SWOT Analysis
- 12.2.5.4. Recent Developments
- 12.2.5.5. Financials (Based on Availability)
- 12.2.6 Splunk Inc (Cisco Systems Inc)
- 12.2.6.1. Overview
- 12.2.6.2. Products
- 12.2.6.3. SWOT Analysis
- 12.2.6.4. Recent Developments
- 12.2.6.5. Financials (Based on Availability)
- 12.2.7 Broadcom
- 12.2.7.1. Overview
- 12.2.7.2. Products
- 12.2.7.3. SWOT Analysis
- 12.2.7.4. Recent Developments
- 12.2.7.5. Financials (Based on Availability)
- 12.2.8 Open Text Corporation
- 12.2.8.1. Overview
- 12.2.8.2. Products
- 12.2.8.3. SWOT Analysis
- 12.2.8.4. Recent Developments
- 12.2.8.5. Financials (Based on Availability)
- 12.2.9 Zoho Corporation Pvt Ltd
- 12.2.9.1. Overview
- 12.2.9.2. Products
- 12.2.9.3. SWOT Analysis
- 12.2.9.4. Recent Developments
- 12.2.9.5. Financials (Based on Availability)
- 12.2.10 Dynatrace LLC
- 12.2.10.1. Overview
- 12.2.10.2. Products
- 12.2.10.3. SWOT Analysis
- 12.2.10.4. Recent Developments
- 12.2.10.5. Financials (Based on Availability)
- 12.2.11 New Relic Inc
- 12.2.11.1. Overview
- 12.2.11.2. Products
- 12.2.11.3. SWOT Analysis
- 12.2.11.4. Recent Developments
- 12.2.11.5. Financials (Based on Availability)
- 12.2.12 Datadog
- 12.2.12.1. Overview
- 12.2.12.2. Products
- 12.2.12.3. SWOT Analysis
- 12.2.12.4. Recent Developments
- 12.2.12.5. Financials (Based on Availability)
- 12.2.13 Hewlett Packard Enterprise Development LP
- 12.2.13.1. Overview
- 12.2.13.2. Products
- 12.2.13.3. SWOT Analysis
- 12.2.13.4. Recent Developments
- 12.2.13.5. Financials (Based on Availability)
- 12.2.14 Dell Inc
- 12.2.14.1. Overview
- 12.2.14.2. Products
- 12.2.14.3. SWOT Analysis
- 12.2.14.4. Recent Developments
- 12.2.14.5. Financials (Based on Availability)
- 12.2.15 PagerDuty Inc
- 12.2.15.1. Overview
- 12.2.15.2. Products
- 12.2.15.3. SWOT Analysis
- 12.2.15.4. Recent Developments
- 12.2.15.5. Financials (Based on Availability)
- 12.2.16 ScienceLogi
- 12.2.16.1. Overview
- 12.2.16.2. Products
- 12.2.16.3. SWOT Analysis
- 12.2.16.4. Recent Developments
- 12.2.16.5. Financials (Based on Availability)
- 12.2.1 ServiceNow
List of Figures
- Figure 1: Global IT Operations Management Market Revenue Breakdown (Million, %) by Region 2024 & 2032
- Figure 2: Global IT Operations Management Market Volume Breakdown (Billion, %) by Region 2024 & 2032
- Figure 3: North America IT Operations Management Market Revenue (Million), by Solution Type 2024 & 2032
- Figure 4: North America IT Operations Management Market Volume (Billion), by Solution Type 2024 & 2032
- Figure 5: North America IT Operations Management Market Revenue Share (%), by Solution Type 2024 & 2032
- Figure 6: North America IT Operations Management Market Volume Share (%), by Solution Type 2024 & 2032
- Figure 7: North America IT Operations Management Market Revenue (Million), by Deployment 2024 & 2032
- Figure 8: North America IT Operations Management Market Volume (Billion), by Deployment 2024 & 2032
- Figure 9: North America IT Operations Management Market Revenue Share (%), by Deployment 2024 & 2032
- Figure 10: North America IT Operations Management Market Volume Share (%), by Deployment 2024 & 2032
- Figure 11: North America IT Operations Management Market Revenue (Million), by End User Vertical 2024 & 2032
- Figure 12: North America IT Operations Management Market Volume (Billion), by End User Vertical 2024 & 2032
- Figure 13: North America IT Operations Management Market Revenue Share (%), by End User Vertical 2024 & 2032
- Figure 14: North America IT Operations Management Market Volume Share (%), by End User Vertical 2024 & 2032
- Figure 15: North America IT Operations Management Market Revenue (Million), by Country 2024 & 2032
- Figure 16: North America IT Operations Management Market Volume (Billion), by Country 2024 & 2032
- Figure 17: North America IT Operations Management Market Revenue Share (%), by Country 2024 & 2032
- Figure 18: North America IT Operations Management Market Volume Share (%), by Country 2024 & 2032
- Figure 19: Europe IT Operations Management Market Revenue (Million), by Solution Type 2024 & 2032
- Figure 20: Europe IT Operations Management Market Volume (Billion), by Solution Type 2024 & 2032
- Figure 21: Europe IT Operations Management Market Revenue Share (%), by Solution Type 2024 & 2032
- Figure 22: Europe IT Operations Management Market Volume Share (%), by Solution Type 2024 & 2032
- Figure 23: Europe IT Operations Management Market Revenue (Million), by Deployment 2024 & 2032
- Figure 24: Europe IT Operations Management Market Volume (Billion), by Deployment 2024 & 2032
- Figure 25: Europe IT Operations Management Market Revenue Share (%), by Deployment 2024 & 2032
- Figure 26: Europe IT Operations Management Market Volume Share (%), by Deployment 2024 & 2032
- Figure 27: Europe IT Operations Management Market Revenue (Million), by End User Vertical 2024 & 2032
- Figure 28: Europe IT Operations Management Market Volume (Billion), by End User Vertical 2024 & 2032
- Figure 29: Europe IT Operations Management Market Revenue Share (%), by End User Vertical 2024 & 2032
- Figure 30: Europe IT Operations Management Market Volume Share (%), by End User Vertical 2024 & 2032
- Figure 31: Europe IT Operations Management Market Revenue (Million), by Country 2024 & 2032
- Figure 32: Europe IT Operations Management Market Volume (Billion), by Country 2024 & 2032
- Figure 33: Europe IT Operations Management Market Revenue Share (%), by Country 2024 & 2032
- Figure 34: Europe IT Operations Management Market Volume Share (%), by Country 2024 & 2032
- Figure 35: Asia IT Operations Management Market Revenue (Million), by Solution Type 2024 & 2032
- Figure 36: Asia IT Operations Management Market Volume (Billion), by Solution Type 2024 & 2032
- Figure 37: Asia IT Operations Management Market Revenue Share (%), by Solution Type 2024 & 2032
- Figure 38: Asia IT Operations Management Market Volume Share (%), by Solution Type 2024 & 2032
- Figure 39: Asia IT Operations Management Market Revenue (Million), by Deployment 2024 & 2032
- Figure 40: Asia IT Operations Management Market Volume (Billion), by Deployment 2024 & 2032
- Figure 41: Asia IT Operations Management Market Revenue Share (%), by Deployment 2024 & 2032
- Figure 42: Asia IT Operations Management Market Volume Share (%), by Deployment 2024 & 2032
- Figure 43: Asia IT Operations Management Market Revenue (Million), by End User Vertical 2024 & 2032
- Figure 44: Asia IT Operations Management Market Volume (Billion), by End User Vertical 2024 & 2032
- Figure 45: Asia IT Operations Management Market Revenue Share (%), by End User Vertical 2024 & 2032
- Figure 46: Asia IT Operations Management Market Volume Share (%), by End User Vertical 2024 & 2032
- Figure 47: Asia IT Operations Management Market Revenue (Million), by Country 2024 & 2032
- Figure 48: Asia IT Operations Management Market Volume (Billion), by Country 2024 & 2032
- Figure 49: Asia IT Operations Management Market Revenue Share (%), by Country 2024 & 2032
- Figure 50: Asia IT Operations Management Market Volume Share (%), by Country 2024 & 2032
- Figure 51: Australia and New Zealand IT Operations Management Market Revenue (Million), by Solution Type 2024 & 2032
- Figure 52: Australia and New Zealand IT Operations Management Market Volume (Billion), by Solution Type 2024 & 2032
- Figure 53: Australia and New Zealand IT Operations Management Market Revenue Share (%), by Solution Type 2024 & 2032
- Figure 54: Australia and New Zealand IT Operations Management Market Volume Share (%), by Solution Type 2024 & 2032
- Figure 55: Australia and New Zealand IT Operations Management Market Revenue (Million), by Deployment 2024 & 2032
- Figure 56: Australia and New Zealand IT Operations Management Market Volume (Billion), by Deployment 2024 & 2032
- Figure 57: Australia and New Zealand IT Operations Management Market Revenue Share (%), by Deployment 2024 & 2032
- Figure 58: Australia and New Zealand IT Operations Management Market Volume Share (%), by Deployment 2024 & 2032
- Figure 59: Australia and New Zealand IT Operations Management Market Revenue (Million), by End User Vertical 2024 & 2032
- Figure 60: Australia and New Zealand IT Operations Management Market Volume (Billion), by End User Vertical 2024 & 2032
- Figure 61: Australia and New Zealand IT Operations Management Market Revenue Share (%), by End User Vertical 2024 & 2032
- Figure 62: Australia and New Zealand IT Operations Management Market Volume Share (%), by End User Vertical 2024 & 2032
- Figure 63: Australia and New Zealand IT Operations Management Market Revenue (Million), by Country 2024 & 2032
- Figure 64: Australia and New Zealand IT Operations Management Market Volume (Billion), by Country 2024 & 2032
- Figure 65: Australia and New Zealand IT Operations Management Market Revenue Share (%), by Country 2024 & 2032
- Figure 66: Australia and New Zealand IT Operations Management Market Volume Share (%), by Country 2024 & 2032
- Figure 67: Latin America IT Operations Management Market Revenue (Million), by Solution Type 2024 & 2032
- Figure 68: Latin America IT Operations Management Market Volume (Billion), by Solution Type 2024 & 2032
- Figure 69: Latin America IT Operations Management Market Revenue Share (%), by Solution Type 2024 & 2032
- Figure 70: Latin America IT Operations Management Market Volume Share (%), by Solution Type 2024 & 2032
- Figure 71: Latin America IT Operations Management Market Revenue (Million), by Deployment 2024 & 2032
- Figure 72: Latin America IT Operations Management Market Volume (Billion), by Deployment 2024 & 2032
- Figure 73: Latin America IT Operations Management Market Revenue Share (%), by Deployment 2024 & 2032
- Figure 74: Latin America IT Operations Management Market Volume Share (%), by Deployment 2024 & 2032
- Figure 75: Latin America IT Operations Management Market Revenue (Million), by End User Vertical 2024 & 2032
- Figure 76: Latin America IT Operations Management Market Volume (Billion), by End User Vertical 2024 & 2032
- Figure 77: Latin America IT Operations Management Market Revenue Share (%), by End User Vertical 2024 & 2032
- Figure 78: Latin America IT Operations Management Market Volume Share (%), by End User Vertical 2024 & 2032
- Figure 79: Latin America IT Operations Management Market Revenue (Million), by Country 2024 & 2032
- Figure 80: Latin America IT Operations Management Market Volume (Billion), by Country 2024 & 2032
- Figure 81: Latin America IT Operations Management Market Revenue Share (%), by Country 2024 & 2032
- Figure 82: Latin America IT Operations Management Market Volume Share (%), by Country 2024 & 2032
- Figure 83: Middle East and Africa IT Operations Management Market Revenue (Million), by Solution Type 2024 & 2032
- Figure 84: Middle East and Africa IT Operations Management Market Volume (Billion), by Solution Type 2024 & 2032
- Figure 85: Middle East and Africa IT Operations Management Market Revenue Share (%), by Solution Type 2024 & 2032
- Figure 86: Middle East and Africa IT Operations Management Market Volume Share (%), by Solution Type 2024 & 2032
- Figure 87: Middle East and Africa IT Operations Management Market Revenue (Million), by Deployment 2024 & 2032
- Figure 88: Middle East and Africa IT Operations Management Market Volume (Billion), by Deployment 2024 & 2032
- Figure 89: Middle East and Africa IT Operations Management Market Revenue Share (%), by Deployment 2024 & 2032
- Figure 90: Middle East and Africa IT Operations Management Market Volume Share (%), by Deployment 2024 & 2032
- Figure 91: Middle East and Africa IT Operations Management Market Revenue (Million), by End User Vertical 2024 & 2032
- Figure 92: Middle East and Africa IT Operations Management Market Volume (Billion), by End User Vertical 2024 & 2032
- Figure 93: Middle East and Africa IT Operations Management Market Revenue Share (%), by End User Vertical 2024 & 2032
- Figure 94: Middle East and Africa IT Operations Management Market Volume Share (%), by End User Vertical 2024 & 2032
- Figure 95: Middle East and Africa IT Operations Management Market Revenue (Million), by Country 2024 & 2032
- Figure 96: Middle East and Africa IT Operations Management Market Volume (Billion), by Country 2024 & 2032
- Figure 97: Middle East and Africa IT Operations Management Market Revenue Share (%), by Country 2024 & 2032
- Figure 98: Middle East and Africa IT Operations Management Market Volume Share (%), by Country 2024 & 2032
List of Tables
- Table 1: Global IT Operations Management Market Revenue Million Forecast, by Region 2019 & 2032
- Table 2: Global IT Operations Management Market Volume Billion Forecast, by Region 2019 & 2032
- Table 3: Global IT Operations Management Market Revenue Million Forecast, by Solution Type 2019 & 2032
- Table 4: Global IT Operations Management Market Volume Billion Forecast, by Solution Type 2019 & 2032
- Table 5: Global IT Operations Management Market Revenue Million Forecast, by Deployment 2019 & 2032
- Table 6: Global IT Operations Management Market Volume Billion Forecast, by Deployment 2019 & 2032
- Table 7: Global IT Operations Management Market Revenue Million Forecast, by End User Vertical 2019 & 2032
- Table 8: Global IT Operations Management Market Volume Billion Forecast, by End User Vertical 2019 & 2032
- Table 9: Global IT Operations Management Market Revenue Million Forecast, by Region 2019 & 2032
- Table 10: Global IT Operations Management Market Volume Billion Forecast, by Region 2019 & 2032
- Table 11: Global IT Operations Management Market Revenue Million Forecast, by Solution Type 2019 & 2032
- Table 12: Global IT Operations Management Market Volume Billion Forecast, by Solution Type 2019 & 2032
- Table 13: Global IT Operations Management Market Revenue Million Forecast, by Deployment 2019 & 2032
- Table 14: Global IT Operations Management Market Volume Billion Forecast, by Deployment 2019 & 2032
- Table 15: Global IT Operations Management Market Revenue Million Forecast, by End User Vertical 2019 & 2032
- Table 16: Global IT Operations Management Market Volume Billion Forecast, by End User Vertical 2019 & 2032
- Table 17: Global IT Operations Management Market Revenue Million Forecast, by Country 2019 & 2032
- Table 18: Global IT Operations Management Market Volume Billion Forecast, by Country 2019 & 2032
- Table 19: Global IT Operations Management Market Revenue Million Forecast, by Solution Type 2019 & 2032
- Table 20: Global IT Operations Management Market Volume Billion Forecast, by Solution Type 2019 & 2032
- Table 21: Global IT Operations Management Market Revenue Million Forecast, by Deployment 2019 & 2032
- Table 22: Global IT Operations Management Market Volume Billion Forecast, by Deployment 2019 & 2032
- Table 23: Global IT Operations Management Market Revenue Million Forecast, by End User Vertical 2019 & 2032
- Table 24: Global IT Operations Management Market Volume Billion Forecast, by End User Vertical 2019 & 2032
- Table 25: Global IT Operations Management Market Revenue Million Forecast, by Country 2019 & 2032
- Table 26: Global IT Operations Management Market Volume Billion Forecast, by Country 2019 & 2032
- Table 27: Global IT Operations Management Market Revenue Million Forecast, by Solution Type 2019 & 2032
- Table 28: Global IT Operations Management Market Volume Billion Forecast, by Solution Type 2019 & 2032
- Table 29: Global IT Operations Management Market Revenue Million Forecast, by Deployment 2019 & 2032
- Table 30: Global IT Operations Management Market Volume Billion Forecast, by Deployment 2019 & 2032
- Table 31: Global IT Operations Management Market Revenue Million Forecast, by End User Vertical 2019 & 2032
- Table 32: Global IT Operations Management Market Volume Billion Forecast, by End User Vertical 2019 & 2032
- Table 33: Global IT Operations Management Market Revenue Million Forecast, by Country 2019 & 2032
- Table 34: Global IT Operations Management Market Volume Billion Forecast, by Country 2019 & 2032
- Table 35: Global IT Operations Management Market Revenue Million Forecast, by Solution Type 2019 & 2032
- Table 36: Global IT Operations Management Market Volume Billion Forecast, by Solution Type 2019 & 2032
- Table 37: Global IT Operations Management Market Revenue Million Forecast, by Deployment 2019 & 2032
- Table 38: Global IT Operations Management Market Volume Billion Forecast, by Deployment 2019 & 2032
- Table 39: Global IT Operations Management Market Revenue Million Forecast, by End User Vertical 2019 & 2032
- Table 40: Global IT Operations Management Market Volume Billion Forecast, by End User Vertical 2019 & 2032
- Table 41: Global IT Operations Management Market Revenue Million Forecast, by Country 2019 & 2032
- Table 42: Global IT Operations Management Market Volume Billion Forecast, by Country 2019 & 2032
- Table 43: Global IT Operations Management Market Revenue Million Forecast, by Solution Type 2019 & 2032
- Table 44: Global IT Operations Management Market Volume Billion Forecast, by Solution Type 2019 & 2032
- Table 45: Global IT Operations Management Market Revenue Million Forecast, by Deployment 2019 & 2032
- Table 46: Global IT Operations Management Market Volume Billion Forecast, by Deployment 2019 & 2032
- Table 47: Global IT Operations Management Market Revenue Million Forecast, by End User Vertical 2019 & 2032
- Table 48: Global IT Operations Management Market Volume Billion Forecast, by End User Vertical 2019 & 2032
- Table 49: Global IT Operations Management Market Revenue Million Forecast, by Country 2019 & 2032
- Table 50: Global IT Operations Management Market Volume Billion Forecast, by Country 2019 & 2032
- Table 51: Global IT Operations Management Market Revenue Million Forecast, by Solution Type 2019 & 2032
- Table 52: Global IT Operations Management Market Volume Billion Forecast, by Solution Type 2019 & 2032
- Table 53: Global IT Operations Management Market Revenue Million Forecast, by Deployment 2019 & 2032
- Table 54: Global IT Operations Management Market Volume Billion Forecast, by Deployment 2019 & 2032
- Table 55: Global IT Operations Management Market Revenue Million Forecast, by End User Vertical 2019 & 2032
- Table 56: Global IT Operations Management Market Volume Billion Forecast, by End User Vertical 2019 & 2032
- Table 57: Global IT Operations Management Market Revenue Million Forecast, by Country 2019 & 2032
- Table 58: Global IT Operations Management Market Volume Billion Forecast, by Country 2019 & 2032
Frequently Asked Questions
1. What is the projected Compound Annual Growth Rate (CAGR) of the IT Operations Management Market?
The projected CAGR is approximately 9.00%.
2. Which companies are prominent players in the IT Operations Management Market?
Key companies in the market include ServiceNow, BMC Software Inc, IBM Corporation, Microsoft Corporation, SolarWinds Worldwide LLC, Splunk Inc (Cisco Systems Inc), Broadcom, Open Text Corporation, Zoho Corporation Pvt Ltd, Dynatrace LLC, New Relic Inc, Datadog, Hewlett Packard Enterprise Development LP, Dell Inc, PagerDuty Inc, ScienceLogi.
3. What are the main segments of the IT Operations Management Market?
The market segments include Solution Type, Deployment, End User Vertical.
4. Can you provide details about the market size?
The market size is estimated to be USD 31 Million as of 2022.
5. What are some drivers contributing to market growth?
Increasing IT Complexity; Adoption of AI and Automation.
6. What are the notable trends driving market growth?
IT and Telecom Sector Witnessing Demand.
7. Are there any restraints impacting market growth?
Increasing IT Complexity; Adoption of AI and Automation.
8. Can you provide examples of recent developments in the market?
August 2024 - Hewlett Packard Enterprise (HPE) announced it is buying Morpheus Data, a leader in hybrid cloud management software. This move underscores HPE's dedication to streamlining IT complexities, further bolstering the hybrid operations features of its HPE GreenLake cloud. With Morpheus onboard, HPE GreenLake is expected to benefit from enhanced capabilities, including multi-vendor and multi-cloud application provisioning, orchestration, automation, and advanced FinOps tools for optimizing cloud costs.
9. What pricing options are available for accessing the report?
Pricing options include single-user, multi-user, and enterprise licenses priced at USD 4750, USD 5250, and USD 8750 respectively.
10. Is the market size provided in terms of value or volume?
The market size is provided in terms of value, measured in Million and volume, measured in Billion.
11. Are there any specific market keywords associated with the report?
Yes, the market keyword associated with the report is "IT Operations Management Market," which aids in identifying and referencing the specific market segment covered.
12. How do I determine which pricing option suits my needs best?
The pricing options vary based on user requirements and access needs. Individual users may opt for single-user licenses, while businesses requiring broader access may choose multi-user or enterprise licenses for cost-effective access to the report.
13. Are there any additional resources or data provided in the IT Operations Management Market report?
While the report offers comprehensive insights, it's advisable to review the specific contents or supplementary materials provided to ascertain if additional resources or data are available.
14. How can I stay updated on further developments or reports in the IT Operations Management Market?
To stay informed about further developments, trends, and reports in the IT Operations Management Market, consider subscribing to industry newsletters, following relevant companies and organizations, or regularly checking reputable industry news sources and publications.
Methodology
Step 1 - Identification of Relevant Samples Size from Population Database


Step 2 - Approaches for Defining Global Market Size (Value, Volume* & Price*)

Note*: In applicable scenarios
Step 3 - Data Sources
Primary Research
- Web Analytics
- Survey Reports
- Research Institute
- Latest Research Reports
- Opinion Leaders
Secondary Research
- Annual Reports
- White Paper
- Latest Press Release
- Industry Association
- Paid Database
- Investor Presentations

Step 4 - Data Triangulation
Involves using different sources of information in order to increase the validity of a study
These sources are likely to be stakeholders in a program - participants, other researchers, program staff, other community members, and so on.
Then we put all data in single framework & apply various statistical tools to find out the dynamic on the market.
During the analysis stage, feedback from the stakeholder groups would be compared to determine areas of agreement as well as areas of divergence
