

Key Insights
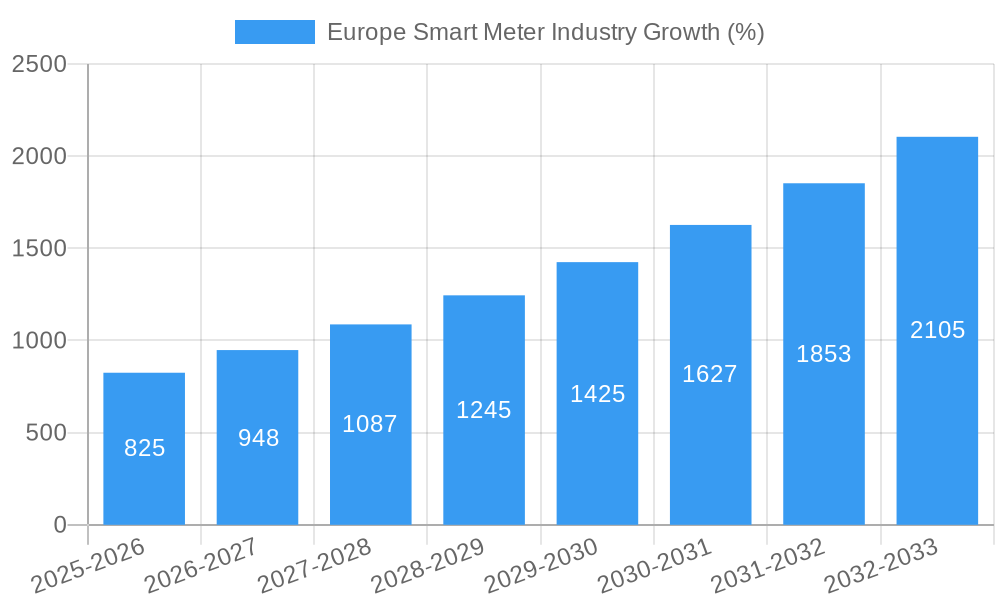
The European smart meter market is experiencing robust growth, driven by increasing government mandates for advanced metering infrastructure (AMI) to enhance grid management and energy efficiency. A compound annual growth rate (CAGR) of 12.18% from 2019-2033 indicates a significant expansion, with the market size projected to reach a substantial value. Key drivers include the need for improved energy consumption monitoring, reduced operational costs for utilities, and the integration of smart meters into broader smart city initiatives. Growth is further fueled by technological advancements, such as the incorporation of communication technologies like cellular and NB-IoT, enabling more efficient data transmission and remote meter reading capabilities. The market is segmented by meter type (gas, water, electricity), end-user (residential, commercial, industrial), and country (with the UK, Germany, France, Italy, and Spain representing major markets). While the initial investment costs for widespread smart meter deployment can be a restraint, the long-term benefits in terms of energy savings and improved grid reliability outweigh this factor, driving continued market expansion.
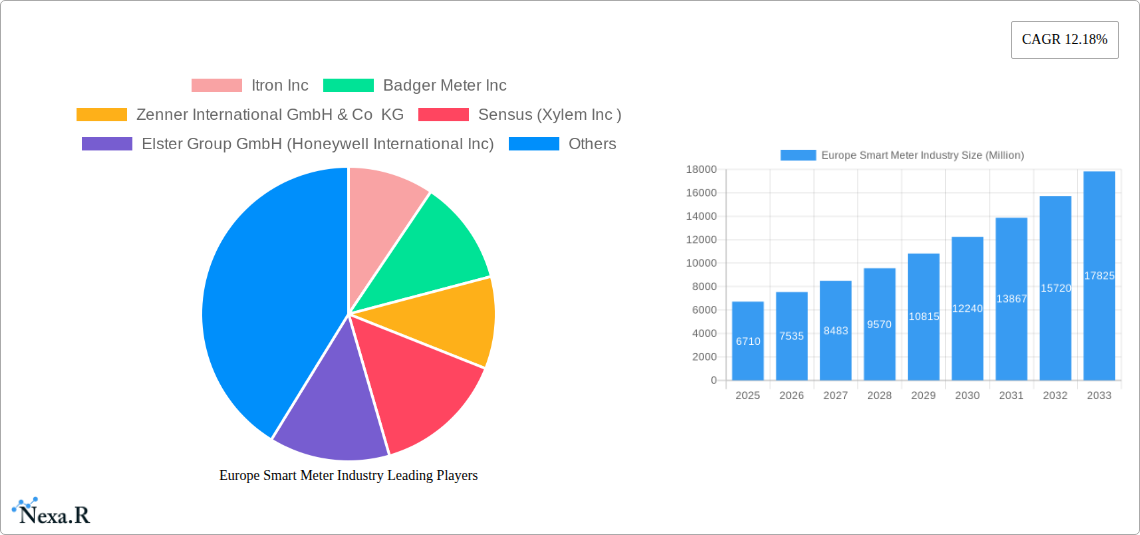
The competitive landscape is characterized by established players like Itron, Badger Meter, and Landis+GYR, alongside regional and emerging companies. These companies are engaged in strategic partnerships, acquisitions, and technological innovations to strengthen their market positioning. The residential sector currently dominates the market share, but the commercial and industrial segments are anticipated to show significant growth potential driven by increasing demand for energy management solutions and optimized resource allocation. Germany, the UK, and France are projected to remain leading markets within Europe, benefiting from established regulatory frameworks and substantial investments in smart grid infrastructure. Future growth will likely be influenced by factors such as evolving energy policies, the integration of renewable energy sources, and advancements in data analytics capabilities that leverage smart meter data for improved grid optimization and customer engagement.
Europe Smart Meter Industry: A Comprehensive Market Report (2019-2033)
This comprehensive report provides an in-depth analysis of the European smart meter industry, covering market dynamics, growth trends, key players, and future outlook. With a focus on revenue and unit shipments (in million units), this report is an essential resource for industry professionals, investors, and strategic decision-makers. The study period spans from 2019 to 2033, with 2025 serving as the base and estimated year.
Europe Smart Meter Industry Market Dynamics & Structure
This section analyzes the competitive landscape, technological advancements, regulatory influences, and market trends shaping the European smart meter industry. The market is characterized by a moderately concentrated structure with several key players holding significant market share. Technological innovation, driven by the Internet of Things (IoT) and advanced communication technologies, is a key driver. Stringent environmental regulations and the push for energy efficiency are further fueling market growth.
- Market Concentration: The top 5 players account for approximately xx% of the market share in 2025.
- Technological Innovation: Advancements in communication protocols (e.g., NB-IoT, LoRaWAN) and data analytics capabilities are driving product differentiation.
- Regulatory Framework: EU directives on energy efficiency and smart grid development are creating a favorable regulatory environment.
- Competitive Substitutes: Traditional mechanical meters face increasing pressure from the cost-effectiveness and enhanced functionality of smart meters.
- End-User Demographics: The residential sector dominates the market, followed by the commercial and industrial sectors.
- M&A Trends: The past five years have witnessed xx M&A deals in the European smart meter sector, indicating consolidation and increased competition. Innovation barriers include high initial investment costs and interoperability challenges.
Europe Smart Meter Industry Growth Trends & Insights
The European smart meter market experienced robust growth during the historical period (2019-2024), with a CAGR of xx%. This growth is attributed to increasing government initiatives promoting smart grid infrastructure, rising energy prices, and growing consumer demand for energy efficiency. The residential sector is expected to continue dominating the market, with a projected xx% market share in 2033. Technological disruptions, particularly the adoption of advanced communication protocols and data analytics, are accelerating market growth and improving efficiency. Consumer behavior shifts toward greater energy awareness are further boosting demand. Market penetration is projected to reach xx% by 2033.
Dominant Regions, Countries, or Segments in Europe Smart Meter Industry
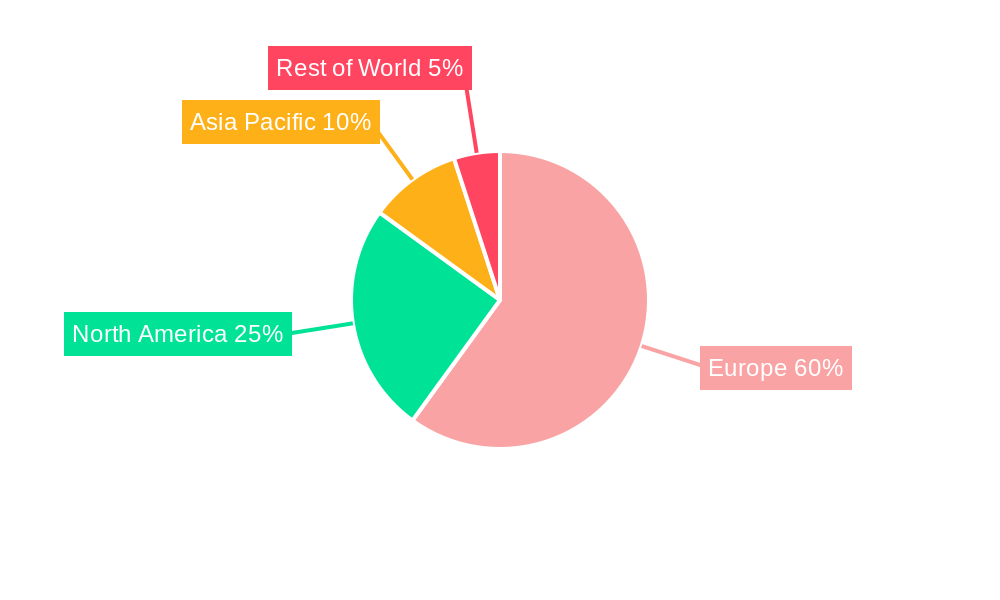
The United Kingdom, Germany, and France are the leading markets in Europe, driven by strong government support for smart metering programs and well-established grid infrastructure. The smart electricity meter segment holds the largest market share, followed by smart water and smart gas meters. Within end-user segments, the residential sector displays the highest growth potential, due to increasing consumer awareness and government incentives.
- Key Drivers: Government policies promoting energy efficiency, favorable regulatory frameworks, and robust grid infrastructure are key drivers of growth in the UK, Germany, and France.
- Dominance Factors: Early adoption of smart metering programs, high consumer awareness, and strong technological infrastructure in these countries contribute to their market dominance.
- Growth Potential: The Rest of Europe region presents significant untapped potential, driven by increasing government investments in smart grid modernization.
Europe Smart Meter Industry Product Landscape
The smart meter market features a diverse range of products, including advanced metering infrastructure (AMI) solutions, incorporating various communication technologies (cellular, PLC, RF) and data analytics capabilities. Recent innovations include the integration of IoT technologies for remote monitoring and control, enhanced security features, and advanced data visualization dashboards. Unique selling propositions (USPs) include improved accuracy, reduced energy loss, and enhanced customer engagement through real-time data insights.
Key Drivers, Barriers & Challenges in Europe Smart Meter Industry
Key Drivers:
- Increasing government regulations promoting energy efficiency and smart grid deployment.
- Rising energy prices and consumer demand for cost savings.
- Technological advancements enabling greater functionality and data insights.
Challenges:
- High initial investment costs for smart meter installations can hinder adoption.
- Interoperability issues between different smart meter systems and communication protocols present a significant hurdle.
- Cybersecurity concerns related to data security and privacy are critical. The estimated impact of these challenges on market growth is a reduction of approximately xx% annually.
Emerging Opportunities in Europe Smart Meter Industry
- Expansion into the untapped markets within the "Rest of Europe" region presents significant opportunities for growth.
- The integration of smart meters with other smart home technologies (e.g., smart thermostats, home energy management systems) opens new avenues for market expansion.
- Development of advanced data analytics solutions to provide enhanced insights into energy consumption patterns.
Growth Accelerators in the Europe Smart Meter Industry
Technological breakthroughs in communication technologies and data analytics will continue to drive market growth. Strategic partnerships between meter manufacturers, energy utilities, and technology providers will fuel innovation and market penetration. Expansion into new markets and the integration of smart meters with other smart city initiatives will accelerate market expansion.
Key Players Shaping the Europe Smart Meter Industry Market
- Itron Inc
- Badger Meter Inc
- Zenner International GmbH & Co KG
- Sensus (Xylem Inc)
- Elster Group GmbH (Honeywell International Inc)
- Kamstrup A/S
- Apator SA
- Arad Group
- Diehl Stiftung & Co KG
- Landis+ GYR Group AG
- Ningbo Sanxing Electric Co Ltd
- AEM
- General Electric Company
Notable Milestones in Europe Smart Meter Industry Sector
- December 2022: Trilliant secures a contract to supply smart meters for Ireland’s National Smart Metering Programme, boosting AMI adoption.
- November 2022: Landis+Gyr launches new ultrasonic smart water meters with NB-IoT connectivity, enhancing smart water network capabilities.
In-Depth Europe Smart Meter Industry Market Outlook
The European smart meter market is poised for sustained growth over the forecast period (2025-2033), driven by technological advancements, supportive government policies, and increasing consumer demand for energy efficiency. Strategic partnerships, market expansion, and the integration of smart meters into broader smart city initiatives will create significant growth opportunities. The market is expected to reach a value of xx million units by 2033, indicating substantial future potential.
Europe Smart Meter Industry Segmentation
-
1. Type of Meter (Revenue and Unit Shipments)
- 1.1. Smart Gas Meter
- 1.2. Smart Water Meter
- 1.3. Smart Electricity Meter
-
2. End User
- 2.1. Residential
- 2.2. Commercial
- 2.3. Industrial
Europe Smart Meter Industry Segmentation By Geography
-
1. Europe
- 1.1. United Kingdom
- 1.2. Germany
- 1.3. France
- 1.4. Italy
- 1.5. Spain
- 1.6. Netherlands
- 1.7. Belgium
- 1.8. Sweden
- 1.9. Norway
- 1.10. Poland
- 1.11. Denmark
Europe Smart Meter Industry REPORT HIGHLIGHTS
| Aspects | Details |
|---|---|
| Study Period | 2019-2033 |
| Base Year | 2024 |
| Estimated Year | 2025 |
| Forecast Period | 2025-2033 |
| Historical Period | 2019-2024 |
| Growth Rate | CAGR of 12.18% from 2019-2033 |
| Segmentation |
|
Table of Contents
- 1. Introduction
- 1.1. Research Scope
- 1.2. Market Segmentation
- 1.3. Research Methodology
- 1.4. Definitions and Assumptions
- 2. Executive Summary
- 2.1. Introduction
- 3. Market Dynamics
- 3.1. Introduction
- 3.2. Market Drivers
- 3.2.1. Increased Investments in Smart Grid Projects; Growth in Smart City Deployment; Supportive Government Regulations
- 3.3. Market Restrains
- 3.3.1. High Costs and Security Concerns; Integration Difficulties with Smart Meters
- 3.4. Market Trends
- 3.4.1. Increased investments in smart grid projects in expected to drive the market growth
- 4. Market Factor Analysis
- 4.1. Porters Five Forces
- 4.2. Supply/Value Chain
- 4.3. PESTEL analysis
- 4.4. Market Entropy
- 4.5. Patent/Trademark Analysis
- 5. Europe Smart Meter Industry Analysis, Insights and Forecast, 2019-2031
- 5.1. Market Analysis, Insights and Forecast - by Type of Meter (Revenue and Unit Shipments)
- 5.1.1. Smart Gas Meter
- 5.1.2. Smart Water Meter
- 5.1.3. Smart Electricity Meter
- 5.2. Market Analysis, Insights and Forecast - by End User
- 5.2.1. Residential
- 5.2.2. Commercial
- 5.2.3. Industrial
- 5.3. Market Analysis, Insights and Forecast - by Region
- 5.3.1. Europe
- 5.1. Market Analysis, Insights and Forecast - by Type of Meter (Revenue and Unit Shipments)
- 6. Germany Europe Smart Meter Industry Analysis, Insights and Forecast, 2019-2031
- 7. France Europe Smart Meter Industry Analysis, Insights and Forecast, 2019-2031
- 8. Italy Europe Smart Meter Industry Analysis, Insights and Forecast, 2019-2031
- 9. United Kingdom Europe Smart Meter Industry Analysis, Insights and Forecast, 2019-2031
- 10. Netherlands Europe Smart Meter Industry Analysis, Insights and Forecast, 2019-2031
- 11. Sweden Europe Smart Meter Industry Analysis, Insights and Forecast, 2019-2031
- 12. Rest of Europe Europe Smart Meter Industry Analysis, Insights and Forecast, 2019-2031
- 13. Competitive Analysis
- 13.1. Market Share Analysis 2024
- 13.2. Company Profiles
- 13.2.1 Itron Inc
- 13.2.1.1. Overview
- 13.2.1.2. Products
- 13.2.1.3. SWOT Analysis
- 13.2.1.4. Recent Developments
- 13.2.1.5. Financials (Based on Availability)
- 13.2.2 Badger Meter Inc
- 13.2.2.1. Overview
- 13.2.2.2. Products
- 13.2.2.3. SWOT Analysis
- 13.2.2.4. Recent Developments
- 13.2.2.5. Financials (Based on Availability)
- 13.2.3 Zenner International GmbH & Co KG
- 13.2.3.1. Overview
- 13.2.3.2. Products
- 13.2.3.3. SWOT Analysis
- 13.2.3.4. Recent Developments
- 13.2.3.5. Financials (Based on Availability)
- 13.2.4 Sensus (Xylem Inc )
- 13.2.4.1. Overview
- 13.2.4.2. Products
- 13.2.4.3. SWOT Analysis
- 13.2.4.4. Recent Developments
- 13.2.4.5. Financials (Based on Availability)
- 13.2.5 Elster Group GmbH (Honeywell International Inc)
- 13.2.5.1. Overview
- 13.2.5.2. Products
- 13.2.5.3. SWOT Analysis
- 13.2.5.4. Recent Developments
- 13.2.5.5. Financials (Based on Availability)
- 13.2.6 Kamstrup A/S
- 13.2.6.1. Overview
- 13.2.6.2. Products
- 13.2.6.3. SWOT Analysis
- 13.2.6.4. Recent Developments
- 13.2.6.5. Financials (Based on Availability)
- 13.2.7 Apator SA
- 13.2.7.1. Overview
- 13.2.7.2. Products
- 13.2.7.3. SWOT Analysis
- 13.2.7.4. Recent Developments
- 13.2.7.5. Financials (Based on Availability)
- 13.2.8 Arad Group
- 13.2.8.1. Overview
- 13.2.8.2. Products
- 13.2.8.3. SWOT Analysis
- 13.2.8.4. Recent Developments
- 13.2.8.5. Financials (Based on Availability)
- 13.2.9 Diehl Stiftung & Co KG
- 13.2.9.1. Overview
- 13.2.9.2. Products
- 13.2.9.3. SWOT Analysis
- 13.2.9.4. Recent Developments
- 13.2.9.5. Financials (Based on Availability)
- 13.2.10 Landis+ GYR Group AG
- 13.2.10.1. Overview
- 13.2.10.2. Products
- 13.2.10.3. SWOT Analysis
- 13.2.10.4. Recent Developments
- 13.2.10.5. Financials (Based on Availability)
- 13.2.11 Ningbo Sanxing Electric Co Ltd
- 13.2.11.1. Overview
- 13.2.11.2. Products
- 13.2.11.3. SWOT Analysis
- 13.2.11.4. Recent Developments
- 13.2.11.5. Financials (Based on Availability)
- 13.2.12 AEM
- 13.2.12.1. Overview
- 13.2.12.2. Products
- 13.2.12.3. SWOT Analysis
- 13.2.12.4. Recent Developments
- 13.2.12.5. Financials (Based on Availability)
- 13.2.13 General Electric Company
- 13.2.13.1. Overview
- 13.2.13.2. Products
- 13.2.13.3. SWOT Analysis
- 13.2.13.4. Recent Developments
- 13.2.13.5. Financials (Based on Availability)
- 13.2.1 Itron Inc
List of Figures
- Figure 1: Europe Smart Meter Industry Revenue Breakdown (Million, %) by Product 2024 & 2032
- Figure 2: Europe Smart Meter Industry Share (%) by Company 2024
List of Tables
- Table 1: Europe Smart Meter Industry Revenue Million Forecast, by Region 2019 & 2032
- Table 2: Europe Smart Meter Industry Volume K Unit Forecast, by Region 2019 & 2032
- Table 3: Europe Smart Meter Industry Revenue Million Forecast, by Type of Meter (Revenue and Unit Shipments) 2019 & 2032
- Table 4: Europe Smart Meter Industry Volume K Unit Forecast, by Type of Meter (Revenue and Unit Shipments) 2019 & 2032
- Table 5: Europe Smart Meter Industry Revenue Million Forecast, by End User 2019 & 2032
- Table 6: Europe Smart Meter Industry Volume K Unit Forecast, by End User 2019 & 2032
- Table 7: Europe Smart Meter Industry Revenue Million Forecast, by Region 2019 & 2032
- Table 8: Europe Smart Meter Industry Volume K Unit Forecast, by Region 2019 & 2032
- Table 9: Europe Smart Meter Industry Revenue Million Forecast, by Country 2019 & 2032
- Table 10: Europe Smart Meter Industry Volume K Unit Forecast, by Country 2019 & 2032
- Table 11: Germany Europe Smart Meter Industry Revenue (Million) Forecast, by Application 2019 & 2032
- Table 12: Germany Europe Smart Meter Industry Volume (K Unit) Forecast, by Application 2019 & 2032
- Table 13: France Europe Smart Meter Industry Revenue (Million) Forecast, by Application 2019 & 2032
- Table 14: France Europe Smart Meter Industry Volume (K Unit) Forecast, by Application 2019 & 2032
- Table 15: Italy Europe Smart Meter Industry Revenue (Million) Forecast, by Application 2019 & 2032
- Table 16: Italy Europe Smart Meter Industry Volume (K Unit) Forecast, by Application 2019 & 2032
- Table 17: United Kingdom Europe Smart Meter Industry Revenue (Million) Forecast, by Application 2019 & 2032
- Table 18: United Kingdom Europe Smart Meter Industry Volume (K Unit) Forecast, by Application 2019 & 2032
- Table 19: Netherlands Europe Smart Meter Industry Revenue (Million) Forecast, by Application 2019 & 2032
- Table 20: Netherlands Europe Smart Meter Industry Volume (K Unit) Forecast, by Application 2019 & 2032
- Table 21: Sweden Europe Smart Meter Industry Revenue (Million) Forecast, by Application 2019 & 2032
- Table 22: Sweden Europe Smart Meter Industry Volume (K Unit) Forecast, by Application 2019 & 2032
- Table 23: Rest of Europe Europe Smart Meter Industry Revenue (Million) Forecast, by Application 2019 & 2032
- Table 24: Rest of Europe Europe Smart Meter Industry Volume (K Unit) Forecast, by Application 2019 & 2032
- Table 25: Europe Smart Meter Industry Revenue Million Forecast, by Type of Meter (Revenue and Unit Shipments) 2019 & 2032
- Table 26: Europe Smart Meter Industry Volume K Unit Forecast, by Type of Meter (Revenue and Unit Shipments) 2019 & 2032
- Table 27: Europe Smart Meter Industry Revenue Million Forecast, by End User 2019 & 2032
- Table 28: Europe Smart Meter Industry Volume K Unit Forecast, by End User 2019 & 2032
- Table 29: Europe Smart Meter Industry Revenue Million Forecast, by Country 2019 & 2032
- Table 30: Europe Smart Meter Industry Volume K Unit Forecast, by Country 2019 & 2032
- Table 31: United Kingdom Europe Smart Meter Industry Revenue (Million) Forecast, by Application 2019 & 2032
- Table 32: United Kingdom Europe Smart Meter Industry Volume (K Unit) Forecast, by Application 2019 & 2032
- Table 33: Germany Europe Smart Meter Industry Revenue (Million) Forecast, by Application 2019 & 2032
- Table 34: Germany Europe Smart Meter Industry Volume (K Unit) Forecast, by Application 2019 & 2032
- Table 35: France Europe Smart Meter Industry Revenue (Million) Forecast, by Application 2019 & 2032
- Table 36: France Europe Smart Meter Industry Volume (K Unit) Forecast, by Application 2019 & 2032
- Table 37: Italy Europe Smart Meter Industry Revenue (Million) Forecast, by Application 2019 & 2032
- Table 38: Italy Europe Smart Meter Industry Volume (K Unit) Forecast, by Application 2019 & 2032
- Table 39: Spain Europe Smart Meter Industry Revenue (Million) Forecast, by Application 2019 & 2032
- Table 40: Spain Europe Smart Meter Industry Volume (K Unit) Forecast, by Application 2019 & 2032
- Table 41: Netherlands Europe Smart Meter Industry Revenue (Million) Forecast, by Application 2019 & 2032
- Table 42: Netherlands Europe Smart Meter Industry Volume (K Unit) Forecast, by Application 2019 & 2032
- Table 43: Belgium Europe Smart Meter Industry Revenue (Million) Forecast, by Application 2019 & 2032
- Table 44: Belgium Europe Smart Meter Industry Volume (K Unit) Forecast, by Application 2019 & 2032
- Table 45: Sweden Europe Smart Meter Industry Revenue (Million) Forecast, by Application 2019 & 2032
- Table 46: Sweden Europe Smart Meter Industry Volume (K Unit) Forecast, by Application 2019 & 2032
- Table 47: Norway Europe Smart Meter Industry Revenue (Million) Forecast, by Application 2019 & 2032
- Table 48: Norway Europe Smart Meter Industry Volume (K Unit) Forecast, by Application 2019 & 2032
- Table 49: Poland Europe Smart Meter Industry Revenue (Million) Forecast, by Application 2019 & 2032
- Table 50: Poland Europe Smart Meter Industry Volume (K Unit) Forecast, by Application 2019 & 2032
- Table 51: Denmark Europe Smart Meter Industry Revenue (Million) Forecast, by Application 2019 & 2032
- Table 52: Denmark Europe Smart Meter Industry Volume (K Unit) Forecast, by Application 2019 & 2032
Frequently Asked Questions
1. What is the projected Compound Annual Growth Rate (CAGR) of the Europe Smart Meter Industry?
The projected CAGR is approximately 12.18%.
2. Which companies are prominent players in the Europe Smart Meter Industry?
Key companies in the market include Itron Inc, Badger Meter Inc, Zenner International GmbH & Co KG, Sensus (Xylem Inc ), Elster Group GmbH (Honeywell International Inc), Kamstrup A/S, Apator SA, Arad Group, Diehl Stiftung & Co KG, Landis+ GYR Group AG, Ningbo Sanxing Electric Co Ltd, AEM, General Electric Company.
3. What are the main segments of the Europe Smart Meter Industry?
The market segments include Type of Meter (Revenue and Unit Shipments), End User.
4. Can you provide details about the market size?
The market size is estimated to be USD 6.71 Million as of 2022.
5. What are some drivers contributing to market growth?
Increased Investments in Smart Grid Projects; Growth in Smart City Deployment; Supportive Government Regulations.
6. What are the notable trends driving market growth?
Increased investments in smart grid projects in expected to drive the market growth.
7. Are there any restraints impacting market growth?
High Costs and Security Concerns; Integration Difficulties with Smart Meters.
8. Can you provide examples of recent developments in the market?
December 2022: Trilliant, a leading provider of solutions for advanced metering infrastructure (AMI), smart cities, smart grid, and IIoT, announced the selection of its UK division, Trilliant Networks Operations (UK) Ltd., as one of the suppliers to provide smart meters to support the rollout of Ireland’s National Smart Metering Programme (NSMP) by ESB Networks. The program aims to help customers manage their energy use, save money, and lower their carbon footprint.
9. What pricing options are available for accessing the report?
Pricing options include single-user, multi-user, and enterprise licenses priced at USD 3800, USD 4500, and USD 5800 respectively.
10. Is the market size provided in terms of value or volume?
The market size is provided in terms of value, measured in Million and volume, measured in K Unit.
11. Are there any specific market keywords associated with the report?
Yes, the market keyword associated with the report is "Europe Smart Meter Industry," which aids in identifying and referencing the specific market segment covered.
12. How do I determine which pricing option suits my needs best?
The pricing options vary based on user requirements and access needs. Individual users may opt for single-user licenses, while businesses requiring broader access may choose multi-user or enterprise licenses for cost-effective access to the report.
13. Are there any additional resources or data provided in the Europe Smart Meter Industry report?
While the report offers comprehensive insights, it's advisable to review the specific contents or supplementary materials provided to ascertain if additional resources or data are available.
14. How can I stay updated on further developments or reports in the Europe Smart Meter Industry?
To stay informed about further developments, trends, and reports in the Europe Smart Meter Industry, consider subscribing to industry newsletters, following relevant companies and organizations, or regularly checking reputable industry news sources and publications.
Methodology
Step 1 - Identification of Relevant Samples Size from Population Database


Step 2 - Approaches for Defining Global Market Size (Value, Volume* & Price*)

Note*: In applicable scenarios
Step 3 - Data Sources
Primary Research
- Web Analytics
- Survey Reports
- Research Institute
- Latest Research Reports
- Opinion Leaders
Secondary Research
- Annual Reports
- White Paper
- Latest Press Release
- Industry Association
- Paid Database
- Investor Presentations

Step 4 - Data Triangulation
Involves using different sources of information in order to increase the validity of a study
These sources are likely to be stakeholders in a program - participants, other researchers, program staff, other community members, and so on.
Then we put all data in single framework & apply various statistical tools to find out the dynamic on the market.
During the analysis stage, feedback from the stakeholder groups would be compared to determine areas of agreement as well as areas of divergence
