

Key Insights
The Middle East and Africa (MEA) fertilizers market, valued at approximately $XX million in 2025, is projected to experience robust growth, driven by a Compound Annual Growth Rate (CAGR) of 3.74% from 2025 to 2033. This expansion is fueled by several key factors. Firstly, the increasing demand for food security across the region necessitates higher agricultural yields, leading to increased fertilizer consumption. Secondly, government initiatives promoting agricultural modernization and investment in irrigation infrastructure are significantly boosting fertilizer uptake. The rising adoption of advanced farming techniques like fertigation is further accelerating market growth. Finally, the diversification of crops, particularly in horticultural segments, contributes to the demand for specialized fertilizers tailored to specific crop needs. However, challenges persist. Fluctuations in global commodity prices, especially those of raw materials used in fertilizer production, can impact market stability. Furthermore, climate change effects like erratic rainfall patterns and droughts pose significant risks to agricultural production and fertilizer demand. The market segmentation reveals that complex fertilizers hold a larger market share compared to straight fertilizers, while Nigeria and South Africa represent significant regional markets within MEA. Conventional fertilizers dominate the form segment, though specialty fertilizers are experiencing growth. Fertigation application is steadily gaining traction.
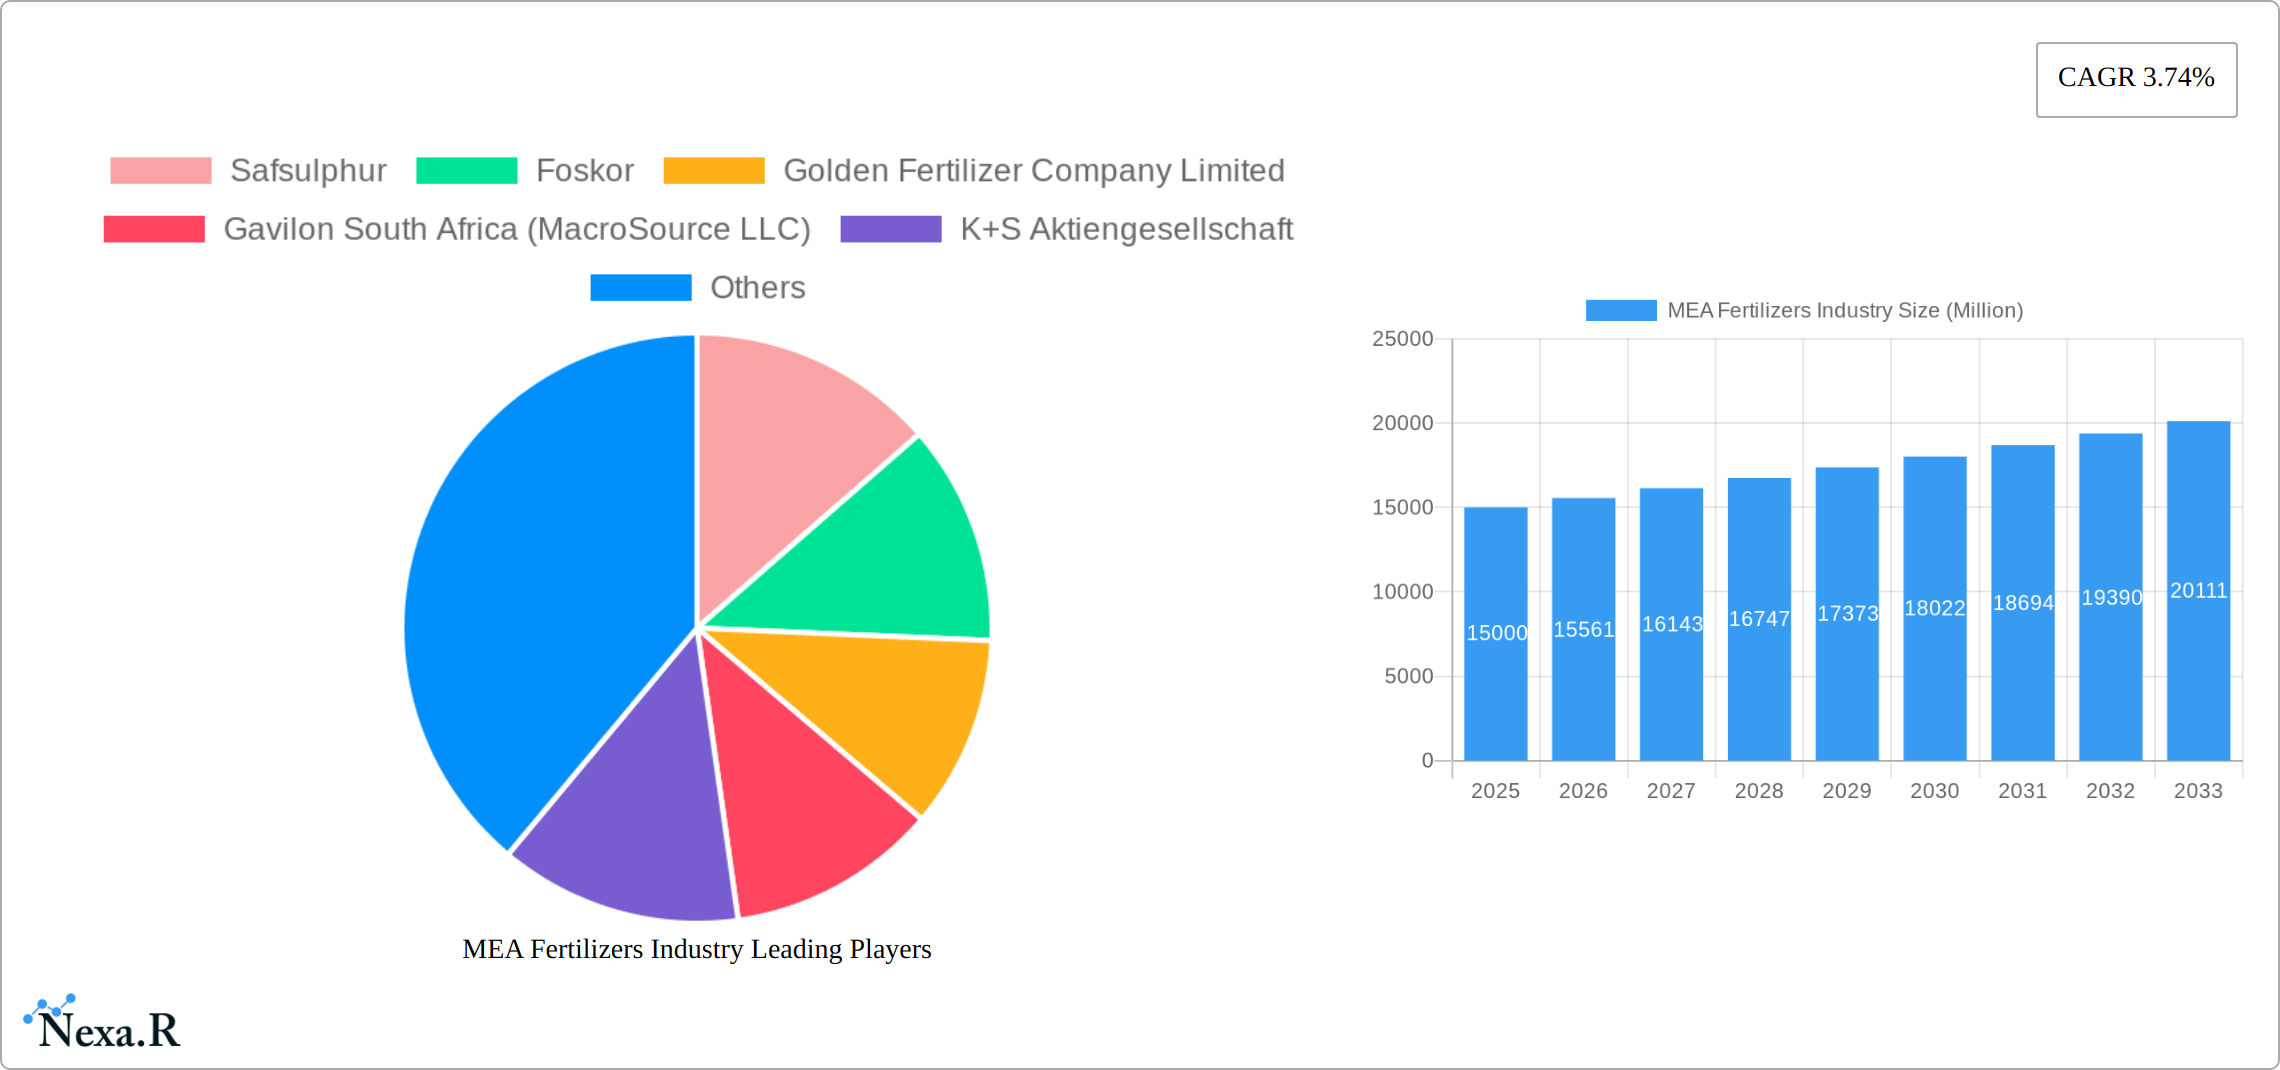
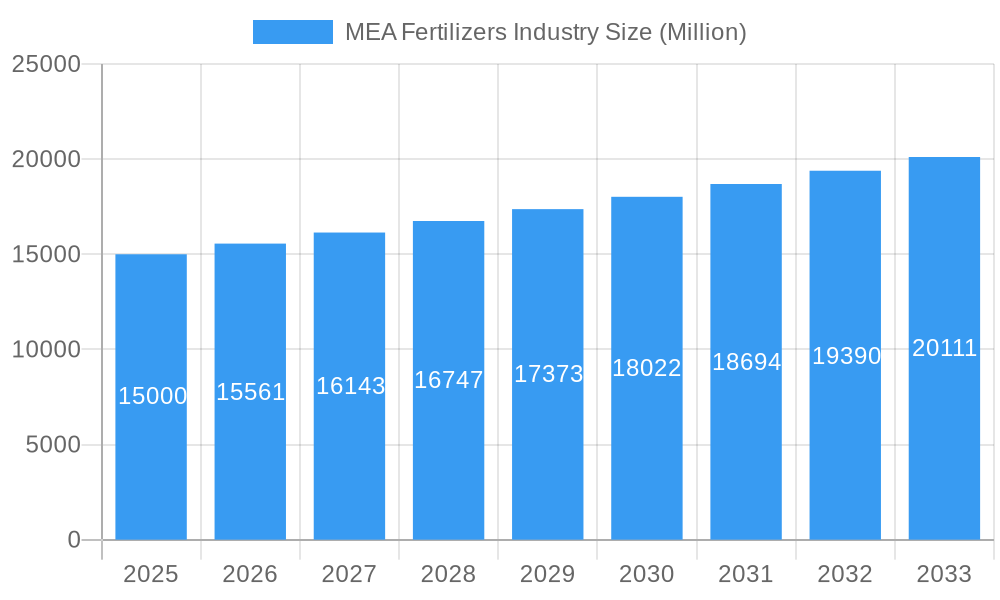
MEA Fertilizers Industry Market Size (In Billion)
The market is highly competitive, with key players including Safsulphur, Foskor, Golden Fertilizer Company Limited, and international giants like Yara International and ICL Group. These companies are actively engaged in product innovation, strategic partnerships, and expansion initiatives to cater to the evolving needs of the MEA agricultural sector. The forecast period (2025-2033) anticipates continued growth, although the rate might fluctuate based on global economic conditions and regional agricultural policies. Specific regional growth will vary based on factors such as government support for agriculture, irrigation infrastructure development, and the specific needs of individual crop types within each country. The European market, while not the focus of this report, provides a benchmark for advanced fertilizer usage trends, which could influence adoption in the MEA region over time. The historical period (2019-2024) likely showed variations reflecting global commodity prices and regional weather patterns.
MEA Fertilizers Industry Company Market Share
MEA Fertilizers Industry Market Report: 2019-2033
This comprehensive report provides a detailed analysis of the Middle East and Africa (MEA) fertilizers industry, encompassing market dynamics, growth trends, regional performance, and key players. Covering the period from 2019 to 2033, with a base year of 2025, this report is an essential resource for industry professionals, investors, and stakeholders seeking to understand this dynamic market. The report segments the market by type (complex, straight), country (Nigeria, Saudi Arabia, South Africa, Turkey, Rest of Middle East & Africa), form (conventional, specialty), application mode (fertigation, foliar, soil), and crop type (field crops, horticultural crops, turf & ornamental).
MEA Fertilizers Industry Market Dynamics & Structure
The MEA fertilizers market is characterized by a moderately concentrated landscape with several multinational corporations and regional players competing. Market share distribution varies significantly across countries, with South Africa and Nigeria holding the largest shares. Technological innovation is a key driver, with companies investing in improved formulations, controlled-release technologies, and precision agriculture solutions. However, access to advanced technologies and skilled labor presents an innovation barrier for some regions. Regulatory frameworks vary across countries, impacting fertilizer production, distribution, and usage. Substitutes such as organic fertilizers and bio-stimulants are gaining traction, though conventional fertilizers still dominate. The market is influenced by fluctuating agricultural practices, changing end-user demographics (including the rise of large-scale farming operations), and increasing M&A activity.
- Market Concentration: Moderately concentrated, with a few dominant players and numerous smaller regional companies. The top 5 players hold approximately xx% market share in 2025.
- Technological Innovation: Focus on efficiency gains and sustainable practices, particularly in nitrogen and phosphate fertilizers. However, digitalization and precision agriculture are still nascent in some regions.
- Regulatory Framework: Varies across countries, influencing fertilizer quality standards, import/export regulations, and environmental compliance.
- Competitive Substitutes: Organic fertilizers and bio-stimulants are emerging as competitive alternatives, although conventional fertilizers maintain a dominant position.
- M&A Activity: Significant increase in merger and acquisition activity in recent years, reflecting consolidation and expansion strategies within the industry. The total value of M&A deals in 2024 was estimated at xx Million.
MEA Fertilizers Industry Growth Trends & Insights
The MEA fertilizers market experienced robust growth during the historical period (2019-2024), driven by rising agricultural output, population growth, and increasing demand for food security. The market size is projected to grow at a Compound Annual Growth Rate (CAGR) of xx% from 2025 to 2033, reaching xx Million by 2033. This growth is attributable to several factors, including government initiatives to boost agricultural productivity, investments in irrigation infrastructure, and the growing adoption of modern farming techniques. However, factors such as climate change and water scarcity pose significant challenges to long-term growth. Technological disruptions such as precision farming and the utilization of data analytics are expected to increase efficiency, improve yields and reshape consumer behavior by promoting sustainable agricultural practices. Consumer behavior is shifting towards premium fertilizers with enhanced efficiency, and environmentally sustainable options.
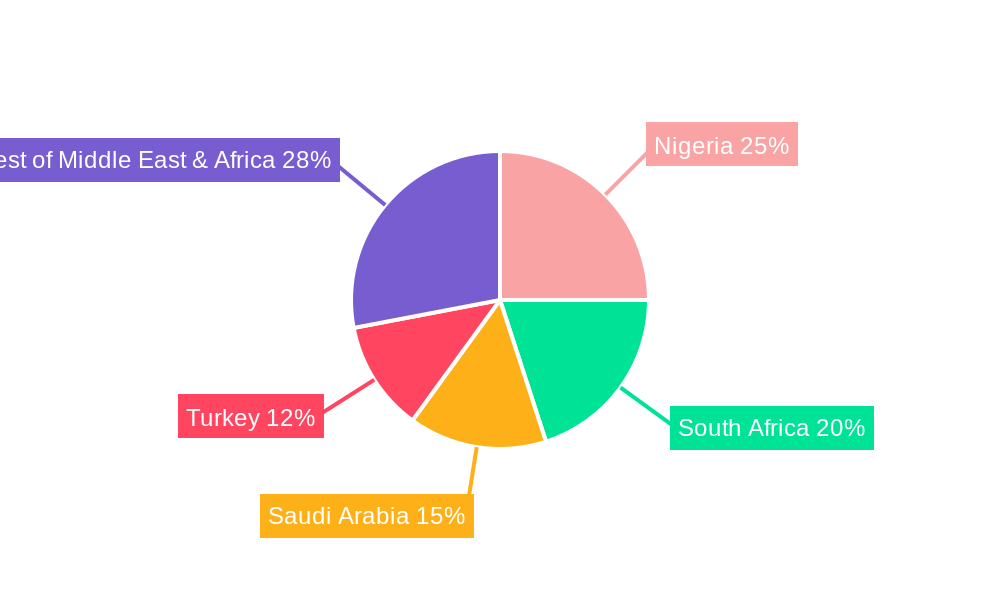
Dominant Regions, Countries, or Segments in MEA Fertilizers Industry
South Africa is currently the dominant market in the MEA region, driven by its advanced agricultural sector, well-established infrastructure, and favorable government policies. Nigeria presents significant growth potential due to its large agricultural sector and expanding population. The "Complex" fertilizer type holds the largest market share, primarily owing to its wider nutrient profile, catering to diverse crop needs. The conventional fertilizer segment dominates owing to its cost-effectiveness. Soil application is the prevalent application mode, reflecting prevailing agricultural practices. Field crops account for the largest share of fertilizer consumption, driven by the production of cereals, pulses, and oilseeds.
- Key Drivers for South Africa: Established agricultural infrastructure, government support for agricultural modernization, access to technology.
- Key Drivers for Nigeria: Growing population, increasing demand for food, expansion of irrigated agriculture, government investments in agricultural development.
- Key Drivers for Complex Fertilizers: Broader nutrient profile, suitability for various crops, improved efficiency, increased crop yields.
- Key Drivers for Conventional Fertilizers: Cost-effectiveness, widespread availability, established distribution networks.
- Key Drivers for Soil Application: Established practice, ease of application, cost-effectiveness.
- Key Drivers for Field Crops: High demand for cereals, pulses, and oilseeds; significant contribution to food security.
MEA Fertilizers Industry Product Landscape
The MEA fertilizers market showcases a diverse product portfolio, ranging from traditional, conventional fertilizers to advanced formulations tailored for specific crops and soil conditions. A significant trend is the rise of controlled-release fertilizers, enhancing nutrient use efficiency and minimizing environmental impact. The incorporation of micronutrients and biostimulants further boosts fertilizer efficacy. Key selling points emphasize improved efficiency, reduced environmental footprint, simplified application methods, and specialized blends addressing diverse agricultural needs. This includes a growing segment of organic and bio-based fertilizers responding to increasing consumer and regulatory demand for sustainable agricultural practices.
Key Drivers, Barriers & Challenges in MEA Fertilizers Industry
Key Drivers: Rising agricultural output, growing population, increasing demand for food security, government support for agriculture, increasing adoption of modern farming techniques. Examples include policy initiatives like subsidies and training programs for farmers, in addition to investments in irrigation infrastructure and agricultural research.
Key Challenges: Fluctuating commodity prices impacting profitability, competition from organic alternatives, climate change and water scarcity (impact on crop yields and fertilizer efficiency), limited access to advanced technology and training, logistics and infrastructure limitations. For instance, inefficient transportation networks can increase distribution costs and decrease overall affordability.
Emerging Opportunities in MEA Fertilizers Industry
Several compelling opportunities are shaping the MEA fertilizers landscape. The demand for specialized fertilizers designed for specific crop requirements and soil types is surging. The market for organic and bio-based fertilizers is experiencing significant expansion, driven by a growing awareness of environmental sustainability. Precision agriculture is gaining traction, facilitated by the integration of smart farming technologies. Furthermore, the adoption of sustainable agricultural practices is accelerating. Untapped potential exists in sub-Saharan Africa, where improved agricultural productivity offers substantial growth prospects. This includes opportunities to provide affordable and effective fertilizer solutions to smallholder farmers.
Growth Accelerators in the MEA Fertilizers Industry Industry
Technological advancements driving efficiency and sustainability, strategic collaborations among fertilizer producers, technology providers, and agricultural companies, and expansion into high-growth markets and regions are key catalysts for long-term growth. This includes the development of customized fertilizer solutions for specific crops and soil conditions, which optimize yields and reduce waste.
Key Players Shaping the MEA Fertilizers Industry Market
- Safsulphur
- Foskor
- Golden Fertilizer Company Limited
- Gavilon South Africa (MacroSource LLC)
- K+S Aktiengesellschaft
- Unikeyterra Chemical
- SABIC Agri-Nutrients Co
- Yara International AS
- ICL Group Ltd
- Kynoch Fertilizer
Notable Milestones in MEA Fertilizers Industry Sector
- April 2023: SABIC Agri-Nutrients Company acquired a 49% stake in ETG Inputs Holdco Limited for USD 320 million, significantly expanding its value chain integration and market reach.
- April 2023: K+S acquired a 75% share of Industrial Commodities Holdings (Pty) Ltd's fertilizer business, strengthening its presence in Southern and Eastern Africa, forming FertivPty Ltd. and enhancing its distribution network in the region.
- January 2023: ICL partnered with General Mills, securing a long-term supply agreement for specialty phosphate solutions, demonstrating the increasing demand for high-quality, sustainable fertilizer solutions and focusing on international growth opportunities.
In-Depth MEA Fertilizers Industry Market Outlook
The MEA fertilizers market is projected for sustained growth, fueled by technological advancements, supportive government policies promoting sustainable agriculture, and the widespread adoption of modern farming practices. Strategic partnerships and substantial investments in research and development are crucial for driving further market expansion and innovation. The increasing emphasis on sustainability and environmental protection creates fertile ground for the development and adoption of more efficient and eco-friendly fertilizers, including bio-fertilizers and other sustainable alternatives. The market presents considerable potential for future expansion, particularly in regions with high agricultural potential and rapidly growing populations. This includes addressing challenges related to food security and improving agricultural yields in less-developed areas.
MEA Fertilizers Industry Segmentation
- 1. Production Analysis
- 2. Consumption Analysis
- 3. Import Market Analysis (Value & Volume)
- 4. Export Market Analysis (Value & Volume)
- 5. Price Trend Analysis
MEA Fertilizers Industry Segmentation By Geography
-
1. North America
- 1.1. United States
- 1.2. Canada
- 1.3. Mexico
-
2. South America
- 2.1. Brazil
- 2.2. Argentina
- 2.3. Rest of South America
-
3. Europe
- 3.1. United Kingdom
- 3.2. Germany
- 3.3. France
- 3.4. Italy
- 3.5. Spain
- 3.6. Russia
- 3.7. Benelux
- 3.8. Nordics
- 3.9. Rest of Europe
-
4. Middle East & Africa
- 4.1. Turkey
- 4.2. Israel
- 4.3. GCC
- 4.4. North Africa
- 4.5. South Africa
- 4.6. Rest of Middle East & Africa
-
5. Asia Pacific
- 5.1. China
- 5.2. India
- 5.3. Japan
- 5.4. South Korea
- 5.5. ASEAN
- 5.6. Oceania
- 5.7. Rest of Asia Pacific
MEA Fertilizers Industry Regional Market Share
Geographic Coverage of MEA Fertilizers Industry
MEA Fertilizers Industry REPORT HIGHLIGHTS
| Aspects | Details |
|---|---|
| Study Period | 2020-2034 |
| Base Year | 2025 |
| Estimated Year | 2026 |
| Forecast Period | 2026-2034 |
| Historical Period | 2020-2025 |
| Growth Rate | CAGR of 3.74% from 2020-2034 |
| Segmentation |
|
Table of Contents
- 1. Introduction
- 1.1. Research Scope
- 1.2. Market Segmentation
- 1.3. Research Objective
- 1.4. Definitions and Assumptions
- 2. Executive Summary
- 2.1. Market Snapshot
- 3. Market Dynamics
- 3.1. Market Drivers
- 3.2. Market Restrains
- 3.3. Market Trends
- 3.4. Market Opportunities
- 4. Market Factor Analysis
- 4.1. Porters Five Forces
- 4.1.1. Bargaining Power of Suppliers
- 4.1.2. Bargaining Power of Buyers
- 4.1.3. Threat of New Entrants
- 4.1.4. Threat of Substitutes
- 4.1.5. Competitive Rivalry
- 4.2. PESTEL analysis
- 4.3. BCG Analysis
- 4.3.1. Stars (High Growth, High Market Share)
- 4.3.2. Cash Cows (Low Growth, High Market Share)
- 4.3.3. Question Mark (High Growth, Low Market Share)
- 4.3.4. Dogs (Low Growth, Low Market Share)
- 4.4. Ansoff Matrix Analysis
- 4.5. Supply Chain Analysis
- 4.6. Regulatory Landscape
- 4.7. Current Market Potential and Opportunity Assessment (TAM–SAM–SOM Framework)
- 4.8. NRP Analyst Note
- 4.1. Porters Five Forces
- 5. Market Analysis, Insights and Forecast 2021-2033
- 5.1. Market Analysis, Insights and Forecast - by Production Analysis
- 5.2. Market Analysis, Insights and Forecast - by Consumption Analysis
- 5.3. Market Analysis, Insights and Forecast - by Import Market Analysis (Value & Volume)
- 5.4. Market Analysis, Insights and Forecast - by Export Market Analysis (Value & Volume)
- 5.5. Market Analysis, Insights and Forecast - by Price Trend Analysis
- 5.6. Market Analysis, Insights and Forecast - by Region
- 5.6.1. North America
- 5.6.2. South America
- 5.6.3. Europe
- 5.6.4. Middle East & Africa
- 5.6.5. Asia Pacific
- 6. Global MEA Fertilizers Industry Analysis, Insights and Forecast, 2021-2033
- 6.1. Market Analysis, Insights and Forecast - by Production Analysis
- 6.2. Market Analysis, Insights and Forecast - by Consumption Analysis
- 6.3. Market Analysis, Insights and Forecast - by Import Market Analysis (Value & Volume)
- 6.4. Market Analysis, Insights and Forecast - by Export Market Analysis (Value & Volume)
- 6.5. Market Analysis, Insights and Forecast - by Price Trend Analysis
- 7. North America MEA Fertilizers Industry Analysis, Insights and Forecast, 2020-2032
- 7.1. Market Analysis, Insights and Forecast - by Production Analysis
- 7.2. Market Analysis, Insights and Forecast - by Consumption Analysis
- 7.3. Market Analysis, Insights and Forecast - by Import Market Analysis (Value & Volume)
- 7.4. Market Analysis, Insights and Forecast - by Export Market Analysis (Value & Volume)
- 7.5. Market Analysis, Insights and Forecast - by Price Trend Analysis
- 8. South America MEA Fertilizers Industry Analysis, Insights and Forecast, 2020-2032
- 8.1. Market Analysis, Insights and Forecast - by Production Analysis
- 8.2. Market Analysis, Insights and Forecast - by Consumption Analysis
- 8.3. Market Analysis, Insights and Forecast - by Import Market Analysis (Value & Volume)
- 8.4. Market Analysis, Insights and Forecast - by Export Market Analysis (Value & Volume)
- 8.5. Market Analysis, Insights and Forecast - by Price Trend Analysis
- 9. Europe MEA Fertilizers Industry Analysis, Insights and Forecast, 2020-2032
- 9.1. Market Analysis, Insights and Forecast - by Production Analysis
- 9.2. Market Analysis, Insights and Forecast - by Consumption Analysis
- 9.3. Market Analysis, Insights and Forecast - by Import Market Analysis (Value & Volume)
- 9.4. Market Analysis, Insights and Forecast - by Export Market Analysis (Value & Volume)
- 9.5. Market Analysis, Insights and Forecast - by Price Trend Analysis
- 10. Middle East & Africa MEA Fertilizers Industry Analysis, Insights and Forecast, 2020-2032
- 10.1. Market Analysis, Insights and Forecast - by Production Analysis
- 10.2. Market Analysis, Insights and Forecast - by Consumption Analysis
- 10.3. Market Analysis, Insights and Forecast - by Import Market Analysis (Value & Volume)
- 10.4. Market Analysis, Insights and Forecast - by Export Market Analysis (Value & Volume)
- 10.5. Market Analysis, Insights and Forecast - by Price Trend Analysis
- 11. Asia Pacific MEA Fertilizers Industry Analysis, Insights and Forecast, 2020-2032
- 11.1. Market Analysis, Insights and Forecast - by Production Analysis
- 11.2. Market Analysis, Insights and Forecast - by Consumption Analysis
- 11.3. Market Analysis, Insights and Forecast - by Import Market Analysis (Value & Volume)
- 11.4. Market Analysis, Insights and Forecast - by Export Market Analysis (Value & Volume)
- 11.5. Market Analysis, Insights and Forecast - by Price Trend Analysis
- 12. Competitive Analysis
- 12.1. Company Profiles
- 12.1.1 Safsulphur
- 12.1.1.1. Company Overview
- 12.1.1.2. Products
- 12.1.1.3. Company Financials
- 12.1.1.4. SWOT Analysis
- 12.1.2 Foskor
- 12.1.2.1. Company Overview
- 12.1.2.2. Products
- 12.1.2.3. Company Financials
- 12.1.2.4. SWOT Analysis
- 12.1.3 Golden Fertilizer Company Limited
- 12.1.3.1. Company Overview
- 12.1.3.2. Products
- 12.1.3.3. Company Financials
- 12.1.3.4. SWOT Analysis
- 12.1.4 Gavilon South Africa (MacroSource LLC)
- 12.1.4.1. Company Overview
- 12.1.4.2. Products
- 12.1.4.3. Company Financials
- 12.1.4.4. SWOT Analysis
- 12.1.5 K+S Aktiengesellschaft
- 12.1.5.1. Company Overview
- 12.1.5.2. Products
- 12.1.5.3. Company Financials
- 12.1.5.4. SWOT Analysis
- 12.1.6 Unikeyterra Chemical
- 12.1.6.1. Company Overview
- 12.1.6.2. Products
- 12.1.6.3. Company Financials
- 12.1.6.4. SWOT Analysis
- 12.1.7 SABIC Agri-Nutrients Co
- 12.1.7.1. Company Overview
- 12.1.7.2. Products
- 12.1.7.3. Company Financials
- 12.1.7.4. SWOT Analysis
- 12.1.8 Yara International AS
- 12.1.8.1. Company Overview
- 12.1.8.2. Products
- 12.1.8.3. Company Financials
- 12.1.8.4. SWOT Analysis
- 12.1.9 ICL Group Ltd
- 12.1.9.1. Company Overview
- 12.1.9.2. Products
- 12.1.9.3. Company Financials
- 12.1.9.4. SWOT Analysis
- 12.1.10 Kynoch Fertilizer
- 12.1.10.1. Company Overview
- 12.1.10.2. Products
- 12.1.10.3. Company Financials
- 12.1.10.4. SWOT Analysis
- 12.1.1 Safsulphur
- 12.2. Market Entropy
- 12.2.1 Company's Key Areas Served
- 12.2.2 Recent Developments
- 12.3. Company Market Share Analysis 2025
- 12.3.1 Top 5 Companies Market Share Analysis
- 12.3.2 Top 3 Companies Market Share Analysis
- 12.4. List of Potential Customers
- 13. Research Methodology
List of Figures
- Figure 1: Global MEA Fertilizers Industry Revenue Breakdown (Million, %) by Region 2025 & 2033
- Figure 2: North America MEA Fertilizers Industry Revenue (Million), by Production Analysis 2025 & 2033
- Figure 3: North America MEA Fertilizers Industry Revenue Share (%), by Production Analysis 2025 & 2033
- Figure 4: North America MEA Fertilizers Industry Revenue (Million), by Consumption Analysis 2025 & 2033
- Figure 5: North America MEA Fertilizers Industry Revenue Share (%), by Consumption Analysis 2025 & 2033
- Figure 6: North America MEA Fertilizers Industry Revenue (Million), by Import Market Analysis (Value & Volume) 2025 & 2033
- Figure 7: North America MEA Fertilizers Industry Revenue Share (%), by Import Market Analysis (Value & Volume) 2025 & 2033
- Figure 8: North America MEA Fertilizers Industry Revenue (Million), by Export Market Analysis (Value & Volume) 2025 & 2033
- Figure 9: North America MEA Fertilizers Industry Revenue Share (%), by Export Market Analysis (Value & Volume) 2025 & 2033
- Figure 10: North America MEA Fertilizers Industry Revenue (Million), by Price Trend Analysis 2025 & 2033
- Figure 11: North America MEA Fertilizers Industry Revenue Share (%), by Price Trend Analysis 2025 & 2033
- Figure 12: North America MEA Fertilizers Industry Revenue (Million), by Country 2025 & 2033
- Figure 13: North America MEA Fertilizers Industry Revenue Share (%), by Country 2025 & 2033
- Figure 14: South America MEA Fertilizers Industry Revenue (Million), by Production Analysis 2025 & 2033
- Figure 15: South America MEA Fertilizers Industry Revenue Share (%), by Production Analysis 2025 & 2033
- Figure 16: South America MEA Fertilizers Industry Revenue (Million), by Consumption Analysis 2025 & 2033
- Figure 17: South America MEA Fertilizers Industry Revenue Share (%), by Consumption Analysis 2025 & 2033
- Figure 18: South America MEA Fertilizers Industry Revenue (Million), by Import Market Analysis (Value & Volume) 2025 & 2033
- Figure 19: South America MEA Fertilizers Industry Revenue Share (%), by Import Market Analysis (Value & Volume) 2025 & 2033
- Figure 20: South America MEA Fertilizers Industry Revenue (Million), by Export Market Analysis (Value & Volume) 2025 & 2033
- Figure 21: South America MEA Fertilizers Industry Revenue Share (%), by Export Market Analysis (Value & Volume) 2025 & 2033
- Figure 22: South America MEA Fertilizers Industry Revenue (Million), by Price Trend Analysis 2025 & 2033
- Figure 23: South America MEA Fertilizers Industry Revenue Share (%), by Price Trend Analysis 2025 & 2033
- Figure 24: South America MEA Fertilizers Industry Revenue (Million), by Country 2025 & 2033
- Figure 25: South America MEA Fertilizers Industry Revenue Share (%), by Country 2025 & 2033
- Figure 26: Europe MEA Fertilizers Industry Revenue (Million), by Production Analysis 2025 & 2033
- Figure 27: Europe MEA Fertilizers Industry Revenue Share (%), by Production Analysis 2025 & 2033
- Figure 28: Europe MEA Fertilizers Industry Revenue (Million), by Consumption Analysis 2025 & 2033
- Figure 29: Europe MEA Fertilizers Industry Revenue Share (%), by Consumption Analysis 2025 & 2033
- Figure 30: Europe MEA Fertilizers Industry Revenue (Million), by Import Market Analysis (Value & Volume) 2025 & 2033
- Figure 31: Europe MEA Fertilizers Industry Revenue Share (%), by Import Market Analysis (Value & Volume) 2025 & 2033
- Figure 32: Europe MEA Fertilizers Industry Revenue (Million), by Export Market Analysis (Value & Volume) 2025 & 2033
- Figure 33: Europe MEA Fertilizers Industry Revenue Share (%), by Export Market Analysis (Value & Volume) 2025 & 2033
- Figure 34: Europe MEA Fertilizers Industry Revenue (Million), by Price Trend Analysis 2025 & 2033
- Figure 35: Europe MEA Fertilizers Industry Revenue Share (%), by Price Trend Analysis 2025 & 2033
- Figure 36: Europe MEA Fertilizers Industry Revenue (Million), by Country 2025 & 2033
- Figure 37: Europe MEA Fertilizers Industry Revenue Share (%), by Country 2025 & 2033
- Figure 38: Middle East & Africa MEA Fertilizers Industry Revenue (Million), by Production Analysis 2025 & 2033
- Figure 39: Middle East & Africa MEA Fertilizers Industry Revenue Share (%), by Production Analysis 2025 & 2033
- Figure 40: Middle East & Africa MEA Fertilizers Industry Revenue (Million), by Consumption Analysis 2025 & 2033
- Figure 41: Middle East & Africa MEA Fertilizers Industry Revenue Share (%), by Consumption Analysis 2025 & 2033
- Figure 42: Middle East & Africa MEA Fertilizers Industry Revenue (Million), by Import Market Analysis (Value & Volume) 2025 & 2033
- Figure 43: Middle East & Africa MEA Fertilizers Industry Revenue Share (%), by Import Market Analysis (Value & Volume) 2025 & 2033
- Figure 44: Middle East & Africa MEA Fertilizers Industry Revenue (Million), by Export Market Analysis (Value & Volume) 2025 & 2033
- Figure 45: Middle East & Africa MEA Fertilizers Industry Revenue Share (%), by Export Market Analysis (Value & Volume) 2025 & 2033
- Figure 46: Middle East & Africa MEA Fertilizers Industry Revenue (Million), by Price Trend Analysis 2025 & 2033
- Figure 47: Middle East & Africa MEA Fertilizers Industry Revenue Share (%), by Price Trend Analysis 2025 & 2033
- Figure 48: Middle East & Africa MEA Fertilizers Industry Revenue (Million), by Country 2025 & 2033
- Figure 49: Middle East & Africa MEA Fertilizers Industry Revenue Share (%), by Country 2025 & 2033
- Figure 50: Asia Pacific MEA Fertilizers Industry Revenue (Million), by Production Analysis 2025 & 2033
- Figure 51: Asia Pacific MEA Fertilizers Industry Revenue Share (%), by Production Analysis 2025 & 2033
- Figure 52: Asia Pacific MEA Fertilizers Industry Revenue (Million), by Consumption Analysis 2025 & 2033
- Figure 53: Asia Pacific MEA Fertilizers Industry Revenue Share (%), by Consumption Analysis 2025 & 2033
- Figure 54: Asia Pacific MEA Fertilizers Industry Revenue (Million), by Import Market Analysis (Value & Volume) 2025 & 2033
- Figure 55: Asia Pacific MEA Fertilizers Industry Revenue Share (%), by Import Market Analysis (Value & Volume) 2025 & 2033
- Figure 56: Asia Pacific MEA Fertilizers Industry Revenue (Million), by Export Market Analysis (Value & Volume) 2025 & 2033
- Figure 57: Asia Pacific MEA Fertilizers Industry Revenue Share (%), by Export Market Analysis (Value & Volume) 2025 & 2033
- Figure 58: Asia Pacific MEA Fertilizers Industry Revenue (Million), by Price Trend Analysis 2025 & 2033
- Figure 59: Asia Pacific MEA Fertilizers Industry Revenue Share (%), by Price Trend Analysis 2025 & 2033
- Figure 60: Asia Pacific MEA Fertilizers Industry Revenue (Million), by Country 2025 & 2033
- Figure 61: Asia Pacific MEA Fertilizers Industry Revenue Share (%), by Country 2025 & 2033
List of Tables
- Table 1: Global MEA Fertilizers Industry Revenue Million Forecast, by Production Analysis 2020 & 2033
- Table 2: Global MEA Fertilizers Industry Revenue Million Forecast, by Consumption Analysis 2020 & 2033
- Table 3: Global MEA Fertilizers Industry Revenue Million Forecast, by Import Market Analysis (Value & Volume) 2020 & 2033
- Table 4: Global MEA Fertilizers Industry Revenue Million Forecast, by Export Market Analysis (Value & Volume) 2020 & 2033
- Table 5: Global MEA Fertilizers Industry Revenue Million Forecast, by Price Trend Analysis 2020 & 2033
- Table 6: Global MEA Fertilizers Industry Revenue Million Forecast, by Region 2020 & 2033
- Table 7: Global MEA Fertilizers Industry Revenue Million Forecast, by Production Analysis 2020 & 2033
- Table 8: Global MEA Fertilizers Industry Revenue Million Forecast, by Consumption Analysis 2020 & 2033
- Table 9: Global MEA Fertilizers Industry Revenue Million Forecast, by Import Market Analysis (Value & Volume) 2020 & 2033
- Table 10: Global MEA Fertilizers Industry Revenue Million Forecast, by Export Market Analysis (Value & Volume) 2020 & 2033
- Table 11: Global MEA Fertilizers Industry Revenue Million Forecast, by Price Trend Analysis 2020 & 2033
- Table 12: Global MEA Fertilizers Industry Revenue Million Forecast, by Country 2020 & 2033
- Table 13: United States MEA Fertilizers Industry Revenue (Million) Forecast, by Application 2020 & 2033
- Table 14: Canada MEA Fertilizers Industry Revenue (Million) Forecast, by Application 2020 & 2033
- Table 15: Mexico MEA Fertilizers Industry Revenue (Million) Forecast, by Application 2020 & 2033
- Table 16: Global MEA Fertilizers Industry Revenue Million Forecast, by Production Analysis 2020 & 2033
- Table 17: Global MEA Fertilizers Industry Revenue Million Forecast, by Consumption Analysis 2020 & 2033
- Table 18: Global MEA Fertilizers Industry Revenue Million Forecast, by Import Market Analysis (Value & Volume) 2020 & 2033
- Table 19: Global MEA Fertilizers Industry Revenue Million Forecast, by Export Market Analysis (Value & Volume) 2020 & 2033
- Table 20: Global MEA Fertilizers Industry Revenue Million Forecast, by Price Trend Analysis 2020 & 2033
- Table 21: Global MEA Fertilizers Industry Revenue Million Forecast, by Country 2020 & 2033
- Table 22: Brazil MEA Fertilizers Industry Revenue (Million) Forecast, by Application 2020 & 2033
- Table 23: Argentina MEA Fertilizers Industry Revenue (Million) Forecast, by Application 2020 & 2033
- Table 24: Rest of South America MEA Fertilizers Industry Revenue (Million) Forecast, by Application 2020 & 2033
- Table 25: Global MEA Fertilizers Industry Revenue Million Forecast, by Production Analysis 2020 & 2033
- Table 26: Global MEA Fertilizers Industry Revenue Million Forecast, by Consumption Analysis 2020 & 2033
- Table 27: Global MEA Fertilizers Industry Revenue Million Forecast, by Import Market Analysis (Value & Volume) 2020 & 2033
- Table 28: Global MEA Fertilizers Industry Revenue Million Forecast, by Export Market Analysis (Value & Volume) 2020 & 2033
- Table 29: Global MEA Fertilizers Industry Revenue Million Forecast, by Price Trend Analysis 2020 & 2033
- Table 30: Global MEA Fertilizers Industry Revenue Million Forecast, by Country 2020 & 2033
- Table 31: United Kingdom MEA Fertilizers Industry Revenue (Million) Forecast, by Application 2020 & 2033
- Table 32: Germany MEA Fertilizers Industry Revenue (Million) Forecast, by Application 2020 & 2033
- Table 33: France MEA Fertilizers Industry Revenue (Million) Forecast, by Application 2020 & 2033
- Table 34: Italy MEA Fertilizers Industry Revenue (Million) Forecast, by Application 2020 & 2033
- Table 35: Spain MEA Fertilizers Industry Revenue (Million) Forecast, by Application 2020 & 2033
- Table 36: Russia MEA Fertilizers Industry Revenue (Million) Forecast, by Application 2020 & 2033
- Table 37: Benelux MEA Fertilizers Industry Revenue (Million) Forecast, by Application 2020 & 2033
- Table 38: Nordics MEA Fertilizers Industry Revenue (Million) Forecast, by Application 2020 & 2033
- Table 39: Rest of Europe MEA Fertilizers Industry Revenue (Million) Forecast, by Application 2020 & 2033
- Table 40: Global MEA Fertilizers Industry Revenue Million Forecast, by Production Analysis 2020 & 2033
- Table 41: Global MEA Fertilizers Industry Revenue Million Forecast, by Consumption Analysis 2020 & 2033
- Table 42: Global MEA Fertilizers Industry Revenue Million Forecast, by Import Market Analysis (Value & Volume) 2020 & 2033
- Table 43: Global MEA Fertilizers Industry Revenue Million Forecast, by Export Market Analysis (Value & Volume) 2020 & 2033
- Table 44: Global MEA Fertilizers Industry Revenue Million Forecast, by Price Trend Analysis 2020 & 2033
- Table 45: Global MEA Fertilizers Industry Revenue Million Forecast, by Country 2020 & 2033
- Table 46: Turkey MEA Fertilizers Industry Revenue (Million) Forecast, by Application 2020 & 2033
- Table 47: Israel MEA Fertilizers Industry Revenue (Million) Forecast, by Application 2020 & 2033
- Table 48: GCC MEA Fertilizers Industry Revenue (Million) Forecast, by Application 2020 & 2033
- Table 49: North Africa MEA Fertilizers Industry Revenue (Million) Forecast, by Application 2020 & 2033
- Table 50: South Africa MEA Fertilizers Industry Revenue (Million) Forecast, by Application 2020 & 2033
- Table 51: Rest of Middle East & Africa MEA Fertilizers Industry Revenue (Million) Forecast, by Application 2020 & 2033
- Table 52: Global MEA Fertilizers Industry Revenue Million Forecast, by Production Analysis 2020 & 2033
- Table 53: Global MEA Fertilizers Industry Revenue Million Forecast, by Consumption Analysis 2020 & 2033
- Table 54: Global MEA Fertilizers Industry Revenue Million Forecast, by Import Market Analysis (Value & Volume) 2020 & 2033
- Table 55: Global MEA Fertilizers Industry Revenue Million Forecast, by Export Market Analysis (Value & Volume) 2020 & 2033
- Table 56: Global MEA Fertilizers Industry Revenue Million Forecast, by Price Trend Analysis 2020 & 2033
- Table 57: Global MEA Fertilizers Industry Revenue Million Forecast, by Country 2020 & 2033
- Table 58: China MEA Fertilizers Industry Revenue (Million) Forecast, by Application 2020 & 2033
- Table 59: India MEA Fertilizers Industry Revenue (Million) Forecast, by Application 2020 & 2033
- Table 60: Japan MEA Fertilizers Industry Revenue (Million) Forecast, by Application 2020 & 2033
- Table 61: South Korea MEA Fertilizers Industry Revenue (Million) Forecast, by Application 2020 & 2033
- Table 62: ASEAN MEA Fertilizers Industry Revenue (Million) Forecast, by Application 2020 & 2033
- Table 63: Oceania MEA Fertilizers Industry Revenue (Million) Forecast, by Application 2020 & 2033
- Table 64: Rest of Asia Pacific MEA Fertilizers Industry Revenue (Million) Forecast, by Application 2020 & 2033
Frequently Asked Questions
1. What is the projected Compound Annual Growth Rate (CAGR) of the MEA Fertilizers Industry?
The projected CAGR is approximately 3.74%.
2. Which companies are prominent players in the MEA Fertilizers Industry?
Key companies in the market include Safsulphur, Foskor, Golden Fertilizer Company Limited, Gavilon South Africa (MacroSource LLC), K+S Aktiengesellschaft, Unikeyterra Chemical, SABIC Agri-Nutrients Co, Yara International AS, ICL Group Ltd, Kynoch Fertilizer.
3. What are the main segments of the MEA Fertilizers Industry?
The market segments include Production Analysis, Consumption Analysis, Import Market Analysis (Value & Volume), Export Market Analysis (Value & Volume), Price Trend Analysis.
4. Can you provide details about the market size?
The market size is estimated to be USD XX Million as of 2022.
5. What are some drivers contributing to market growth?
Need for Custom Product Development; Use of CROs for Regulatory Services.
6. What are the notable trends driving market growth?
OTHER KEY INDUSTRY TRENDS COVERED IN THE REPORT.
7. Are there any restraints impacting market growth?
Data and Cyber Security Concerns; Lack of Experts and Professionals in this Industry.
8. Can you provide examples of recent developments in the market?
April 2023: SABIC Agri-Nutrients Company acquired the ETC Group (ETG) with a 49% stake in the ETG Inputs Holdco Limited for a transaction value of USD 320 million. The agreement is part of SABIC Agri-Nutrients Company's strategy to integrate the value chain and distribution of agri-nutrients markets.April 2023: K+S has acquired a 75% share of the fertilizer business of South African trading company Industrial Commodities Holdings (Pty) Ltd (ICH). In addition to expanding the core business, K+S is strengthening its operations in southern and eastern Africa as a result of this acquisition. The newly acquired fertilizer business in the future to be operated in a joint venture, under the name of FertivPty Ltd.January 2023: ICL has entered into a strategic partnership agreement with General Mills, in which it will be the supplier of strategic specialty phosphate solutions to General Mills. The long-term agreement will also focus on international expansion.
9. What pricing options are available for accessing the report?
Pricing options include single-user, multi-user, and enterprise licenses priced at USD 3800, USD 4500, and USD 5800 respectively.
10. Is the market size provided in terms of value or volume?
The market size is provided in terms of value, measured in Million.
11. Are there any specific market keywords associated with the report?
Yes, the market keyword associated with the report is "MEA Fertilizers Industry," which aids in identifying and referencing the specific market segment covered.
12. How do I determine which pricing option suits my needs best?
The pricing options vary based on user requirements and access needs. Individual users may opt for single-user licenses, while businesses requiring broader access may choose multi-user or enterprise licenses for cost-effective access to the report.
13. Are there any additional resources or data provided in the MEA Fertilizers Industry report?
While the report offers comprehensive insights, it's advisable to review the specific contents or supplementary materials provided to ascertain if additional resources or data are available.
14. How can I stay updated on further developments or reports in the MEA Fertilizers Industry?
To stay informed about further developments, trends, and reports in the MEA Fertilizers Industry, consider subscribing to industry newsletters, following relevant companies and organizations, or regularly checking reputable industry news sources and publications.
Methodology
Step 1 - Identification of Relevant Samples Size from Population Database


Step 2 - Approaches for Defining Global Market Size (Value, Volume* & Price*)

Note*: In applicable scenarios
Step 3 - Data Sources
Primary Research
- Web Analytics
- Survey Reports
- Research Institute
- Latest Research Reports
- Opinion Leaders
Secondary Research
- Annual Reports
- White Paper
- Latest Press Release
- Industry Association
- Paid Database
- Investor Presentations

Step 4 - Data Triangulation
Involves using different sources of information in order to increase the validity of a study
These sources are likely to be stakeholders in a program - participants, other researchers, program staff, other community members, and so on.
Then we put all data in single framework & apply various statistical tools to find out the dynamic on the market.
During the analysis stage, feedback from the stakeholder groups would be compared to determine areas of agreement as well as areas of divergence