

Key Insights
The MEA Functional Beverages market, encompassing energy drinks, fortified juices, sports drinks, and dairy-based options, presents a dynamic landscape with significant growth potential. Driven by increasing health consciousness, rising disposable incomes, and a burgeoning young population, the market is projected to experience a robust expansion throughout the forecast period (2025-2033). The CAGR of 4.17% suggests a steady, albeit moderate, growth trajectory compared to other global regions. Key distribution channels include supermarkets/hypermarkets, pharmacies, and convenience stores, with online retail showing increasing penetration, mirroring global e-commerce trends. While the dominance of established players like Coca-Cola and PepsiCo is undeniable, the market also accommodates smaller, specialized brands capitalizing on niche consumer preferences, like those focusing on organic or locally sourced ingredients. Growth will be fueled by product innovation, including functional beverages targeting specific health needs (e.g., immunity boosting or enhanced athletic performance). However, challenges remain, including fluctuating raw material costs, stringent regulatory requirements for health claims, and consumer perception surrounding the sugar content of certain functional beverages. Competition amongst both local and international players will be intense and success will likely require strategic brand building, targeted marketing, and effective distribution strategies.
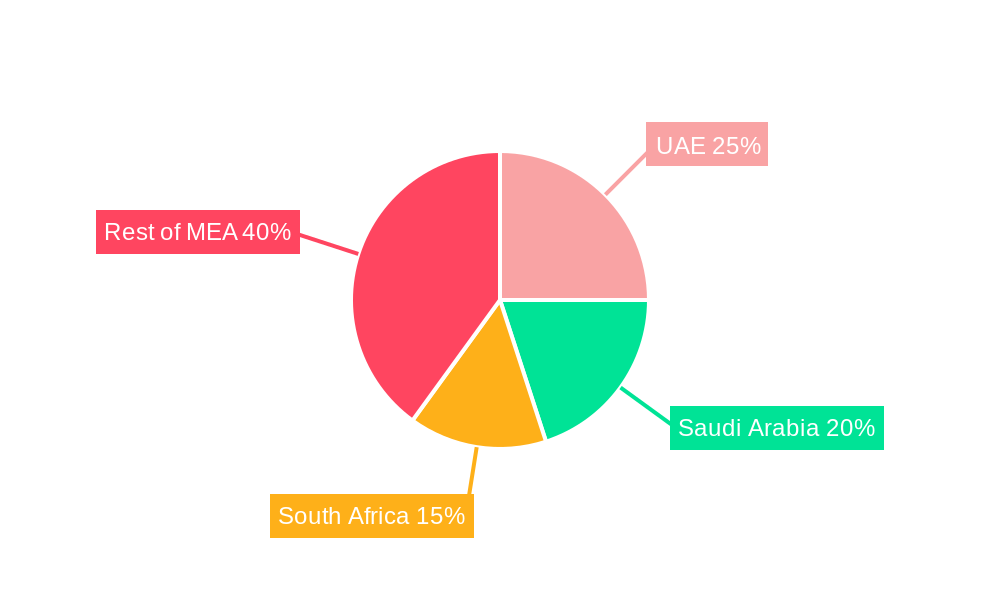
The regional disparity within MEA is noteworthy. Countries such as the UAE and Saudi Arabia, with their higher per capita incomes and established retail infrastructure, are expected to contribute significantly to the overall market value. South Africa and other developing nations in the region offer considerable, albeit more nuanced, opportunities as disposable incomes increase and consumer awareness of functional benefits grows. Growth in these nations will require tailored product development, considering local tastes, affordability, and distribution challenges. Addressing health concerns related to sugar content and artificial ingredients is critical for achieving long-term market success in this price-sensitive region. The success of functional beverage brands will depend on striking a balance between offering health benefits, appealing flavors, affordability, and sustainable sourcing practices.
MEA Functional Beverages Industry: A Comprehensive Market Report (2019-2033)
This comprehensive report provides a detailed analysis of the Middle East and Africa (MEA) functional beverages industry, encompassing market dynamics, growth trends, competitive landscape, and future outlook. The report covers the period from 2019 to 2033, with a focus on 2025 as the base and estimated year. It delves into key segments like energy drinks, fortified juices, and sports drinks, across various distribution channels, offering invaluable insights for industry professionals, investors, and strategists. The market size is presented in million units.
MEA Functional Beverages Industry Market Dynamics & Structure
This section analyzes the MEA functional beverage market's structure, focusing on market concentration, technological advancements, regulatory landscape, competitive substitutes, consumer demographics, and merger & acquisition (M&A) activity. The market is characterized by a mix of established multinational players and regional brands. Market concentration is moderate, with a few key players holding significant market share, while numerous smaller players compete within specific segments or geographic areas.
- Market Concentration: The top 5 players account for approximately xx% of the market share in 2024.
- Technological Innovation: Innovation is primarily driven by the demand for healthier and more functional beverages, leading to the development of novel formulations, natural ingredients, and enhanced packaging. However, innovation is challenged by high R&D costs and regulatory hurdles.
- Regulatory Framework: Varying regulatory frameworks across MEA countries create complexity for manufacturers. Regulations related to labeling, ingredients, and health claims significantly impact product development and market entry.
- Competitive Product Substitutes: The market faces competition from traditional beverages and other healthy alternatives, such as bottled water and fresh juices.
- End-User Demographics: The growing health-conscious population, rising disposable incomes, and increasing urbanization are key demographic factors driving demand. A significant portion of consumers are millennials and Gen Z, who are particularly receptive to innovative and functional beverages.
- M&A Trends: The industry has witnessed a moderate level of M&A activity in recent years, with larger players seeking to expand their portfolio and market reach. xx M&A deals were recorded between 2019 and 2024.
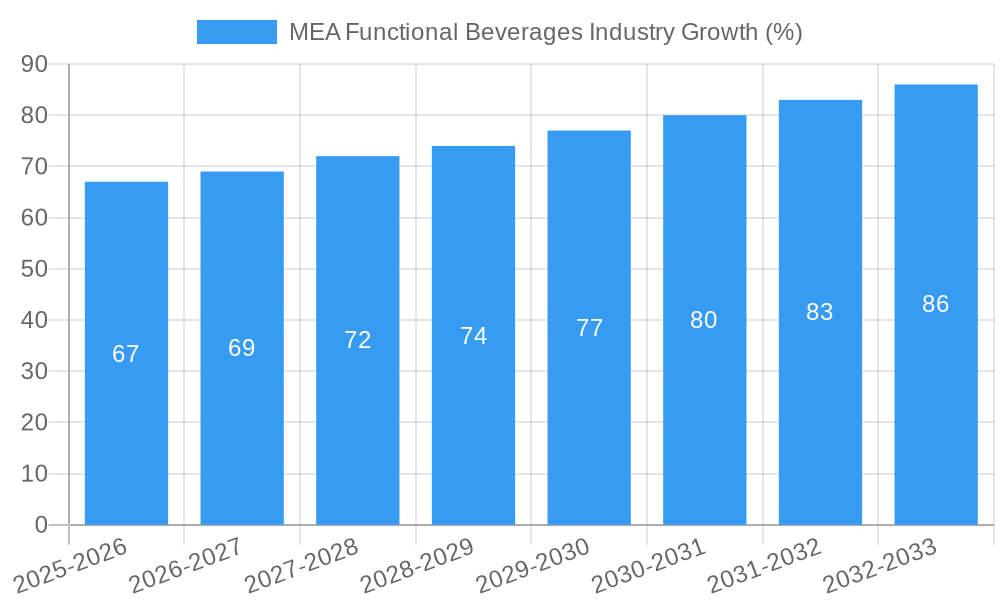
MEA Functional Beverages Industry Growth Trends & Insights
The MEA functional beverage market has witnessed significant growth during the historical period (2019-2024). This growth is propelled by rising health consciousness, increased disposable incomes, and changing consumer preferences toward healthier beverages. The market is expected to maintain a steady growth trajectory during the forecast period (2025-2033). Technological advancements, such as the development of new product formulations and innovative packaging, are further driving market expansion. Consumer behavior shifts towards premiumization and convenience are also influencing market growth.
- Market Size Evolution: The market size increased from xx million units in 2019 to xx million units in 2024, representing a CAGR of xx%.
- Adoption Rates: Adoption rates for functional beverages have been steadily increasing, driven by rising awareness of the health benefits associated with these products.
- Technological Disruptions: The introduction of new technologies in areas such as packaging and product formulation are enhancing product shelf life and creating more convenient options for consumers.
- Consumer Behavior Shifts: Consumers show a preference for natural ingredients, low sugar content, and products that support their health and wellness goals.
Dominant Regions, Countries, or Segments in MEA Functional Beverages Industry
The UAE and Saudi Arabia are the leading markets within the MEA region, contributing significantly to overall market growth. The supermarket/hypermarket channel dominates the distribution landscape, owing to its wide reach and established infrastructure. Energy drinks and sports drinks are the most popular product types due to their association with active lifestyles and enhanced performance.
- Leading Regions: The UAE and Saudi Arabia hold the largest market shares due to high disposable incomes and a strong focus on health and wellness.
- Leading Distribution Channel: Supermarket/Hypermarket accounts for the largest share (xx%), followed by convenience stores (xx%).
- Leading Product Types: Energy drinks (xx%) and sports drinks (xx%) dominate due to high consumer demand.
- Growth Drivers: Factors driving growth include rising health awareness, increasing disposable incomes, and government initiatives promoting healthy lifestyles.
MEA Functional Beverages Industry Product Landscape
The MEA functional beverage market offers a diverse range of products catering to varied consumer needs. Innovation is focused on developing products with natural ingredients, reduced sugar content, and enhanced functional benefits. Companies are also exploring innovative packaging solutions to improve shelf life and enhance consumer experience. Unique selling propositions often focus on natural ingredients, specific health benefits (e.g., improved hydration or enhanced energy), and convenient packaging. Technological advancements encompass new preservation techniques, improved flavor profiles, and the incorporation of functional ingredients.
Key Drivers, Barriers & Challenges in MEA Functional Beverages Industry
Key Drivers:
- Rising health consciousness among consumers.
- Increasing disposable incomes and urbanization.
- Growing popularity of fitness and sports activities.
- Government initiatives promoting healthy lifestyles.
Key Barriers and Challenges:
- Intense competition among established brands and new entrants.
- High cost of raw materials and production.
- Stringent regulatory requirements regarding labeling and ingredients.
- Supply chain complexities and logistics challenges in some regions.
Emerging Opportunities in MEA Functional Beverages Industry
- Growing demand for organic and natural functional beverages.
- Increasing popularity of plant-based and vegan options.
- Opportunities in niche segments such as functional beverages for specific health conditions (e.g., immunity-boosting drinks).
- Expansion into untapped markets across the MEA region.
Growth Accelerators in the MEA Functional Beverages Industry
The MEA functional beverage market’s long-term growth is driven by technological advancements such as improved production techniques and innovative packaging solutions. Strategic partnerships between beverage companies and health and wellness brands are also creating new growth opportunities. Furthermore, expanding distribution networks and increased market penetration through e-commerce channels are accelerating market growth.
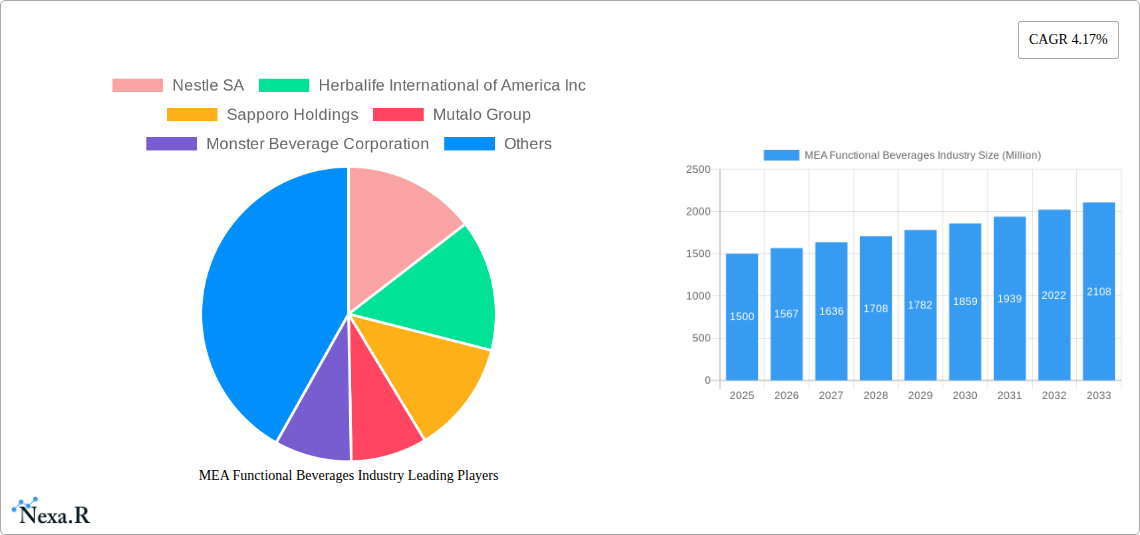
Key Players Shaping the MEA Functional Beverages Industry Market
- Nestle SA
- Herbalife International of America Inc
- Sapporo Holdings
- Mutalo Group
- Monster Beverage Corporation
- PepsiCo Inc
- Dr Pepper Snapple
- Viju Industries Nigeria Ltd
- iPRO Sport Distribution Limited
- Red Bull GmbH
- The Coca-Cola Company
Notable Milestones in MEA Functional Beverages Industry Sector
- October 2022: iPRO launched a range of sports drinks in Carrefour stores across the UAE, featuring 100% of the daily recommended vitamin C intake and added B vitamins.
- February 2022: PepsiCo launched its hemp-based energy drink lineup, "Rockstar Energy," in the Middle East, offering lower caffeine content.
- March 2021: Perrier introduced its first carbonated energy beverages, Perrier Energize, in Saudi Arabia, featuring organic ingredients and low calories.
In-Depth MEA Functional Beverages Industry Market Outlook
The MEA functional beverage market is poised for sustained growth, driven by evolving consumer preferences, technological advancements, and strategic expansion by key players. Future market potential lies in developing innovative products that address specific consumer needs, such as organic, plant-based, and immunity-boosting beverages. Strategic partnerships, investment in research and development, and targeted marketing campaigns will further contribute to the market's long-term success.
MEA Functional Beverages Industry Segmentation
-
1. Product Type
- 1.1. Energy Drinks
- 1.2. Fortified Juice
- 1.3. Sports Drinks
- 1.4. Dairy-based Drinks
- 1.5. Other Product Types
-
2. Distribution Channel
- 2.1. Supermarket/Hypermarket
- 2.2. Pharmacies and Health Stores
- 2.3. Convenience Stores
- 2.4. Online Retail Stores
- 2.5. Other Distribution Channels
-
3. Geography
- 3.1. South Africa
- 3.2. Saudi Arabia
- 3.3. Rest of Middle-East and Africa
MEA Functional Beverages Industry Segmentation By Geography
- 1. South Africa
- 2. Saudi Arabia
- 3. Rest of Middle East and Africa
MEA Functional Beverages Industry REPORT HIGHLIGHTS
| Aspects | Details |
|---|---|
| Study Period | 2019-2033 |
| Base Year | 2024 |
| Estimated Year | 2025 |
| Forecast Period | 2025-2033 |
| Historical Period | 2019-2024 |
| Growth Rate | CAGR of 4.17% from 2019-2033 |
| Segmentation |
|
Table of Contents
- 1. Introduction
- 1.1. Research Scope
- 1.2. Market Segmentation
- 1.3. Research Methodology
- 1.4. Definitions and Assumptions
- 2. Executive Summary
- 2.1. Introduction
- 3. Market Dynamics
- 3.1. Introduction
- 3.2. Market Drivers
- 3.2.1. Preference for Plant-based and Clean-label RTD Products; Consumer Inclination Toward Sugar-Free Drinks
- 3.3. Market Restrains
- 3.3.1. Concerns Over Health Issues Associated With Beverages
- 3.4. Market Trends
- 3.4.1. Growing Demand for Plant-based and Lactose-free Products
- 4. Market Factor Analysis
- 4.1. Porters Five Forces
- 4.2. Supply/Value Chain
- 4.3. PESTEL analysis
- 4.4. Market Entropy
- 4.5. Patent/Trademark Analysis
- 5. Global MEA Functional Beverages Industry Analysis, Insights and Forecast, 2019-2031
- 5.1. Market Analysis, Insights and Forecast - by Product Type
- 5.1.1. Energy Drinks
- 5.1.2. Fortified Juice
- 5.1.3. Sports Drinks
- 5.1.4. Dairy-based Drinks
- 5.1.5. Other Product Types
- 5.2. Market Analysis, Insights and Forecast - by Distribution Channel
- 5.2.1. Supermarket/Hypermarket
- 5.2.2. Pharmacies and Health Stores
- 5.2.3. Convenience Stores
- 5.2.4. Online Retail Stores
- 5.2.5. Other Distribution Channels
- 5.3. Market Analysis, Insights and Forecast - by Geography
- 5.3.1. South Africa
- 5.3.2. Saudi Arabia
- 5.3.3. Rest of Middle-East and Africa
- 5.4. Market Analysis, Insights and Forecast - by Region
- 5.4.1. South Africa
- 5.4.2. Saudi Arabia
- 5.4.3. Rest of Middle East and Africa
- 5.1. Market Analysis, Insights and Forecast - by Product Type
- 6. South Africa MEA Functional Beverages Industry Analysis, Insights and Forecast, 2019-2031
- 6.1. Market Analysis, Insights and Forecast - by Product Type
- 6.1.1. Energy Drinks
- 6.1.2. Fortified Juice
- 6.1.3. Sports Drinks
- 6.1.4. Dairy-based Drinks
- 6.1.5. Other Product Types
- 6.2. Market Analysis, Insights and Forecast - by Distribution Channel
- 6.2.1. Supermarket/Hypermarket
- 6.2.2. Pharmacies and Health Stores
- 6.2.3. Convenience Stores
- 6.2.4. Online Retail Stores
- 6.2.5. Other Distribution Channels
- 6.3. Market Analysis, Insights and Forecast - by Geography
- 6.3.1. South Africa
- 6.3.2. Saudi Arabia
- 6.3.3. Rest of Middle-East and Africa
- 6.1. Market Analysis, Insights and Forecast - by Product Type
- 7. Saudi Arabia MEA Functional Beverages Industry Analysis, Insights and Forecast, 2019-2031
- 7.1. Market Analysis, Insights and Forecast - by Product Type
- 7.1.1. Energy Drinks
- 7.1.2. Fortified Juice
- 7.1.3. Sports Drinks
- 7.1.4. Dairy-based Drinks
- 7.1.5. Other Product Types
- 7.2. Market Analysis, Insights and Forecast - by Distribution Channel
- 7.2.1. Supermarket/Hypermarket
- 7.2.2. Pharmacies and Health Stores
- 7.2.3. Convenience Stores
- 7.2.4. Online Retail Stores
- 7.2.5. Other Distribution Channels
- 7.3. Market Analysis, Insights and Forecast - by Geography
- 7.3.1. South Africa
- 7.3.2. Saudi Arabia
- 7.3.3. Rest of Middle-East and Africa
- 7.1. Market Analysis, Insights and Forecast - by Product Type
- 8. Rest of Middle East and Africa MEA Functional Beverages Industry Analysis, Insights and Forecast, 2019-2031
- 8.1. Market Analysis, Insights and Forecast - by Product Type
- 8.1.1. Energy Drinks
- 8.1.2. Fortified Juice
- 8.1.3. Sports Drinks
- 8.1.4. Dairy-based Drinks
- 8.1.5. Other Product Types
- 8.2. Market Analysis, Insights and Forecast - by Distribution Channel
- 8.2.1. Supermarket/Hypermarket
- 8.2.2. Pharmacies and Health Stores
- 8.2.3. Convenience Stores
- 8.2.4. Online Retail Stores
- 8.2.5. Other Distribution Channels
- 8.3. Market Analysis, Insights and Forecast - by Geography
- 8.3.1. South Africa
- 8.3.2. Saudi Arabia
- 8.3.3. Rest of Middle-East and Africa
- 8.1. Market Analysis, Insights and Forecast - by Product Type
- 9. North America MEA Functional Beverages Industry Analysis, Insights and Forecast, 2019-2031
- 9.1. Market Analysis, Insights and Forecast - By Country/Sub-region
- 9.1.1 United States
- 9.1.2 Canada
- 9.1.3 Mexico
- 10. Europe MEA Functional Beverages Industry Analysis, Insights and Forecast, 2019-2031
- 10.1. Market Analysis, Insights and Forecast - By Country/Sub-region
- 10.1.1 Germany
- 10.1.2 United Kingdom
- 10.1.3 France
- 10.1.4 Spain
- 10.1.5 Italy
- 10.1.6 Spain
- 10.1.7 Belgium
- 10.1.8 Netherland
- 10.1.9 Nordics
- 10.1.10 Rest of Europe
- 11. Asia Pacific MEA Functional Beverages Industry Analysis, Insights and Forecast, 2019-2031
- 11.1. Market Analysis, Insights and Forecast - By Country/Sub-region
- 11.1.1 China
- 11.1.2 Japan
- 11.1.3 India
- 11.1.4 South Korea
- 11.1.5 Southeast Asia
- 11.1.6 Australia
- 11.1.7 Indonesia
- 11.1.8 Phillipes
- 11.1.9 Singapore
- 11.1.10 Thailandc
- 11.1.11 Rest of Asia Pacific
- 12. South America MEA Functional Beverages Industry Analysis, Insights and Forecast, 2019-2031
- 12.1. Market Analysis, Insights and Forecast - By Country/Sub-region
- 12.1.1 Brazil
- 12.1.2 Argentina
- 12.1.3 Peru
- 12.1.4 Chile
- 12.1.5 Colombia
- 12.1.6 Ecuador
- 12.1.7 Venezuela
- 12.1.8 Rest of South America
- 13. North America MEA Functional Beverages Industry Analysis, Insights and Forecast, 2019-2031
- 13.1. Market Analysis, Insights and Forecast - By Country/Sub-region
- 13.1.1 United States
- 13.1.2 Canada
- 13.1.3 Mexico
- 14. MEA MEA Functional Beverages Industry Analysis, Insights and Forecast, 2019-2031
- 14.1. Market Analysis, Insights and Forecast - By Country/Sub-region
- 14.1.1 United Arab Emirates
- 14.1.2 Saudi Arabia
- 14.1.3 South Africa
- 14.1.4 Rest of Middle East and Africa
- 15. Competitive Analysis
- 15.1. Global Market Share Analysis 2024
- 15.2. Company Profiles
- 15.2.1 Nestle SA
- 15.2.1.1. Overview
- 15.2.1.2. Products
- 15.2.1.3. SWOT Analysis
- 15.2.1.4. Recent Developments
- 15.2.1.5. Financials (Based on Availability)
- 15.2.2 Herbalife International of America Inc
- 15.2.2.1. Overview
- 15.2.2.2. Products
- 15.2.2.3. SWOT Analysis
- 15.2.2.4. Recent Developments
- 15.2.2.5. Financials (Based on Availability)
- 15.2.3 Sapporo Holdings
- 15.2.3.1. Overview
- 15.2.3.2. Products
- 15.2.3.3. SWOT Analysis
- 15.2.3.4. Recent Developments
- 15.2.3.5. Financials (Based on Availability)
- 15.2.4 Mutalo Group
- 15.2.4.1. Overview
- 15.2.4.2. Products
- 15.2.4.3. SWOT Analysis
- 15.2.4.4. Recent Developments
- 15.2.4.5. Financials (Based on Availability)
- 15.2.5 Monster Beverage Corporation
- 15.2.5.1. Overview
- 15.2.5.2. Products
- 15.2.5.3. SWOT Analysis
- 15.2.5.4. Recent Developments
- 15.2.5.5. Financials (Based on Availability)
- 15.2.6 PepsiCo Inc
- 15.2.6.1. Overview
- 15.2.6.2. Products
- 15.2.6.3. SWOT Analysis
- 15.2.6.4. Recent Developments
- 15.2.6.5. Financials (Based on Availability)
- 15.2.7 Dr Pepper Snapple
- 15.2.7.1. Overview
- 15.2.7.2. Products
- 15.2.7.3. SWOT Analysis
- 15.2.7.4. Recent Developments
- 15.2.7.5. Financials (Based on Availability)
- 15.2.8 Viju Industries Nigeria Ltd
- 15.2.8.1. Overview
- 15.2.8.2. Products
- 15.2.8.3. SWOT Analysis
- 15.2.8.4. Recent Developments
- 15.2.8.5. Financials (Based on Availability)
- 15.2.9 iPRO Sport Distribution Limited*List Not Exhaustive
- 15.2.9.1. Overview
- 15.2.9.2. Products
- 15.2.9.3. SWOT Analysis
- 15.2.9.4. Recent Developments
- 15.2.9.5. Financials (Based on Availability)
- 15.2.10 Red Bull GmbH
- 15.2.10.1. Overview
- 15.2.10.2. Products
- 15.2.10.3. SWOT Analysis
- 15.2.10.4. Recent Developments
- 15.2.10.5. Financials (Based on Availability)
- 15.2.11 The Coca-Cola Company
- 15.2.11.1. Overview
- 15.2.11.2. Products
- 15.2.11.3. SWOT Analysis
- 15.2.11.4. Recent Developments
- 15.2.11.5. Financials (Based on Availability)
- 15.2.1 Nestle SA
List of Figures
- Figure 1: Global MEA Functional Beverages Industry Revenue Breakdown (Million, %) by Region 2024 & 2032
- Figure 2: North America MEA Functional Beverages Industry Revenue (Million), by Country 2024 & 2032
- Figure 3: North America MEA Functional Beverages Industry Revenue Share (%), by Country 2024 & 2032
- Figure 4: Europe MEA Functional Beverages Industry Revenue (Million), by Country 2024 & 2032
- Figure 5: Europe MEA Functional Beverages Industry Revenue Share (%), by Country 2024 & 2032
- Figure 6: Asia Pacific MEA Functional Beverages Industry Revenue (Million), by Country 2024 & 2032
- Figure 7: Asia Pacific MEA Functional Beverages Industry Revenue Share (%), by Country 2024 & 2032
- Figure 8: South America MEA Functional Beverages Industry Revenue (Million), by Country 2024 & 2032
- Figure 9: South America MEA Functional Beverages Industry Revenue Share (%), by Country 2024 & 2032
- Figure 10: North America MEA Functional Beverages Industry Revenue (Million), by Country 2024 & 2032
- Figure 11: North America MEA Functional Beverages Industry Revenue Share (%), by Country 2024 & 2032
- Figure 12: MEA MEA Functional Beverages Industry Revenue (Million), by Country 2024 & 2032
- Figure 13: MEA MEA Functional Beverages Industry Revenue Share (%), by Country 2024 & 2032
- Figure 14: South Africa MEA Functional Beverages Industry Revenue (Million), by Product Type 2024 & 2032
- Figure 15: South Africa MEA Functional Beverages Industry Revenue Share (%), by Product Type 2024 & 2032
- Figure 16: South Africa MEA Functional Beverages Industry Revenue (Million), by Distribution Channel 2024 & 2032
- Figure 17: South Africa MEA Functional Beverages Industry Revenue Share (%), by Distribution Channel 2024 & 2032
- Figure 18: South Africa MEA Functional Beverages Industry Revenue (Million), by Geography 2024 & 2032
- Figure 19: South Africa MEA Functional Beverages Industry Revenue Share (%), by Geography 2024 & 2032
- Figure 20: South Africa MEA Functional Beverages Industry Revenue (Million), by Country 2024 & 2032
- Figure 21: South Africa MEA Functional Beverages Industry Revenue Share (%), by Country 2024 & 2032
- Figure 22: Saudi Arabia MEA Functional Beverages Industry Revenue (Million), by Product Type 2024 & 2032
- Figure 23: Saudi Arabia MEA Functional Beverages Industry Revenue Share (%), by Product Type 2024 & 2032
- Figure 24: Saudi Arabia MEA Functional Beverages Industry Revenue (Million), by Distribution Channel 2024 & 2032
- Figure 25: Saudi Arabia MEA Functional Beverages Industry Revenue Share (%), by Distribution Channel 2024 & 2032
- Figure 26: Saudi Arabia MEA Functional Beverages Industry Revenue (Million), by Geography 2024 & 2032
- Figure 27: Saudi Arabia MEA Functional Beverages Industry Revenue Share (%), by Geography 2024 & 2032
- Figure 28: Saudi Arabia MEA Functional Beverages Industry Revenue (Million), by Country 2024 & 2032
- Figure 29: Saudi Arabia MEA Functional Beverages Industry Revenue Share (%), by Country 2024 & 2032
- Figure 30: Rest of Middle East and Africa MEA Functional Beverages Industry Revenue (Million), by Product Type 2024 & 2032
- Figure 31: Rest of Middle East and Africa MEA Functional Beverages Industry Revenue Share (%), by Product Type 2024 & 2032
- Figure 32: Rest of Middle East and Africa MEA Functional Beverages Industry Revenue (Million), by Distribution Channel 2024 & 2032
- Figure 33: Rest of Middle East and Africa MEA Functional Beverages Industry Revenue Share (%), by Distribution Channel 2024 & 2032
- Figure 34: Rest of Middle East and Africa MEA Functional Beverages Industry Revenue (Million), by Geography 2024 & 2032
- Figure 35: Rest of Middle East and Africa MEA Functional Beverages Industry Revenue Share (%), by Geography 2024 & 2032
- Figure 36: Rest of Middle East and Africa MEA Functional Beverages Industry Revenue (Million), by Country 2024 & 2032
- Figure 37: Rest of Middle East and Africa MEA Functional Beverages Industry Revenue Share (%), by Country 2024 & 2032
List of Tables
- Table 1: Global MEA Functional Beverages Industry Revenue Million Forecast, by Region 2019 & 2032
- Table 2: Global MEA Functional Beverages Industry Revenue Million Forecast, by Product Type 2019 & 2032
- Table 3: Global MEA Functional Beverages Industry Revenue Million Forecast, by Distribution Channel 2019 & 2032
- Table 4: Global MEA Functional Beverages Industry Revenue Million Forecast, by Geography 2019 & 2032
- Table 5: Global MEA Functional Beverages Industry Revenue Million Forecast, by Region 2019 & 2032
- Table 6: Global MEA Functional Beverages Industry Revenue Million Forecast, by Country 2019 & 2032
- Table 7: United States MEA Functional Beverages Industry Revenue (Million) Forecast, by Application 2019 & 2032
- Table 8: Canada MEA Functional Beverages Industry Revenue (Million) Forecast, by Application 2019 & 2032
- Table 9: Mexico MEA Functional Beverages Industry Revenue (Million) Forecast, by Application 2019 & 2032
- Table 10: Global MEA Functional Beverages Industry Revenue Million Forecast, by Country 2019 & 2032
- Table 11: Germany MEA Functional Beverages Industry Revenue (Million) Forecast, by Application 2019 & 2032
- Table 12: United Kingdom MEA Functional Beverages Industry Revenue (Million) Forecast, by Application 2019 & 2032
- Table 13: France MEA Functional Beverages Industry Revenue (Million) Forecast, by Application 2019 & 2032
- Table 14: Spain MEA Functional Beverages Industry Revenue (Million) Forecast, by Application 2019 & 2032
- Table 15: Italy MEA Functional Beverages Industry Revenue (Million) Forecast, by Application 2019 & 2032
- Table 16: Spain MEA Functional Beverages Industry Revenue (Million) Forecast, by Application 2019 & 2032
- Table 17: Belgium MEA Functional Beverages Industry Revenue (Million) Forecast, by Application 2019 & 2032
- Table 18: Netherland MEA Functional Beverages Industry Revenue (Million) Forecast, by Application 2019 & 2032
- Table 19: Nordics MEA Functional Beverages Industry Revenue (Million) Forecast, by Application 2019 & 2032
- Table 20: Rest of Europe MEA Functional Beverages Industry Revenue (Million) Forecast, by Application 2019 & 2032
- Table 21: Global MEA Functional Beverages Industry Revenue Million Forecast, by Country 2019 & 2032
- Table 22: China MEA Functional Beverages Industry Revenue (Million) Forecast, by Application 2019 & 2032
- Table 23: Japan MEA Functional Beverages Industry Revenue (Million) Forecast, by Application 2019 & 2032
- Table 24: India MEA Functional Beverages Industry Revenue (Million) Forecast, by Application 2019 & 2032
- Table 25: South Korea MEA Functional Beverages Industry Revenue (Million) Forecast, by Application 2019 & 2032
- Table 26: Southeast Asia MEA Functional Beverages Industry Revenue (Million) Forecast, by Application 2019 & 2032
- Table 27: Australia MEA Functional Beverages Industry Revenue (Million) Forecast, by Application 2019 & 2032
- Table 28: Indonesia MEA Functional Beverages Industry Revenue (Million) Forecast, by Application 2019 & 2032
- Table 29: Phillipes MEA Functional Beverages Industry Revenue (Million) Forecast, by Application 2019 & 2032
- Table 30: Singapore MEA Functional Beverages Industry Revenue (Million) Forecast, by Application 2019 & 2032
- Table 31: Thailandc MEA Functional Beverages Industry Revenue (Million) Forecast, by Application 2019 & 2032
- Table 32: Rest of Asia Pacific MEA Functional Beverages Industry Revenue (Million) Forecast, by Application 2019 & 2032
- Table 33: Global MEA Functional Beverages Industry Revenue Million Forecast, by Country 2019 & 2032
- Table 34: Brazil MEA Functional Beverages Industry Revenue (Million) Forecast, by Application 2019 & 2032
- Table 35: Argentina MEA Functional Beverages Industry Revenue (Million) Forecast, by Application 2019 & 2032
- Table 36: Peru MEA Functional Beverages Industry Revenue (Million) Forecast, by Application 2019 & 2032
- Table 37: Chile MEA Functional Beverages Industry Revenue (Million) Forecast, by Application 2019 & 2032
- Table 38: Colombia MEA Functional Beverages Industry Revenue (Million) Forecast, by Application 2019 & 2032
- Table 39: Ecuador MEA Functional Beverages Industry Revenue (Million) Forecast, by Application 2019 & 2032
- Table 40: Venezuela MEA Functional Beverages Industry Revenue (Million) Forecast, by Application 2019 & 2032
- Table 41: Rest of South America MEA Functional Beverages Industry Revenue (Million) Forecast, by Application 2019 & 2032
- Table 42: Global MEA Functional Beverages Industry Revenue Million Forecast, by Country 2019 & 2032
- Table 43: United States MEA Functional Beverages Industry Revenue (Million) Forecast, by Application 2019 & 2032
- Table 44: Canada MEA Functional Beverages Industry Revenue (Million) Forecast, by Application 2019 & 2032
- Table 45: Mexico MEA Functional Beverages Industry Revenue (Million) Forecast, by Application 2019 & 2032
- Table 46: Global MEA Functional Beverages Industry Revenue Million Forecast, by Country 2019 & 2032
- Table 47: United Arab Emirates MEA Functional Beverages Industry Revenue (Million) Forecast, by Application 2019 & 2032
- Table 48: Saudi Arabia MEA Functional Beverages Industry Revenue (Million) Forecast, by Application 2019 & 2032
- Table 49: South Africa MEA Functional Beverages Industry Revenue (Million) Forecast, by Application 2019 & 2032
- Table 50: Rest of Middle East and Africa MEA Functional Beverages Industry Revenue (Million) Forecast, by Application 2019 & 2032
- Table 51: Global MEA Functional Beverages Industry Revenue Million Forecast, by Product Type 2019 & 2032
- Table 52: Global MEA Functional Beverages Industry Revenue Million Forecast, by Distribution Channel 2019 & 2032
- Table 53: Global MEA Functional Beverages Industry Revenue Million Forecast, by Geography 2019 & 2032
- Table 54: Global MEA Functional Beverages Industry Revenue Million Forecast, by Country 2019 & 2032
- Table 55: Global MEA Functional Beverages Industry Revenue Million Forecast, by Product Type 2019 & 2032
- Table 56: Global MEA Functional Beverages Industry Revenue Million Forecast, by Distribution Channel 2019 & 2032
- Table 57: Global MEA Functional Beverages Industry Revenue Million Forecast, by Geography 2019 & 2032
- Table 58: Global MEA Functional Beverages Industry Revenue Million Forecast, by Country 2019 & 2032
- Table 59: Global MEA Functional Beverages Industry Revenue Million Forecast, by Product Type 2019 & 2032
- Table 60: Global MEA Functional Beverages Industry Revenue Million Forecast, by Distribution Channel 2019 & 2032
- Table 61: Global MEA Functional Beverages Industry Revenue Million Forecast, by Geography 2019 & 2032
- Table 62: Global MEA Functional Beverages Industry Revenue Million Forecast, by Country 2019 & 2032
Frequently Asked Questions
1. What is the projected Compound Annual Growth Rate (CAGR) of the MEA Functional Beverages Industry?
The projected CAGR is approximately 4.17%.
2. Which companies are prominent players in the MEA Functional Beverages Industry?
Key companies in the market include Nestle SA, Herbalife International of America Inc, Sapporo Holdings, Mutalo Group, Monster Beverage Corporation, PepsiCo Inc, Dr Pepper Snapple, Viju Industries Nigeria Ltd, iPRO Sport Distribution Limited*List Not Exhaustive, Red Bull GmbH, The Coca-Cola Company.
3. What are the main segments of the MEA Functional Beverages Industry?
The market segments include Product Type, Distribution Channel, Geography.
4. Can you provide details about the market size?
The market size is estimated to be USD XX Million as of 2022.
5. What are some drivers contributing to market growth?
Preference for Plant-based and Clean-label RTD Products; Consumer Inclination Toward Sugar-Free Drinks.
6. What are the notable trends driving market growth?
Growing Demand for Plant-based and Lactose-free Products.
7. Are there any restraints impacting market growth?
Concerns Over Health Issues Associated With Beverages.
8. Can you provide examples of recent developments in the market?
October 2022: iPRO launched a range of sports drinks in Carrefour stores across the United Arab Emirates. The company claims that it contains 100% of the daily recommended vitamin C intake, along with added B vitamins.
9. What pricing options are available for accessing the report?
Pricing options include single-user, multi-user, and enterprise licenses priced at USD 4750, USD 5250, and USD 8750 respectively.
10. Is the market size provided in terms of value or volume?
The market size is provided in terms of value, measured in Million.
11. Are there any specific market keywords associated with the report?
Yes, the market keyword associated with the report is "MEA Functional Beverages Industry," which aids in identifying and referencing the specific market segment covered.
12. How do I determine which pricing option suits my needs best?
The pricing options vary based on user requirements and access needs. Individual users may opt for single-user licenses, while businesses requiring broader access may choose multi-user or enterprise licenses for cost-effective access to the report.
13. Are there any additional resources or data provided in the MEA Functional Beverages Industry report?
While the report offers comprehensive insights, it's advisable to review the specific contents or supplementary materials provided to ascertain if additional resources or data are available.
14. How can I stay updated on further developments or reports in the MEA Functional Beverages Industry?
To stay informed about further developments, trends, and reports in the MEA Functional Beverages Industry, consider subscribing to industry newsletters, following relevant companies and organizations, or regularly checking reputable industry news sources and publications.
Methodology
Step 1 - Identification of Relevant Samples Size from Population Database


Step 2 - Approaches for Defining Global Market Size (Value, Volume* & Price*)

Note*: In applicable scenarios
Step 3 - Data Sources
Primary Research
- Web Analytics
- Survey Reports
- Research Institute
- Latest Research Reports
- Opinion Leaders
Secondary Research
- Annual Reports
- White Paper
- Latest Press Release
- Industry Association
- Paid Database
- Investor Presentations

Step 4 - Data Triangulation
Involves using different sources of information in order to increase the validity of a study
These sources are likely to be stakeholders in a program - participants, other researchers, program staff, other community members, and so on.
Then we put all data in single framework & apply various statistical tools to find out the dynamic on the market.
During the analysis stage, feedback from the stakeholder groups would be compared to determine areas of agreement as well as areas of divergence
