

Key Insights
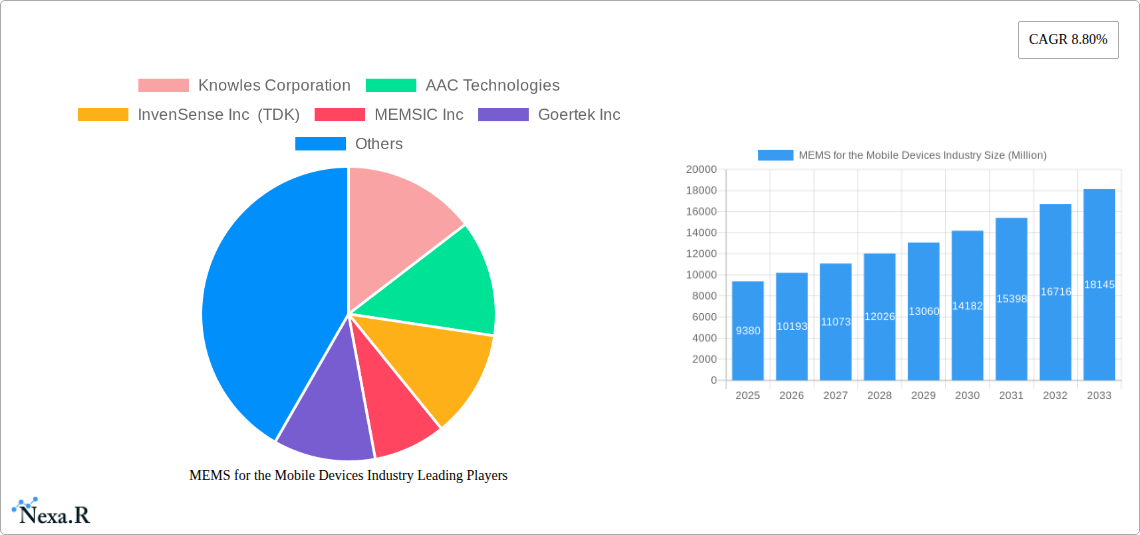
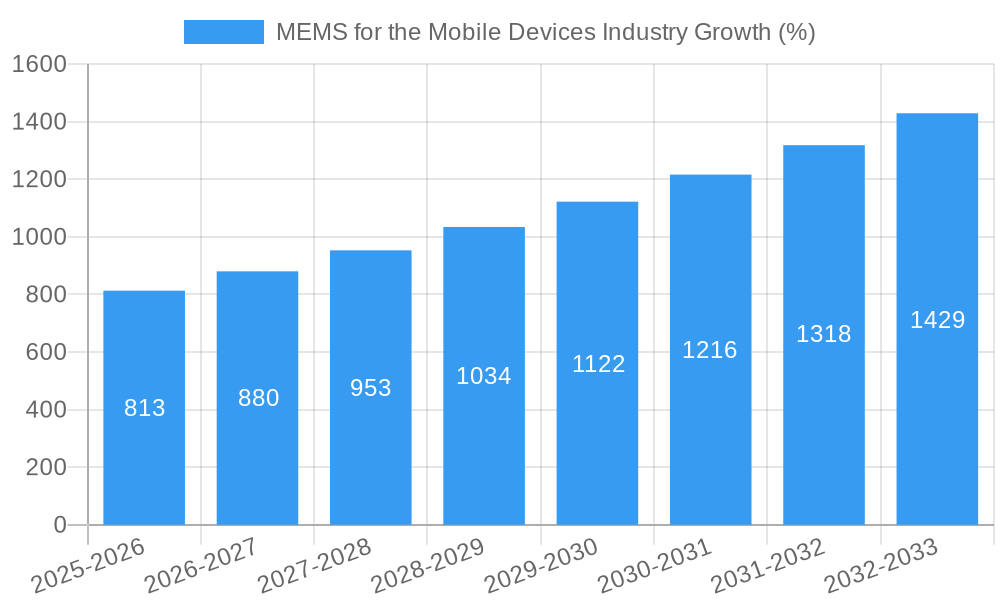
The MEMS (Microelectromechanical Systems) market for mobile devices is experiencing robust growth, driven by the increasing demand for sophisticated functionalities in smartphones, wearables, and IoT devices. The market, valued at $9.38 billion in 2025, is projected to expand at a compound annual growth rate (CAGR) of 8.80% from 2025 to 2033. This growth is fueled by several key factors. Advancements in sensor technology, leading to smaller, more energy-efficient, and higher-performing MEMS components, are a significant driver. The integration of multiple sensors into a single device, enabling features like enhanced gesture recognition, improved health tracking, and advanced augmented reality applications, further fuels demand. The proliferation of 5G technology and its need for more precise positioning and sensing capabilities also contributes to market expansion. Furthermore, the rising popularity of wearables and the expanding IoT ecosystem are creating new avenues for MEMS sensor adoption, leading to higher growth projections in these segments.
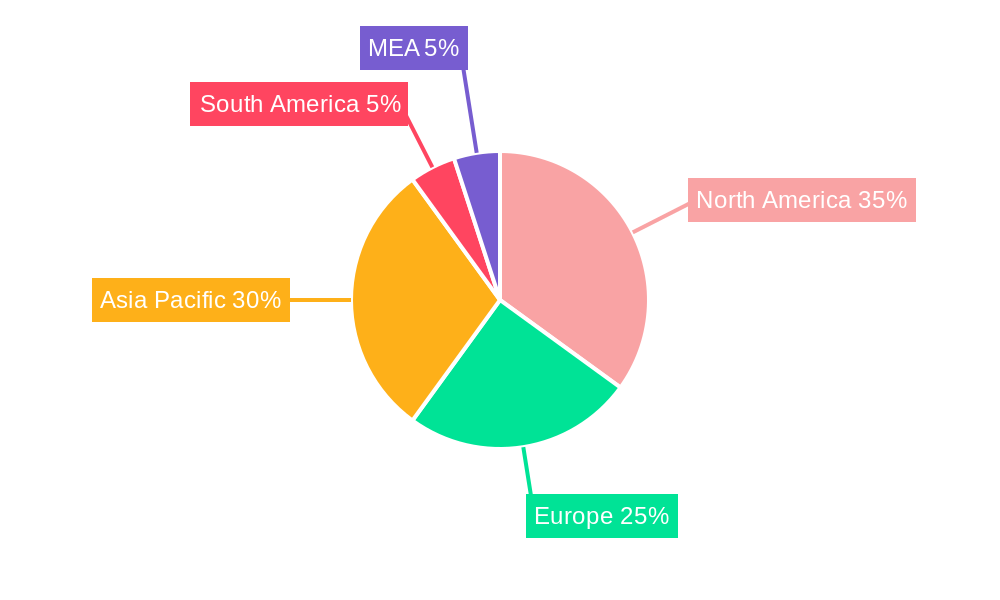
The market segmentation reveals significant opportunities. Fingerprint sensors remain a dominant force, primarily driven by enhanced smartphone security features. However, accelerometers, gyroscopes, and pressure sensors are witnessing significant growth due to their applications in motion tracking, health monitoring, and barometric pressure measurement within mobile devices. The adoption of BAW (Bulk Acoustic Wave) sensors is also increasing due to their superior performance characteristics. Geographically, North America and Asia Pacific are expected to lead the market due to high smartphone penetration and a strong manufacturing base, respectively. However, other regions, particularly in developing economies, are showing significant growth potential due to increasing disposable income and the growing adoption of mobile technologies. Competitive pressures among leading MEMS manufacturers like Knowles Corporation, AAC Technologies, and Bosch Sensortec GmbH, are driving innovation and price optimization, making these components accessible across a wider range of devices.
MEMS for the Mobile Devices Industry: A Comprehensive Market Report (2019-2033)
This in-depth report provides a comprehensive analysis of the MEMS (Microelectromechanical Systems) market for mobile devices, encompassing market dynamics, growth trends, regional segmentation, product landscape, key players, and future outlook. The study period spans from 2019 to 2033, with a base year of 2025 and a forecast period of 2025-2033. This report is crucial for industry professionals, investors, and strategists seeking to understand and capitalize on the evolving landscape of this rapidly expanding sector. The report analyzes the parent market of sensor technologies and the child market of mobile device sensors, providing a granular view of this dynamic space. Market values are presented in million units.
MEMS for the Mobile Devices Industry Market Dynamics & Structure
The MEMS market for mobile devices is characterized by moderate concentration, with key players vying for market share. Technological innovation, particularly in miniaturization and power efficiency, is a crucial driver. Regulatory frameworks concerning data privacy and safety standards significantly influence product development and market access. Competitive substitutes, such as alternative sensing technologies, pose a challenge. End-user demographics, notably the increasing adoption of smartphones and wearables, fuel market growth. Mergers and acquisitions (M&A) activity reflects industry consolidation and technological integration. The historical period (2019-2024) showed a xx% CAGR, and the forecast period (2025-2033) is projected to exhibit a xx% CAGR.
- Market Concentration: Moderately concentrated, with top 10 players holding approximately xx% market share in 2025.
- Technological Innovation: Miniaturization, improved power efficiency, and enhanced sensor integration are key drivers.
- Regulatory Frameworks: Data privacy and safety regulations influence product design and market access.
- Competitive Substitutes: Alternative sensing technologies pose a moderate competitive threat.
- End-User Demographics: Growing smartphone and wearable device adoption is a major growth catalyst.
- M&A Trends: xx M&A deals observed in the historical period, indicating a trend of consolidation.
MEMS for the Mobile Devices Industry Growth Trends & Insights
The MEMS market for mobile devices has witnessed significant growth, driven by the proliferation of smartphones, tablets, and wearables. Adoption rates have steadily increased, fueled by technological advancements and declining prices. Disruptive technologies, such as improved sensor fusion and AI-driven data processing, are reshaping the market landscape. Consumer behavior shifts toward personalized and interactive devices further propel demand. The market size is estimated at xx million units in 2025, exhibiting a CAGR of xx% during the historical period and projected to reach xx million units by 2033, with a projected CAGR of xx% during the forecast period. Market penetration in smartphones has reached approximately xx% in 2025, with significant potential for further expansion in other applications.
Dominant Regions, Countries, or Segments in MEMS for the Mobile Devices Industry
Asia-Pacific, particularly China, currently dominates the MEMS market for mobile devices due to its large manufacturing base and high consumer electronics demand. North America and Europe also represent significant markets, driven by technological innovation and high consumer spending. Within sensor types, fingerprint sensors and accelerometers are the largest segments, driven by widespread adoption in smartphones and wearables. Smartphones represent the largest application segment, followed by wearable devices and IoT devices.
- Leading Region: Asia-Pacific (xx% market share in 2025)
- Leading Country: China (xx% of the Asia-Pacific market in 2025)
- Leading Sensor Type: Fingerprint Sensors (xx million units in 2025)
- Leading Application: Smartphones (xx million units in 2025)
- Key Drivers: High consumer electronics demand (Asia-Pacific), strong R&D investment (North America & Europe), favorable government policies (various regions).
MEMS for the Mobile Devices Industry Product Landscape
MEMS technology continues to advance, leading to smaller, more energy-efficient, and more accurate sensors. Product innovations focus on integrating multiple sensors into single packages, enhancing performance through advanced signal processing, and improving durability and reliability. Key performance metrics include sensitivity, accuracy, power consumption, and size. Unique selling propositions often center around superior performance, miniaturization capabilities, and enhanced integration with other components within mobile devices.
Key Drivers, Barriers & Challenges in MEMS for the Mobile Devices Industry
Key Drivers:
- Increasing demand for advanced features in mobile devices (e.g., biometric authentication, gesture recognition, augmented reality).
- Technological advancements in sensor miniaturization and integration.
- Growth in the Internet of Things (IoT) and wearable electronics markets.
Key Challenges & Restraints:
- Supply chain disruptions impacting component availability and pricing.
- Stringent regulatory requirements regarding data privacy and safety.
- Intense competition from established and emerging players. This has resulted in price pressure and reduced profit margins for some companies. xx% of companies reported feeling this pressure in 2024.
Emerging Opportunities in MEMS for Mobile Devices Industry
- Growth in Automotive Applications: MEMS sensors are increasingly used in advanced driver-assistance systems (ADAS) and autonomous vehicles.
- Expansion into Healthcare: MEMS technology is finding applications in wearable health monitors and medical implants.
- Development of Novel Sensor Types: Research and development in new types of MEMS sensors such as advanced environmental sensors opens up new possibilities.
Growth Accelerators in the MEMS for the Mobile Devices Industry
Technological advancements, particularly in sensor fusion and AI integration, are key growth catalysts. Strategic partnerships and collaborations are enabling the development of innovative products and solutions. The ongoing expansion into new applications, such as automotive and healthcare, provides substantial growth opportunities.
Key Players Shaping the MEMS for the Mobile Devices Industry Market
- Knowles Corporation
- AAC Technologies
- InvenSense Inc (TDK)
- MEMSIC Inc
- Goertek Inc
- Bosch Sensortec GmbH
- Murata Manufacturing
- STMicroelectronics NV
- Analog Devices Inc
- BSE Co Ltd
Notable Milestones in MEMS for the Mobile Devices Industry Sector
- December 2022: Knowles Corporation introduced new balanced armatures and MEMS microphones for over-the-counter hearing aids, enhancing the performance and design flexibility of hearing health products.
- November 2022: Bosch Sensortec GmbH partnered with Hahn-Schickard to develop MEMS micro speakers for audio and voice-based applications, strengthening its position in the mobile and audio markets.
In-Depth MEMS for the Mobile Devices Industry Market Outlook
The MEMS market for mobile devices is poised for continued strong growth, driven by technological innovation, expanding applications, and increasing consumer demand. Strategic partnerships and investments in R&D will further accelerate market expansion, offering significant opportunities for established and emerging players. The focus on miniaturization, power efficiency, and enhanced sensor integration will continue to shape the market landscape in the coming years.
MEMS for the Mobile Devices Industry Segmentation
-
1. Type of Sensor
- 1.1. Fingerprint Sensor
- 1.2. Accelerometer Sensor
- 1.3. Gyroscope
- 1.4. Pressure Sensor
- 1.5. BAW Sensor
- 1.6. Microphones
- 1.7. Other Types of Sensors
MEMS for the Mobile Devices Industry Segmentation By Geography
- 1. North America
- 2. Europe
- 3. Asia Pacific
- 4. Latin America
- 5. Middle East and Africa
MEMS for the Mobile Devices Industry REPORT HIGHLIGHTS
| Aspects | Details |
|---|---|
| Study Period | 2019-2033 |
| Base Year | 2024 |
| Estimated Year | 2025 |
| Forecast Period | 2025-2033 |
| Historical Period | 2019-2024 |
| Growth Rate | CAGR of 8.80% from 2019-2033 |
| Segmentation |
|
Table of Contents
- 1. Introduction
- 1.1. Research Scope
- 1.2. Market Segmentation
- 1.3. Research Methodology
- 1.4. Definitions and Assumptions
- 2. Executive Summary
- 2.1. Introduction
- 3. Market Dynamics
- 3.1. Introduction
- 3.2. Market Drivers
- 3.2.1. Increasing Acceptance of Miniaturization Trend; Increasing Demand for High-Performance Devices
- 3.3. Market Restrains
- 3.3.1. Highly Complex Manufacturing Process and Demanding Cycle Time; Lack of Standardized Fabrication Process
- 3.4. Market Trends
- 3.4.1. Increasing Acceptance of Miniaturization Trend to Drive the Market
- 4. Market Factor Analysis
- 4.1. Porters Five Forces
- 4.2. Supply/Value Chain
- 4.3. PESTEL analysis
- 4.4. Market Entropy
- 4.5. Patent/Trademark Analysis
- 5. Global MEMS for the Mobile Devices Industry Analysis, Insights and Forecast, 2019-2031
- 5.1. Market Analysis, Insights and Forecast - by Type of Sensor
- 5.1.1. Fingerprint Sensor
- 5.1.2. Accelerometer Sensor
- 5.1.3. Gyroscope
- 5.1.4. Pressure Sensor
- 5.1.5. BAW Sensor
- 5.1.6. Microphones
- 5.1.7. Other Types of Sensors
- 5.2. Market Analysis, Insights and Forecast - by Region
- 5.2.1. North America
- 5.2.2. Europe
- 5.2.3. Asia Pacific
- 5.2.4. Latin America
- 5.2.5. Middle East and Africa
- 5.1. Market Analysis, Insights and Forecast - by Type of Sensor
- 6. North America MEMS for the Mobile Devices Industry Analysis, Insights and Forecast, 2019-2031
- 6.1. Market Analysis, Insights and Forecast - by Type of Sensor
- 6.1.1. Fingerprint Sensor
- 6.1.2. Accelerometer Sensor
- 6.1.3. Gyroscope
- 6.1.4. Pressure Sensor
- 6.1.5. BAW Sensor
- 6.1.6. Microphones
- 6.1.7. Other Types of Sensors
- 6.1. Market Analysis, Insights and Forecast - by Type of Sensor
- 7. Europe MEMS for the Mobile Devices Industry Analysis, Insights and Forecast, 2019-2031
- 7.1. Market Analysis, Insights and Forecast - by Type of Sensor
- 7.1.1. Fingerprint Sensor
- 7.1.2. Accelerometer Sensor
- 7.1.3. Gyroscope
- 7.1.4. Pressure Sensor
- 7.1.5. BAW Sensor
- 7.1.6. Microphones
- 7.1.7. Other Types of Sensors
- 7.1. Market Analysis, Insights and Forecast - by Type of Sensor
- 8. Asia Pacific MEMS for the Mobile Devices Industry Analysis, Insights and Forecast, 2019-2031
- 8.1. Market Analysis, Insights and Forecast - by Type of Sensor
- 8.1.1. Fingerprint Sensor
- 8.1.2. Accelerometer Sensor
- 8.1.3. Gyroscope
- 8.1.4. Pressure Sensor
- 8.1.5. BAW Sensor
- 8.1.6. Microphones
- 8.1.7. Other Types of Sensors
- 8.1. Market Analysis, Insights and Forecast - by Type of Sensor
- 9. Latin America MEMS for the Mobile Devices Industry Analysis, Insights and Forecast, 2019-2031
- 9.1. Market Analysis, Insights and Forecast - by Type of Sensor
- 9.1.1. Fingerprint Sensor
- 9.1.2. Accelerometer Sensor
- 9.1.3. Gyroscope
- 9.1.4. Pressure Sensor
- 9.1.5. BAW Sensor
- 9.1.6. Microphones
- 9.1.7. Other Types of Sensors
- 9.1. Market Analysis, Insights and Forecast - by Type of Sensor
- 10. Middle East and Africa MEMS for the Mobile Devices Industry Analysis, Insights and Forecast, 2019-2031
- 10.1. Market Analysis, Insights and Forecast - by Type of Sensor
- 10.1.1. Fingerprint Sensor
- 10.1.2. Accelerometer Sensor
- 10.1.3. Gyroscope
- 10.1.4. Pressure Sensor
- 10.1.5. BAW Sensor
- 10.1.6. Microphones
- 10.1.7. Other Types of Sensors
- 10.1. Market Analysis, Insights and Forecast - by Type of Sensor
- 11. North America MEMS for the Mobile Devices Industry Analysis, Insights and Forecast, 2019-2031
- 11.1. Market Analysis, Insights and Forecast - By Country/Sub-region
- 11.1.1 United States
- 11.1.2 Canada
- 11.1.3 Mexico
- 12. Europe MEMS for the Mobile Devices Industry Analysis, Insights and Forecast, 2019-2031
- 12.1. Market Analysis, Insights and Forecast - By Country/Sub-region
- 12.1.1 Germany
- 12.1.2 United Kingdom
- 12.1.3 France
- 12.1.4 Spain
- 12.1.5 Italy
- 12.1.6 Spain
- 12.1.7 Belgium
- 12.1.8 Netherland
- 12.1.9 Nordics
- 12.1.10 Rest of Europe
- 13. Asia Pacific MEMS for the Mobile Devices Industry Analysis, Insights and Forecast, 2019-2031
- 13.1. Market Analysis, Insights and Forecast - By Country/Sub-region
- 13.1.1 China
- 13.1.2 Japan
- 13.1.3 India
- 13.1.4 South Korea
- 13.1.5 Southeast Asia
- 13.1.6 Australia
- 13.1.7 Indonesia
- 13.1.8 Phillipes
- 13.1.9 Singapore
- 13.1.10 Thailandc
- 13.1.11 Rest of Asia Pacific
- 14. South America MEMS for the Mobile Devices Industry Analysis, Insights and Forecast, 2019-2031
- 14.1. Market Analysis, Insights and Forecast - By Country/Sub-region
- 14.1.1 Brazil
- 14.1.2 Argentina
- 14.1.3 Peru
- 14.1.4 Chile
- 14.1.5 Colombia
- 14.1.6 Ecuador
- 14.1.7 Venezuela
- 14.1.8 Rest of South America
- 15. MEA MEMS for the Mobile Devices Industry Analysis, Insights and Forecast, 2019-2031
- 15.1. Market Analysis, Insights and Forecast - By Country/Sub-region
- 15.1.1 United Arab Emirates
- 15.1.2 Saudi Arabia
- 15.1.3 South Africa
- 15.1.4 Rest of Middle East and Africa
- 16. Competitive Analysis
- 16.1. Global Market Share Analysis 2024
- 16.2. Company Profiles
- 16.2.1 Knowles Corporation
- 16.2.1.1. Overview
- 16.2.1.2. Products
- 16.2.1.3. SWOT Analysis
- 16.2.1.4. Recent Developments
- 16.2.1.5. Financials (Based on Availability)
- 16.2.2 AAC Technologies
- 16.2.2.1. Overview
- 16.2.2.2. Products
- 16.2.2.3. SWOT Analysis
- 16.2.2.4. Recent Developments
- 16.2.2.5. Financials (Based on Availability)
- 16.2.3 InvenSense Inc (TDK)
- 16.2.3.1. Overview
- 16.2.3.2. Products
- 16.2.3.3. SWOT Analysis
- 16.2.3.4. Recent Developments
- 16.2.3.5. Financials (Based on Availability)
- 16.2.4 MEMSIC Inc
- 16.2.4.1. Overview
- 16.2.4.2. Products
- 16.2.4.3. SWOT Analysis
- 16.2.4.4. Recent Developments
- 16.2.4.5. Financials (Based on Availability)
- 16.2.5 Goertek Inc
- 16.2.5.1. Overview
- 16.2.5.2. Products
- 16.2.5.3. SWOT Analysis
- 16.2.5.4. Recent Developments
- 16.2.5.5. Financials (Based on Availability)
- 16.2.6 Bosch Sensortec GmbH
- 16.2.6.1. Overview
- 16.2.6.2. Products
- 16.2.6.3. SWOT Analysis
- 16.2.6.4. Recent Developments
- 16.2.6.5. Financials (Based on Availability)
- 16.2.7 Murata Manufacturing
- 16.2.7.1. Overview
- 16.2.7.2. Products
- 16.2.7.3. SWOT Analysis
- 16.2.7.4. Recent Developments
- 16.2.7.5. Financials (Based on Availability)
- 16.2.8 STMicroelectronics NV
- 16.2.8.1. Overview
- 16.2.8.2. Products
- 16.2.8.3. SWOT Analysis
- 16.2.8.4. Recent Developments
- 16.2.8.5. Financials (Based on Availability)
- 16.2.9 Analog Devices Inc
- 16.2.9.1. Overview
- 16.2.9.2. Products
- 16.2.9.3. SWOT Analysis
- 16.2.9.4. Recent Developments
- 16.2.9.5. Financials (Based on Availability)
- 16.2.10 BSE Co Ltd
- 16.2.10.1. Overview
- 16.2.10.2. Products
- 16.2.10.3. SWOT Analysis
- 16.2.10.4. Recent Developments
- 16.2.10.5. Financials (Based on Availability)
- 16.2.1 Knowles Corporation
List of Figures
- Figure 1: Global MEMS for the Mobile Devices Industry Revenue Breakdown (Million, %) by Region 2024 & 2032
- Figure 2: Global MEMS for the Mobile Devices Industry Volume Breakdown (K Unit, %) by Region 2024 & 2032
- Figure 3: North America MEMS for the Mobile Devices Industry Revenue (Million), by Country 2024 & 2032
- Figure 4: North America MEMS for the Mobile Devices Industry Volume (K Unit), by Country 2024 & 2032
- Figure 5: North America MEMS for the Mobile Devices Industry Revenue Share (%), by Country 2024 & 2032
- Figure 6: North America MEMS for the Mobile Devices Industry Volume Share (%), by Country 2024 & 2032
- Figure 7: Europe MEMS for the Mobile Devices Industry Revenue (Million), by Country 2024 & 2032
- Figure 8: Europe MEMS for the Mobile Devices Industry Volume (K Unit), by Country 2024 & 2032
- Figure 9: Europe MEMS for the Mobile Devices Industry Revenue Share (%), by Country 2024 & 2032
- Figure 10: Europe MEMS for the Mobile Devices Industry Volume Share (%), by Country 2024 & 2032
- Figure 11: Asia Pacific MEMS for the Mobile Devices Industry Revenue (Million), by Country 2024 & 2032
- Figure 12: Asia Pacific MEMS for the Mobile Devices Industry Volume (K Unit), by Country 2024 & 2032
- Figure 13: Asia Pacific MEMS for the Mobile Devices Industry Revenue Share (%), by Country 2024 & 2032
- Figure 14: Asia Pacific MEMS for the Mobile Devices Industry Volume Share (%), by Country 2024 & 2032
- Figure 15: South America MEMS for the Mobile Devices Industry Revenue (Million), by Country 2024 & 2032
- Figure 16: South America MEMS for the Mobile Devices Industry Volume (K Unit), by Country 2024 & 2032
- Figure 17: South America MEMS for the Mobile Devices Industry Revenue Share (%), by Country 2024 & 2032
- Figure 18: South America MEMS for the Mobile Devices Industry Volume Share (%), by Country 2024 & 2032
- Figure 19: MEA MEMS for the Mobile Devices Industry Revenue (Million), by Country 2024 & 2032
- Figure 20: MEA MEMS for the Mobile Devices Industry Volume (K Unit), by Country 2024 & 2032
- Figure 21: MEA MEMS for the Mobile Devices Industry Revenue Share (%), by Country 2024 & 2032
- Figure 22: MEA MEMS for the Mobile Devices Industry Volume Share (%), by Country 2024 & 2032
- Figure 23: North America MEMS for the Mobile Devices Industry Revenue (Million), by Type of Sensor 2024 & 2032
- Figure 24: North America MEMS for the Mobile Devices Industry Volume (K Unit), by Type of Sensor 2024 & 2032
- Figure 25: North America MEMS for the Mobile Devices Industry Revenue Share (%), by Type of Sensor 2024 & 2032
- Figure 26: North America MEMS for the Mobile Devices Industry Volume Share (%), by Type of Sensor 2024 & 2032
- Figure 27: North America MEMS for the Mobile Devices Industry Revenue (Million), by Country 2024 & 2032
- Figure 28: North America MEMS for the Mobile Devices Industry Volume (K Unit), by Country 2024 & 2032
- Figure 29: North America MEMS for the Mobile Devices Industry Revenue Share (%), by Country 2024 & 2032
- Figure 30: North America MEMS for the Mobile Devices Industry Volume Share (%), by Country 2024 & 2032
- Figure 31: Europe MEMS for the Mobile Devices Industry Revenue (Million), by Type of Sensor 2024 & 2032
- Figure 32: Europe MEMS for the Mobile Devices Industry Volume (K Unit), by Type of Sensor 2024 & 2032
- Figure 33: Europe MEMS for the Mobile Devices Industry Revenue Share (%), by Type of Sensor 2024 & 2032
- Figure 34: Europe MEMS for the Mobile Devices Industry Volume Share (%), by Type of Sensor 2024 & 2032
- Figure 35: Europe MEMS for the Mobile Devices Industry Revenue (Million), by Country 2024 & 2032
- Figure 36: Europe MEMS for the Mobile Devices Industry Volume (K Unit), by Country 2024 & 2032
- Figure 37: Europe MEMS for the Mobile Devices Industry Revenue Share (%), by Country 2024 & 2032
- Figure 38: Europe MEMS for the Mobile Devices Industry Volume Share (%), by Country 2024 & 2032
- Figure 39: Asia Pacific MEMS for the Mobile Devices Industry Revenue (Million), by Type of Sensor 2024 & 2032
- Figure 40: Asia Pacific MEMS for the Mobile Devices Industry Volume (K Unit), by Type of Sensor 2024 & 2032
- Figure 41: Asia Pacific MEMS for the Mobile Devices Industry Revenue Share (%), by Type of Sensor 2024 & 2032
- Figure 42: Asia Pacific MEMS for the Mobile Devices Industry Volume Share (%), by Type of Sensor 2024 & 2032
- Figure 43: Asia Pacific MEMS for the Mobile Devices Industry Revenue (Million), by Country 2024 & 2032
- Figure 44: Asia Pacific MEMS for the Mobile Devices Industry Volume (K Unit), by Country 2024 & 2032
- Figure 45: Asia Pacific MEMS for the Mobile Devices Industry Revenue Share (%), by Country 2024 & 2032
- Figure 46: Asia Pacific MEMS for the Mobile Devices Industry Volume Share (%), by Country 2024 & 2032
- Figure 47: Latin America MEMS for the Mobile Devices Industry Revenue (Million), by Type of Sensor 2024 & 2032
- Figure 48: Latin America MEMS for the Mobile Devices Industry Volume (K Unit), by Type of Sensor 2024 & 2032
- Figure 49: Latin America MEMS for the Mobile Devices Industry Revenue Share (%), by Type of Sensor 2024 & 2032
- Figure 50: Latin America MEMS for the Mobile Devices Industry Volume Share (%), by Type of Sensor 2024 & 2032
- Figure 51: Latin America MEMS for the Mobile Devices Industry Revenue (Million), by Country 2024 & 2032
- Figure 52: Latin America MEMS for the Mobile Devices Industry Volume (K Unit), by Country 2024 & 2032
- Figure 53: Latin America MEMS for the Mobile Devices Industry Revenue Share (%), by Country 2024 & 2032
- Figure 54: Latin America MEMS for the Mobile Devices Industry Volume Share (%), by Country 2024 & 2032
- Figure 55: Middle East and Africa MEMS for the Mobile Devices Industry Revenue (Million), by Type of Sensor 2024 & 2032
- Figure 56: Middle East and Africa MEMS for the Mobile Devices Industry Volume (K Unit), by Type of Sensor 2024 & 2032
- Figure 57: Middle East and Africa MEMS for the Mobile Devices Industry Revenue Share (%), by Type of Sensor 2024 & 2032
- Figure 58: Middle East and Africa MEMS for the Mobile Devices Industry Volume Share (%), by Type of Sensor 2024 & 2032
- Figure 59: Middle East and Africa MEMS for the Mobile Devices Industry Revenue (Million), by Country 2024 & 2032
- Figure 60: Middle East and Africa MEMS for the Mobile Devices Industry Volume (K Unit), by Country 2024 & 2032
- Figure 61: Middle East and Africa MEMS for the Mobile Devices Industry Revenue Share (%), by Country 2024 & 2032
- Figure 62: Middle East and Africa MEMS for the Mobile Devices Industry Volume Share (%), by Country 2024 & 2032
List of Tables
- Table 1: Global MEMS for the Mobile Devices Industry Revenue Million Forecast, by Region 2019 & 2032
- Table 2: Global MEMS for the Mobile Devices Industry Volume K Unit Forecast, by Region 2019 & 2032
- Table 3: Global MEMS for the Mobile Devices Industry Revenue Million Forecast, by Type of Sensor 2019 & 2032
- Table 4: Global MEMS for the Mobile Devices Industry Volume K Unit Forecast, by Type of Sensor 2019 & 2032
- Table 5: Global MEMS for the Mobile Devices Industry Revenue Million Forecast, by Region 2019 & 2032
- Table 6: Global MEMS for the Mobile Devices Industry Volume K Unit Forecast, by Region 2019 & 2032
- Table 7: Global MEMS for the Mobile Devices Industry Revenue Million Forecast, by Country 2019 & 2032
- Table 8: Global MEMS for the Mobile Devices Industry Volume K Unit Forecast, by Country 2019 & 2032
- Table 9: United States MEMS for the Mobile Devices Industry Revenue (Million) Forecast, by Application 2019 & 2032
- Table 10: United States MEMS for the Mobile Devices Industry Volume (K Unit) Forecast, by Application 2019 & 2032
- Table 11: Canada MEMS for the Mobile Devices Industry Revenue (Million) Forecast, by Application 2019 & 2032
- Table 12: Canada MEMS for the Mobile Devices Industry Volume (K Unit) Forecast, by Application 2019 & 2032
- Table 13: Mexico MEMS for the Mobile Devices Industry Revenue (Million) Forecast, by Application 2019 & 2032
- Table 14: Mexico MEMS for the Mobile Devices Industry Volume (K Unit) Forecast, by Application 2019 & 2032
- Table 15: Global MEMS for the Mobile Devices Industry Revenue Million Forecast, by Country 2019 & 2032
- Table 16: Global MEMS for the Mobile Devices Industry Volume K Unit Forecast, by Country 2019 & 2032
- Table 17: Germany MEMS for the Mobile Devices Industry Revenue (Million) Forecast, by Application 2019 & 2032
- Table 18: Germany MEMS for the Mobile Devices Industry Volume (K Unit) Forecast, by Application 2019 & 2032
- Table 19: United Kingdom MEMS for the Mobile Devices Industry Revenue (Million) Forecast, by Application 2019 & 2032
- Table 20: United Kingdom MEMS for the Mobile Devices Industry Volume (K Unit) Forecast, by Application 2019 & 2032
- Table 21: France MEMS for the Mobile Devices Industry Revenue (Million) Forecast, by Application 2019 & 2032
- Table 22: France MEMS for the Mobile Devices Industry Volume (K Unit) Forecast, by Application 2019 & 2032
- Table 23: Spain MEMS for the Mobile Devices Industry Revenue (Million) Forecast, by Application 2019 & 2032
- Table 24: Spain MEMS for the Mobile Devices Industry Volume (K Unit) Forecast, by Application 2019 & 2032
- Table 25: Italy MEMS for the Mobile Devices Industry Revenue (Million) Forecast, by Application 2019 & 2032
- Table 26: Italy MEMS for the Mobile Devices Industry Volume (K Unit) Forecast, by Application 2019 & 2032
- Table 27: Spain MEMS for the Mobile Devices Industry Revenue (Million) Forecast, by Application 2019 & 2032
- Table 28: Spain MEMS for the Mobile Devices Industry Volume (K Unit) Forecast, by Application 2019 & 2032
- Table 29: Belgium MEMS for the Mobile Devices Industry Revenue (Million) Forecast, by Application 2019 & 2032
- Table 30: Belgium MEMS for the Mobile Devices Industry Volume (K Unit) Forecast, by Application 2019 & 2032
- Table 31: Netherland MEMS for the Mobile Devices Industry Revenue (Million) Forecast, by Application 2019 & 2032
- Table 32: Netherland MEMS for the Mobile Devices Industry Volume (K Unit) Forecast, by Application 2019 & 2032
- Table 33: Nordics MEMS for the Mobile Devices Industry Revenue (Million) Forecast, by Application 2019 & 2032
- Table 34: Nordics MEMS for the Mobile Devices Industry Volume (K Unit) Forecast, by Application 2019 & 2032
- Table 35: Rest of Europe MEMS for the Mobile Devices Industry Revenue (Million) Forecast, by Application 2019 & 2032
- Table 36: Rest of Europe MEMS for the Mobile Devices Industry Volume (K Unit) Forecast, by Application 2019 & 2032
- Table 37: Global MEMS for the Mobile Devices Industry Revenue Million Forecast, by Country 2019 & 2032
- Table 38: Global MEMS for the Mobile Devices Industry Volume K Unit Forecast, by Country 2019 & 2032
- Table 39: China MEMS for the Mobile Devices Industry Revenue (Million) Forecast, by Application 2019 & 2032
- Table 40: China MEMS for the Mobile Devices Industry Volume (K Unit) Forecast, by Application 2019 & 2032
- Table 41: Japan MEMS for the Mobile Devices Industry Revenue (Million) Forecast, by Application 2019 & 2032
- Table 42: Japan MEMS for the Mobile Devices Industry Volume (K Unit) Forecast, by Application 2019 & 2032
- Table 43: India MEMS for the Mobile Devices Industry Revenue (Million) Forecast, by Application 2019 & 2032
- Table 44: India MEMS for the Mobile Devices Industry Volume (K Unit) Forecast, by Application 2019 & 2032
- Table 45: South Korea MEMS for the Mobile Devices Industry Revenue (Million) Forecast, by Application 2019 & 2032
- Table 46: South Korea MEMS for the Mobile Devices Industry Volume (K Unit) Forecast, by Application 2019 & 2032
- Table 47: Southeast Asia MEMS for the Mobile Devices Industry Revenue (Million) Forecast, by Application 2019 & 2032
- Table 48: Southeast Asia MEMS for the Mobile Devices Industry Volume (K Unit) Forecast, by Application 2019 & 2032
- Table 49: Australia MEMS for the Mobile Devices Industry Revenue (Million) Forecast, by Application 2019 & 2032
- Table 50: Australia MEMS for the Mobile Devices Industry Volume (K Unit) Forecast, by Application 2019 & 2032
- Table 51: Indonesia MEMS for the Mobile Devices Industry Revenue (Million) Forecast, by Application 2019 & 2032
- Table 52: Indonesia MEMS for the Mobile Devices Industry Volume (K Unit) Forecast, by Application 2019 & 2032
- Table 53: Phillipes MEMS for the Mobile Devices Industry Revenue (Million) Forecast, by Application 2019 & 2032
- Table 54: Phillipes MEMS for the Mobile Devices Industry Volume (K Unit) Forecast, by Application 2019 & 2032
- Table 55: Singapore MEMS for the Mobile Devices Industry Revenue (Million) Forecast, by Application 2019 & 2032
- Table 56: Singapore MEMS for the Mobile Devices Industry Volume (K Unit) Forecast, by Application 2019 & 2032
- Table 57: Thailandc MEMS for the Mobile Devices Industry Revenue (Million) Forecast, by Application 2019 & 2032
- Table 58: Thailandc MEMS for the Mobile Devices Industry Volume (K Unit) Forecast, by Application 2019 & 2032
- Table 59: Rest of Asia Pacific MEMS for the Mobile Devices Industry Revenue (Million) Forecast, by Application 2019 & 2032
- Table 60: Rest of Asia Pacific MEMS for the Mobile Devices Industry Volume (K Unit) Forecast, by Application 2019 & 2032
- Table 61: Global MEMS for the Mobile Devices Industry Revenue Million Forecast, by Country 2019 & 2032
- Table 62: Global MEMS for the Mobile Devices Industry Volume K Unit Forecast, by Country 2019 & 2032
- Table 63: Brazil MEMS for the Mobile Devices Industry Revenue (Million) Forecast, by Application 2019 & 2032
- Table 64: Brazil MEMS for the Mobile Devices Industry Volume (K Unit) Forecast, by Application 2019 & 2032
- Table 65: Argentina MEMS for the Mobile Devices Industry Revenue (Million) Forecast, by Application 2019 & 2032
- Table 66: Argentina MEMS for the Mobile Devices Industry Volume (K Unit) Forecast, by Application 2019 & 2032
- Table 67: Peru MEMS for the Mobile Devices Industry Revenue (Million) Forecast, by Application 2019 & 2032
- Table 68: Peru MEMS for the Mobile Devices Industry Volume (K Unit) Forecast, by Application 2019 & 2032
- Table 69: Chile MEMS for the Mobile Devices Industry Revenue (Million) Forecast, by Application 2019 & 2032
- Table 70: Chile MEMS for the Mobile Devices Industry Volume (K Unit) Forecast, by Application 2019 & 2032
- Table 71: Colombia MEMS for the Mobile Devices Industry Revenue (Million) Forecast, by Application 2019 & 2032
- Table 72: Colombia MEMS for the Mobile Devices Industry Volume (K Unit) Forecast, by Application 2019 & 2032
- Table 73: Ecuador MEMS for the Mobile Devices Industry Revenue (Million) Forecast, by Application 2019 & 2032
- Table 74: Ecuador MEMS for the Mobile Devices Industry Volume (K Unit) Forecast, by Application 2019 & 2032
- Table 75: Venezuela MEMS for the Mobile Devices Industry Revenue (Million) Forecast, by Application 2019 & 2032
- Table 76: Venezuela MEMS for the Mobile Devices Industry Volume (K Unit) Forecast, by Application 2019 & 2032
- Table 77: Rest of South America MEMS for the Mobile Devices Industry Revenue (Million) Forecast, by Application 2019 & 2032
- Table 78: Rest of South America MEMS for the Mobile Devices Industry Volume (K Unit) Forecast, by Application 2019 & 2032
- Table 79: Global MEMS for the Mobile Devices Industry Revenue Million Forecast, by Country 2019 & 2032
- Table 80: Global MEMS for the Mobile Devices Industry Volume K Unit Forecast, by Country 2019 & 2032
- Table 81: United Arab Emirates MEMS for the Mobile Devices Industry Revenue (Million) Forecast, by Application 2019 & 2032
- Table 82: United Arab Emirates MEMS for the Mobile Devices Industry Volume (K Unit) Forecast, by Application 2019 & 2032
- Table 83: Saudi Arabia MEMS for the Mobile Devices Industry Revenue (Million) Forecast, by Application 2019 & 2032
- Table 84: Saudi Arabia MEMS for the Mobile Devices Industry Volume (K Unit) Forecast, by Application 2019 & 2032
- Table 85: South Africa MEMS for the Mobile Devices Industry Revenue (Million) Forecast, by Application 2019 & 2032
- Table 86: South Africa MEMS for the Mobile Devices Industry Volume (K Unit) Forecast, by Application 2019 & 2032
- Table 87: Rest of Middle East and Africa MEMS for the Mobile Devices Industry Revenue (Million) Forecast, by Application 2019 & 2032
- Table 88: Rest of Middle East and Africa MEMS for the Mobile Devices Industry Volume (K Unit) Forecast, by Application 2019 & 2032
- Table 89: Global MEMS for the Mobile Devices Industry Revenue Million Forecast, by Type of Sensor 2019 & 2032
- Table 90: Global MEMS for the Mobile Devices Industry Volume K Unit Forecast, by Type of Sensor 2019 & 2032
- Table 91: Global MEMS for the Mobile Devices Industry Revenue Million Forecast, by Country 2019 & 2032
- Table 92: Global MEMS for the Mobile Devices Industry Volume K Unit Forecast, by Country 2019 & 2032
- Table 93: Global MEMS for the Mobile Devices Industry Revenue Million Forecast, by Type of Sensor 2019 & 2032
- Table 94: Global MEMS for the Mobile Devices Industry Volume K Unit Forecast, by Type of Sensor 2019 & 2032
- Table 95: Global MEMS for the Mobile Devices Industry Revenue Million Forecast, by Country 2019 & 2032
- Table 96: Global MEMS for the Mobile Devices Industry Volume K Unit Forecast, by Country 2019 & 2032
- Table 97: Global MEMS for the Mobile Devices Industry Revenue Million Forecast, by Type of Sensor 2019 & 2032
- Table 98: Global MEMS for the Mobile Devices Industry Volume K Unit Forecast, by Type of Sensor 2019 & 2032
- Table 99: Global MEMS for the Mobile Devices Industry Revenue Million Forecast, by Country 2019 & 2032
- Table 100: Global MEMS for the Mobile Devices Industry Volume K Unit Forecast, by Country 2019 & 2032
- Table 101: Global MEMS for the Mobile Devices Industry Revenue Million Forecast, by Type of Sensor 2019 & 2032
- Table 102: Global MEMS for the Mobile Devices Industry Volume K Unit Forecast, by Type of Sensor 2019 & 2032
- Table 103: Global MEMS for the Mobile Devices Industry Revenue Million Forecast, by Country 2019 & 2032
- Table 104: Global MEMS for the Mobile Devices Industry Volume K Unit Forecast, by Country 2019 & 2032
- Table 105: Global MEMS for the Mobile Devices Industry Revenue Million Forecast, by Type of Sensor 2019 & 2032
- Table 106: Global MEMS for the Mobile Devices Industry Volume K Unit Forecast, by Type of Sensor 2019 & 2032
- Table 107: Global MEMS for the Mobile Devices Industry Revenue Million Forecast, by Country 2019 & 2032
- Table 108: Global MEMS for the Mobile Devices Industry Volume K Unit Forecast, by Country 2019 & 2032
Frequently Asked Questions
1. What is the projected Compound Annual Growth Rate (CAGR) of the MEMS for the Mobile Devices Industry?
The projected CAGR is approximately 8.80%.
2. Which companies are prominent players in the MEMS for the Mobile Devices Industry?
Key companies in the market include Knowles Corporation, AAC Technologies, InvenSense Inc (TDK), MEMSIC Inc, Goertek Inc, Bosch Sensortec GmbH, Murata Manufacturing, STMicroelectronics NV, Analog Devices Inc, BSE Co Ltd.
3. What are the main segments of the MEMS for the Mobile Devices Industry?
The market segments include Type of Sensor.
4. Can you provide details about the market size?
The market size is estimated to be USD 9.38 Million as of 2022.
5. What are some drivers contributing to market growth?
Increasing Acceptance of Miniaturization Trend; Increasing Demand for High-Performance Devices.
6. What are the notable trends driving market growth?
Increasing Acceptance of Miniaturization Trend to Drive the Market.
7. Are there any restraints impacting market growth?
Highly Complex Manufacturing Process and Demanding Cycle Time; Lack of Standardized Fabrication Process.
8. Can you provide examples of recent developments in the market?
December 2022: Knowles introduced new balanced armatures and MEMS microphones for over-the-counter hearing aids. The new product released provides performance and design flexibility to help speed up the production of hearing health products. Three full-range balanced armature receivers and two updated MEMS microphones will meet the stringent design and acoustic performance requirements of hearing aids.
9. What pricing options are available for accessing the report?
Pricing options include single-user, multi-user, and enterprise licenses priced at USD 4750, USD 5250, and USD 8750 respectively.
10. Is the market size provided in terms of value or volume?
The market size is provided in terms of value, measured in Million and volume, measured in K Unit.
11. Are there any specific market keywords associated with the report?
Yes, the market keyword associated with the report is "MEMS for the Mobile Devices Industry," which aids in identifying and referencing the specific market segment covered.
12. How do I determine which pricing option suits my needs best?
The pricing options vary based on user requirements and access needs. Individual users may opt for single-user licenses, while businesses requiring broader access may choose multi-user or enterprise licenses for cost-effective access to the report.
13. Are there any additional resources or data provided in the MEMS for the Mobile Devices Industry report?
While the report offers comprehensive insights, it's advisable to review the specific contents or supplementary materials provided to ascertain if additional resources or data are available.
14. How can I stay updated on further developments or reports in the MEMS for the Mobile Devices Industry?
To stay informed about further developments, trends, and reports in the MEMS for the Mobile Devices Industry, consider subscribing to industry newsletters, following relevant companies and organizations, or regularly checking reputable industry news sources and publications.
Methodology
Step 1 - Identification of Relevant Samples Size from Population Database


Step 2 - Approaches for Defining Global Market Size (Value, Volume* & Price*)

Note*: In applicable scenarios
Step 3 - Data Sources
Primary Research
- Web Analytics
- Survey Reports
- Research Institute
- Latest Research Reports
- Opinion Leaders
Secondary Research
- Annual Reports
- White Paper
- Latest Press Release
- Industry Association
- Paid Database
- Investor Presentations

Step 4 - Data Triangulation
Involves using different sources of information in order to increase the validity of a study
These sources are likely to be stakeholders in a program - participants, other researchers, program staff, other community members, and so on.
Then we put all data in single framework & apply various statistical tools to find out the dynamic on the market.
During the analysis stage, feedback from the stakeholder groups would be compared to determine areas of agreement as well as areas of divergence
