

Key Insights
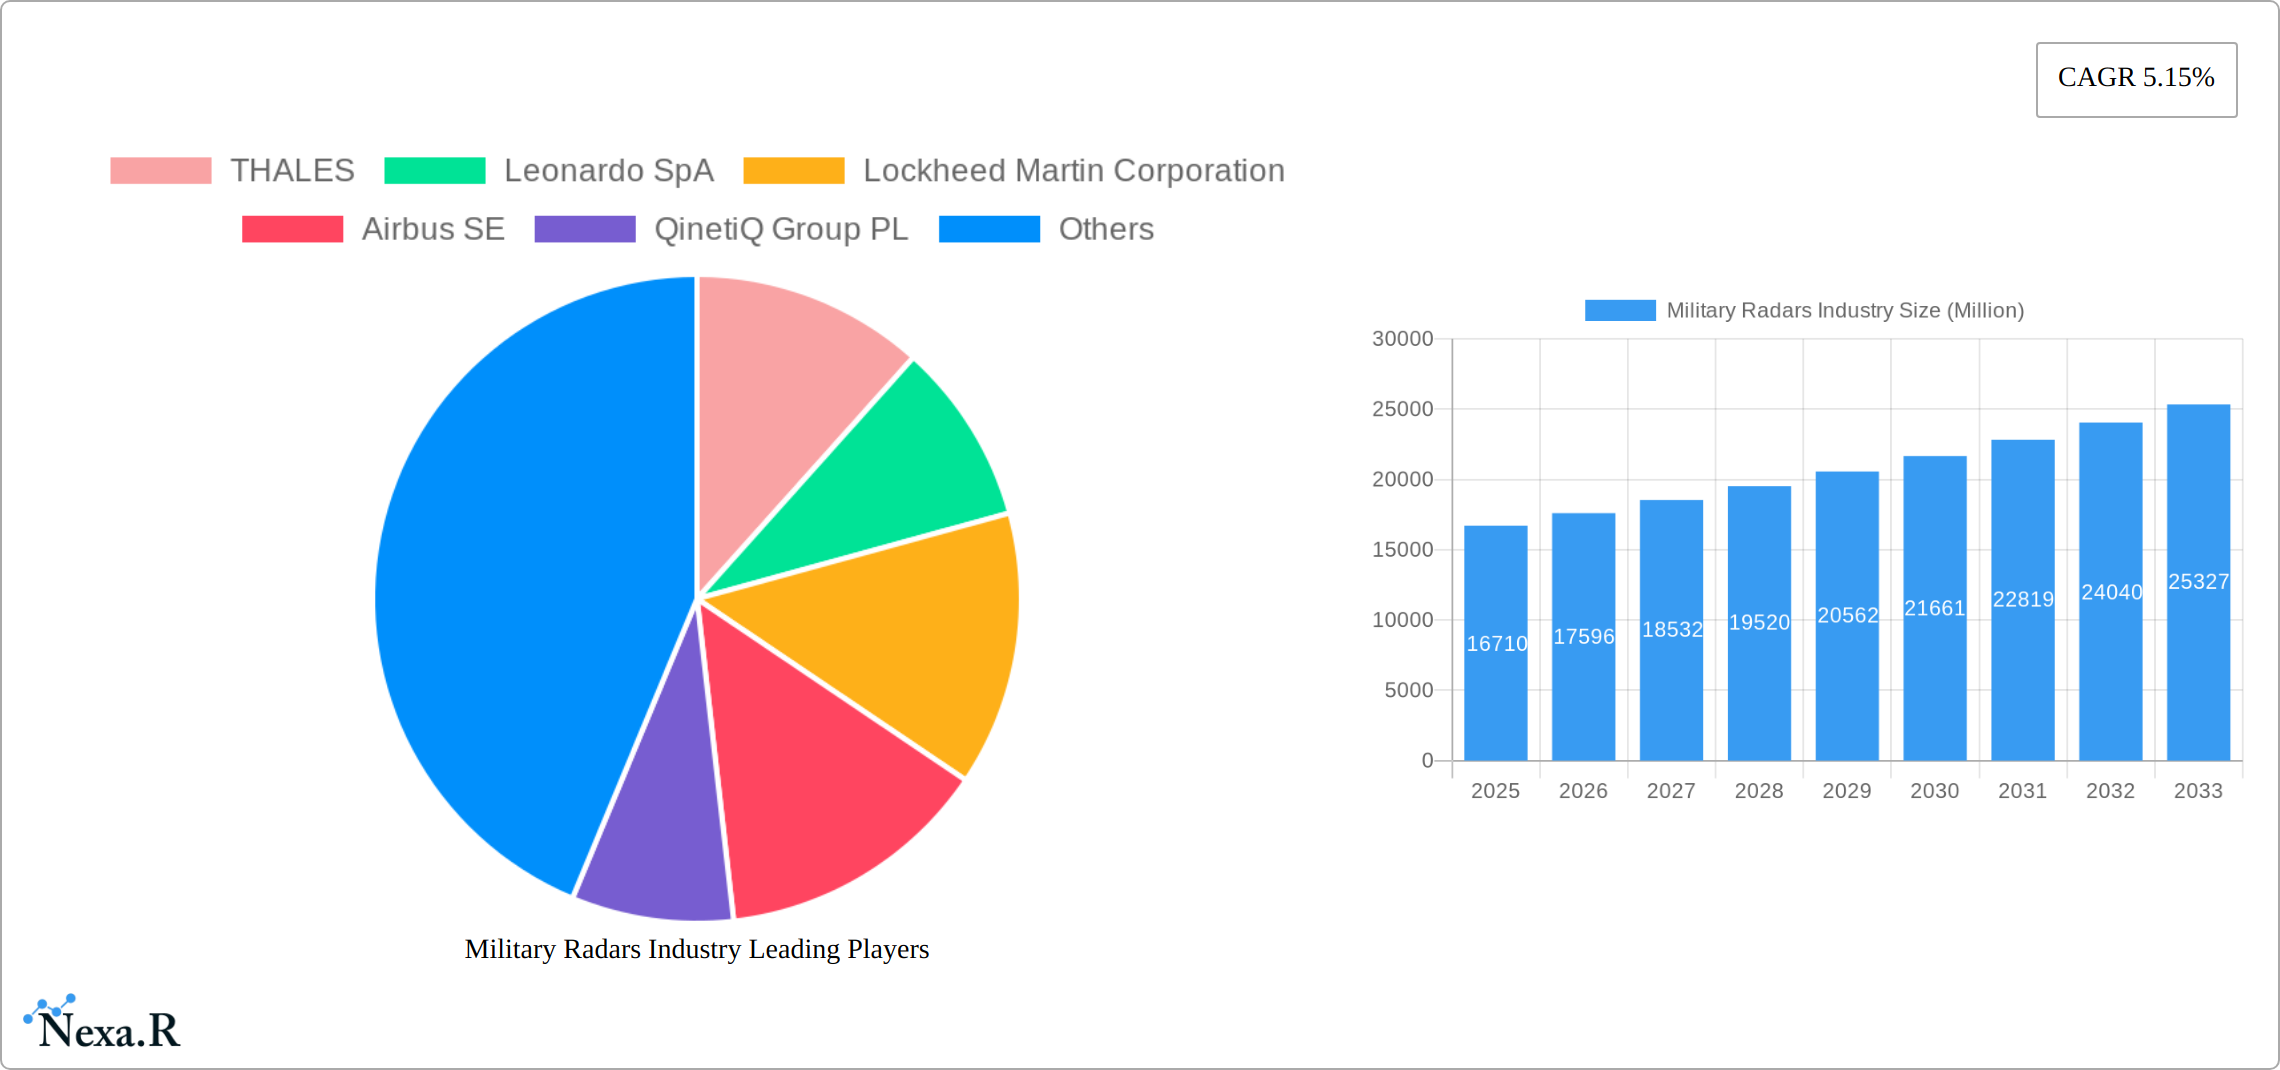
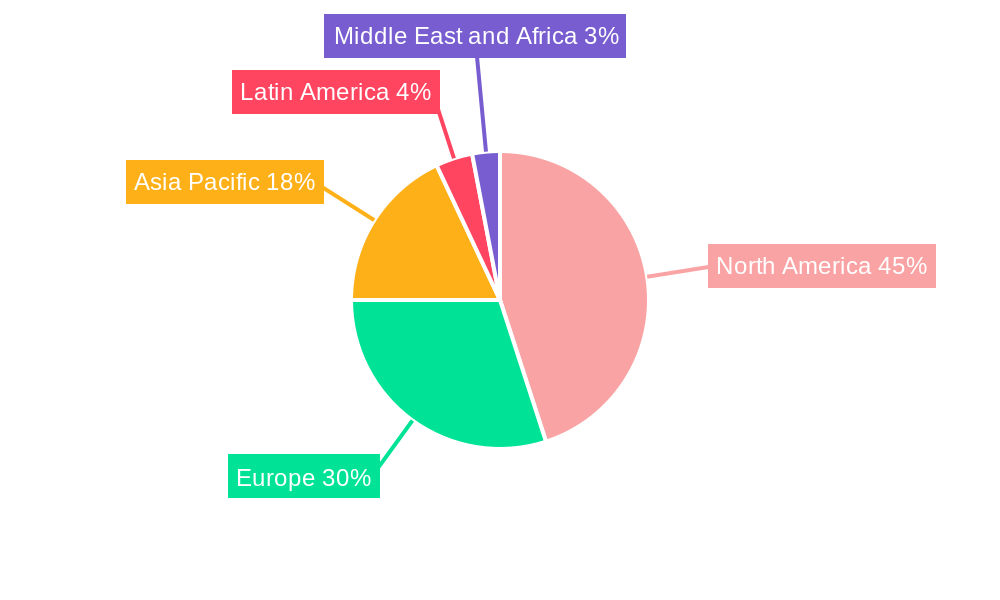
The military radar market, valued at $16.71 billion in 2025, is projected to experience robust growth, driven by escalating geopolitical tensions, modernization of armed forces globally, and the increasing demand for advanced surveillance and defense systems. A Compound Annual Growth Rate (CAGR) of 5.15% from 2025 to 2033 indicates a significant market expansion, reaching an estimated value exceeding $26 billion by 2033. Key drivers include the continuous development of sophisticated radar technologies like AESA (Active Electronically Scanned Array) radars offering enhanced capabilities in target detection, tracking, and identification. Furthermore, the growing adoption of unmanned aerial vehicles (UAVs) and the need for effective counter-drone technologies are fueling demand for miniaturized and high-performance radar systems. The market is segmented across various platforms (ground-based, naval, airborne, and space) and applications, including air and missile defense, ISR (Intelligence, Surveillance, and Reconnaissance), navigation and weapon guidance, and space situational awareness. Competition is intense, with major players like Thales, Leonardo SpA, Lockheed Martin, and Airbus vying for market share through technological innovation and strategic partnerships. Geographic distribution reveals North America and Europe as currently dominant regions, however, the Asia-Pacific region is poised for significant growth due to substantial investments in defense modernization by several nations in the region. Technological advancements in areas such as AI-powered radar signal processing and improved integration with other defense systems will shape future market growth.
The restraints on market growth primarily include high development and deployment costs associated with advanced radar technologies, along with stringent regulatory approvals and compliance requirements. However, the increasing focus on collaborative research and development initiatives between government agencies and private companies, along with the adoption of cost-effective manufacturing processes, are expected to mitigate these challenges. The segment showing the fastest growth is likely to be AESA radar technology due to its superior performance and increasing affordability. The airborne segment is also expected to perform well, driven by the continued growth in military aviation and the increasing sophistication of aerial warfare. Understanding these dynamics is crucial for stakeholders to capitalize on emerging opportunities within this dynamic and expanding market.
Military Radars Industry Market Report: 2019-2033
This comprehensive report provides a detailed analysis of the Military Radars industry, encompassing market dynamics, growth trends, regional dominance, product landscape, key players, and future outlook. The report covers the period from 2019 to 2033, with a focus on the forecast period from 2025 to 2033, using 2025 as the base year. The parent market is the defense and aerospace industry, while the child market is military radar systems. The total market size in 2025 is estimated at xx Million.
Military Radars Industry Market Dynamics & Structure
The Military Radars industry is characterized by a moderately concentrated market structure, with a few major players holding significant market share. Technological innovation, driven by advancements in signal processing, AI, and miniaturization, is a key driver of growth. Stringent regulatory frameworks governing defense technology development and procurement influence market dynamics. Competitive product substitutes, such as electronic warfare systems, exist but do not directly replace the core functionalities of military radars. End-user demographics, primarily military branches and government agencies, shape demand patterns. Mergers and acquisitions (M&A) activity is moderate, reflecting consolidation trends within the industry.
- Market Concentration: High (Top 5 players hold approximately xx% market share in 2025).
- Technological Innovation: Significant advancements in AESA (Active Electronically Scanned Array) technology, AI-powered signal processing, and miniaturization.
- Regulatory Framework: Stringent export controls and security certifications influence market access.
- M&A Activity: Moderate, with xx major deals recorded between 2019 and 2024.
- Innovation Barriers: High R&D costs, stringent testing and certification requirements, and long procurement cycles.
Military Radars Industry Growth Trends & Insights
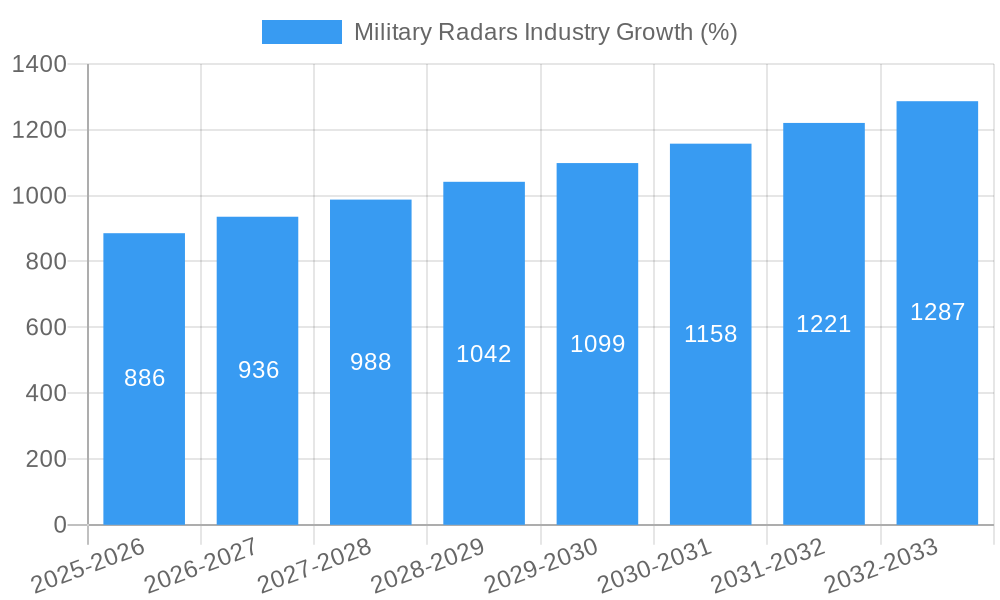
The Military Radars market experienced significant growth during the historical period (2019-2024), with a CAGR of xx%. This growth is attributed to increasing defense budgets globally, modernization of military equipment, and heightened geopolitical tensions. The market is expected to continue its growth trajectory during the forecast period (2025-2033), driven by the adoption of advanced radar technologies, the demand for enhanced situational awareness, and increasing focus on air and missile defense systems. Technological disruptions, such as the integration of AI and machine learning, are transforming the radar landscape, enhancing accuracy, range, and processing capabilities. Consumer behavior, driven by evolving military requirements and technological advancements, is shifting towards more sophisticated and versatile radar systems.
- Market Size (2025): xx Million
- CAGR (2025-2033): xx%
- Market Penetration (2025): xx% in key regions
Dominant Regions, Countries, or Segments in Military Radars Industry
North America currently dominates the Military Radars market, followed by Europe and Asia-Pacific. Within the segments, the Air and Missile Defense application segment holds the largest market share, driven by increasing threats and modernization efforts. The Airborne platform segment is also a significant driver, fueled by the need for advanced surveillance and targeting capabilities. Ground-based radars continue to be important for early warning and air defense systems.
- Leading Region: North America (xx% market share in 2025)
- Key Drivers in North America: High defense spending, technological leadership, and strong domestic industry.
- High-Growth Segment: Air and Missile Defense (xx% market share in 2025)
- Fastest-Growing Platform: Airborne (xx% CAGR during 2025-2033)
Military Radars Industry Product Landscape
The Military Radars industry offers a diverse range of products, including ground-based, naval, airborne, and space-based systems. These radars vary in frequency, power, and functionality, catering to diverse military applications. Recent product innovations focus on AESA technology, enhanced signal processing, and improved integration with other military systems. Key selling propositions include increased detection range, improved accuracy, and reduced susceptibility to jamming. Technological advancements are driven by miniaturization, increased processing power, and the integration of AI/ML.
Key Drivers, Barriers & Challenges in Military Radars Industry
Key Drivers: Increased defense spending, modernization of military infrastructure, technological advancements (AESA, AI), growing geopolitical instability.
Key Challenges: High R&D costs, complex integration processes, stringent regulatory approvals, supply chain disruptions (impact on delivery timelines and costs estimated at xx Million annually), competitive landscape.
Emerging Opportunities in Military Radars Industry
Emerging opportunities lie in the development of next-generation radars incorporating AI and machine learning, integration with unmanned systems, and expansion into emerging markets. The growing demand for space situational awareness and the development of hypersonic missile defense systems represent significant untapped potential. Increased focus on cybersecurity for radar systems also presents new avenues for growth.
Growth Accelerators in the Military Radars Industry Industry
Long-term growth will be fueled by continued technological advancements, strategic partnerships between defense contractors and technology companies, and expansion into new geographical markets. Government initiatives to modernize military capabilities and the increasing demand for enhanced situational awareness will further propel market growth.
Key Players Shaping the Military Radars Industry Market
- THALES
- Leonardo SpA
- Lockheed Martin Corporation
- Airbus SE
- QinetiQ Group PL
- Teledyne Technologies Incorporated
- BAE Systems PLC
- RTX Corporation
- HENSOLDT Holding Germany GmbH
- Israel Aerospace Industries Ltd
- Northrop Grumman Corporation
- Saab AB
Notable Milestones in Military Radars Industry Sector
- 2020: Launch of a new AESA radar system by Lockheed Martin.
- 2021: Acquisition of a radar technology company by Thales.
- 2022: Successful testing of a hypersonic missile defense radar by Raytheon (now RTX).
- 2023: Introduction of a new AI-powered signal processing technology by Leonardo SpA.
- 2024: Successful deployment of a space-based radar system by a major player (Name withheld due to confidentiality)
In-Depth Military Radars Industry Market Outlook
The Military Radars market is poised for robust growth in the coming years, driven by technological innovation, geopolitical factors, and increased defense spending. Strategic partnerships and M&A activity will further shape the market landscape. Companies focusing on advanced technologies, such as AI and AESA, and those with strong government relationships will be well-positioned to capitalize on future opportunities. The market's long-term growth trajectory is expected to be positive, with significant potential for expansion in diverse applications and geographical regions.
Military Radars Industry Segmentation
- 1. Production Analysis
- 2. Consumption Analysis
- 3. Import Market Analysis (Value & Volume)
- 4. Export Market Analysis (Value & Volume)
- 5. Price Trend Analysis
Military Radars Industry Segmentation By Geography
-
1. North America
- 1.1. United States
- 1.2. Canada
- 1.3. Mexico
-
2. South America
- 2.1. Brazil
- 2.2. Argentina
- 2.3. Rest of South America
-
3. Europe
- 3.1. United Kingdom
- 3.2. Germany
- 3.3. France
- 3.4. Italy
- 3.5. Spain
- 3.6. Russia
- 3.7. Benelux
- 3.8. Nordics
- 3.9. Rest of Europe
-
4. Middle East & Africa
- 4.1. Turkey
- 4.2. Israel
- 4.3. GCC
- 4.4. North Africa
- 4.5. South Africa
- 4.6. Rest of Middle East & Africa
-
5. Asia Pacific
- 5.1. China
- 5.2. India
- 5.3. Japan
- 5.4. South Korea
- 5.5. ASEAN
- 5.6. Oceania
- 5.7. Rest of Asia Pacific
Military Radars Industry REPORT HIGHLIGHTS
| Aspects | Details |
|---|---|
| Study Period | 2019-2033 |
| Base Year | 2024 |
| Estimated Year | 2025 |
| Forecast Period | 2025-2033 |
| Historical Period | 2019-2024 |
| Growth Rate | CAGR of 5.15% from 2019-2033 |
| Segmentation |
|
Table of Contents
- 1. Introduction
- 1.1. Research Scope
- 1.2. Market Segmentation
- 1.3. Research Methodology
- 1.4. Definitions and Assumptions
- 2. Executive Summary
- 2.1. Introduction
- 3. Market Dynamics
- 3.1. Introduction
- 3.2. Market Drivers
- 3.2.1. Increase in Internet of Things (IoT) and Autonomous Systems; Rise in Demand for Military and Defense Satellite Communication Solutions
- 3.3. Market Restrains
- 3.3.1. Cybersecurity Threats to Satellite Communication; Interference in Transmission of Data
- 3.4. Market Trends
- 3.4.1. Airborne Segment Expected to Register the Highest CAGR During the Forecast Period
- 4. Market Factor Analysis
- 4.1. Porters Five Forces
- 4.2. Supply/Value Chain
- 4.3. PESTEL analysis
- 4.4. Market Entropy
- 4.5. Patent/Trademark Analysis
- 5. Global Military Radars Industry Analysis, Insights and Forecast, 2019-2031
- 5.1. Market Analysis, Insights and Forecast - by Production Analysis
- 5.2. Market Analysis, Insights and Forecast - by Consumption Analysis
- 5.3. Market Analysis, Insights and Forecast - by Import Market Analysis (Value & Volume)
- 5.4. Market Analysis, Insights and Forecast - by Export Market Analysis (Value & Volume)
- 5.5. Market Analysis, Insights and Forecast - by Price Trend Analysis
- 5.6. Market Analysis, Insights and Forecast - by Region
- 5.6.1. North America
- 5.6.2. South America
- 5.6.3. Europe
- 5.6.4. Middle East & Africa
- 5.6.5. Asia Pacific
- 5.1. Market Analysis, Insights and Forecast - by Production Analysis
- 6. North America Military Radars Industry Analysis, Insights and Forecast, 2019-2031
- 6.1. Market Analysis, Insights and Forecast - by Production Analysis
- 6.2. Market Analysis, Insights and Forecast - by Consumption Analysis
- 6.3. Market Analysis, Insights and Forecast - by Import Market Analysis (Value & Volume)
- 6.4. Market Analysis, Insights and Forecast - by Export Market Analysis (Value & Volume)
- 6.5. Market Analysis, Insights and Forecast - by Price Trend Analysis
- 6.1. Market Analysis, Insights and Forecast - by Production Analysis
- 7. South America Military Radars Industry Analysis, Insights and Forecast, 2019-2031
- 7.1. Market Analysis, Insights and Forecast - by Production Analysis
- 7.2. Market Analysis, Insights and Forecast - by Consumption Analysis
- 7.3. Market Analysis, Insights and Forecast - by Import Market Analysis (Value & Volume)
- 7.4. Market Analysis, Insights and Forecast - by Export Market Analysis (Value & Volume)
- 7.5. Market Analysis, Insights and Forecast - by Price Trend Analysis
- 7.1. Market Analysis, Insights and Forecast - by Production Analysis
- 8. Europe Military Radars Industry Analysis, Insights and Forecast, 2019-2031
- 8.1. Market Analysis, Insights and Forecast - by Production Analysis
- 8.2. Market Analysis, Insights and Forecast - by Consumption Analysis
- 8.3. Market Analysis, Insights and Forecast - by Import Market Analysis (Value & Volume)
- 8.4. Market Analysis, Insights and Forecast - by Export Market Analysis (Value & Volume)
- 8.5. Market Analysis, Insights and Forecast - by Price Trend Analysis
- 8.1. Market Analysis, Insights and Forecast - by Production Analysis
- 9. Middle East & Africa Military Radars Industry Analysis, Insights and Forecast, 2019-2031
- 9.1. Market Analysis, Insights and Forecast - by Production Analysis
- 9.2. Market Analysis, Insights and Forecast - by Consumption Analysis
- 9.3. Market Analysis, Insights and Forecast - by Import Market Analysis (Value & Volume)
- 9.4. Market Analysis, Insights and Forecast - by Export Market Analysis (Value & Volume)
- 9.5. Market Analysis, Insights and Forecast - by Price Trend Analysis
- 9.1. Market Analysis, Insights and Forecast - by Production Analysis
- 10. Asia Pacific Military Radars Industry Analysis, Insights and Forecast, 2019-2031
- 10.1. Market Analysis, Insights and Forecast - by Production Analysis
- 10.2. Market Analysis, Insights and Forecast - by Consumption Analysis
- 10.3. Market Analysis, Insights and Forecast - by Import Market Analysis (Value & Volume)
- 10.4. Market Analysis, Insights and Forecast - by Export Market Analysis (Value & Volume)
- 10.5. Market Analysis, Insights and Forecast - by Price Trend Analysis
- 10.1. Market Analysis, Insights and Forecast - by Production Analysis
- 11. North America Military Radars Industry Analysis, Insights and Forecast, 2019-2031
- 11.1. Market Analysis, Insights and Forecast - By Country/Sub-region
- 11.1.1 United States
- 11.1.2 Canada
- 12. Europe Military Radars Industry Analysis, Insights and Forecast, 2019-2031
- 12.1. Market Analysis, Insights and Forecast - By Country/Sub-region
- 12.1.1 United Kingdom
- 12.1.2 Germany
- 12.1.3 France
- 12.1.4 Russia
- 12.1.5 Rest of Europe
- 13. Asia Pacific Military Radars Industry Analysis, Insights and Forecast, 2019-2031
- 13.1. Market Analysis, Insights and Forecast - By Country/Sub-region
- 13.1.1 China
- 13.1.2 India
- 13.1.3 Japan
- 13.1.4 South Korea
- 13.1.5 Rest of Asia Pacific
- 14. Latin America Military Radars Industry Analysis, Insights and Forecast, 2019-2031
- 14.1. Market Analysis, Insights and Forecast - By Country/Sub-region
- 14.1.1 Brazil
- 14.1.2 Rest of Latin America
- 15. Middle East and Africa Military Radars Industry Analysis, Insights and Forecast, 2019-2031
- 15.1. Market Analysis, Insights and Forecast - By Country/Sub-region
- 15.1.1 United Arab Emirates
- 15.1.2 Saudi Arabia
- 15.1.3 Egypt
- 15.1.4 Rest of Middle East and Africa
- 16. Competitive Analysis
- 16.1. Global Market Share Analysis 2024
- 16.2. Company Profiles
- 16.2.1 THALES
- 16.2.1.1. Overview
- 16.2.1.2. Products
- 16.2.1.3. SWOT Analysis
- 16.2.1.4. Recent Developments
- 16.2.1.5. Financials (Based on Availability)
- 16.2.2 Leonardo SpA
- 16.2.2.1. Overview
- 16.2.2.2. Products
- 16.2.2.3. SWOT Analysis
- 16.2.2.4. Recent Developments
- 16.2.2.5. Financials (Based on Availability)
- 16.2.3 Lockheed Martin Corporation
- 16.2.3.1. Overview
- 16.2.3.2. Products
- 16.2.3.3. SWOT Analysis
- 16.2.3.4. Recent Developments
- 16.2.3.5. Financials (Based on Availability)
- 16.2.4 Airbus SE
- 16.2.4.1. Overview
- 16.2.4.2. Products
- 16.2.4.3. SWOT Analysis
- 16.2.4.4. Recent Developments
- 16.2.4.5. Financials (Based on Availability)
- 16.2.5 QinetiQ Group PL
- 16.2.5.1. Overview
- 16.2.5.2. Products
- 16.2.5.3. SWOT Analysis
- 16.2.5.4. Recent Developments
- 16.2.5.5. Financials (Based on Availability)
- 16.2.6 Teledyne Technologies Incorporated
- 16.2.6.1. Overview
- 16.2.6.2. Products
- 16.2.6.3. SWOT Analysis
- 16.2.6.4. Recent Developments
- 16.2.6.5. Financials (Based on Availability)
- 16.2.7 BAE Systems PLC
- 16.2.7.1. Overview
- 16.2.7.2. Products
- 16.2.7.3. SWOT Analysis
- 16.2.7.4. Recent Developments
- 16.2.7.5. Financials (Based on Availability)
- 16.2.8 RTX Corporation
- 16.2.8.1. Overview
- 16.2.8.2. Products
- 16.2.8.3. SWOT Analysis
- 16.2.8.4. Recent Developments
- 16.2.8.5. Financials (Based on Availability)
- 16.2.9 HENSOLDT Holding Germany GmbH
- 16.2.9.1. Overview
- 16.2.9.2. Products
- 16.2.9.3. SWOT Analysis
- 16.2.9.4. Recent Developments
- 16.2.9.5. Financials (Based on Availability)
- 16.2.10 Israel Aerospace Industries Ltd
- 16.2.10.1. Overview
- 16.2.10.2. Products
- 16.2.10.3. SWOT Analysis
- 16.2.10.4. Recent Developments
- 16.2.10.5. Financials (Based on Availability)
- 16.2.11 Northrop Grumman Corporation
- 16.2.11.1. Overview
- 16.2.11.2. Products
- 16.2.11.3. SWOT Analysis
- 16.2.11.4. Recent Developments
- 16.2.11.5. Financials (Based on Availability)
- 16.2.12 Saab AB
- 16.2.12.1. Overview
- 16.2.12.2. Products
- 16.2.12.3. SWOT Analysis
- 16.2.12.4. Recent Developments
- 16.2.12.5. Financials (Based on Availability)
- 16.2.1 THALES
List of Figures
- Figure 1: Global Military Radars Industry Revenue Breakdown (Million, %) by Region 2024 & 2032
- Figure 2: North America Military Radars Industry Revenue (Million), by Country 2024 & 2032
- Figure 3: North America Military Radars Industry Revenue Share (%), by Country 2024 & 2032
- Figure 4: Europe Military Radars Industry Revenue (Million), by Country 2024 & 2032
- Figure 5: Europe Military Radars Industry Revenue Share (%), by Country 2024 & 2032
- Figure 6: Asia Pacific Military Radars Industry Revenue (Million), by Country 2024 & 2032
- Figure 7: Asia Pacific Military Radars Industry Revenue Share (%), by Country 2024 & 2032
- Figure 8: Latin America Military Radars Industry Revenue (Million), by Country 2024 & 2032
- Figure 9: Latin America Military Radars Industry Revenue Share (%), by Country 2024 & 2032
- Figure 10: Middle East and Africa Military Radars Industry Revenue (Million), by Country 2024 & 2032
- Figure 11: Middle East and Africa Military Radars Industry Revenue Share (%), by Country 2024 & 2032
- Figure 12: North America Military Radars Industry Revenue (Million), by Production Analysis 2024 & 2032
- Figure 13: North America Military Radars Industry Revenue Share (%), by Production Analysis 2024 & 2032
- Figure 14: North America Military Radars Industry Revenue (Million), by Consumption Analysis 2024 & 2032
- Figure 15: North America Military Radars Industry Revenue Share (%), by Consumption Analysis 2024 & 2032
- Figure 16: North America Military Radars Industry Revenue (Million), by Import Market Analysis (Value & Volume) 2024 & 2032
- Figure 17: North America Military Radars Industry Revenue Share (%), by Import Market Analysis (Value & Volume) 2024 & 2032
- Figure 18: North America Military Radars Industry Revenue (Million), by Export Market Analysis (Value & Volume) 2024 & 2032
- Figure 19: North America Military Radars Industry Revenue Share (%), by Export Market Analysis (Value & Volume) 2024 & 2032
- Figure 20: North America Military Radars Industry Revenue (Million), by Price Trend Analysis 2024 & 2032
- Figure 21: North America Military Radars Industry Revenue Share (%), by Price Trend Analysis 2024 & 2032
- Figure 22: North America Military Radars Industry Revenue (Million), by Country 2024 & 2032
- Figure 23: North America Military Radars Industry Revenue Share (%), by Country 2024 & 2032
- Figure 24: South America Military Radars Industry Revenue (Million), by Production Analysis 2024 & 2032
- Figure 25: South America Military Radars Industry Revenue Share (%), by Production Analysis 2024 & 2032
- Figure 26: South America Military Radars Industry Revenue (Million), by Consumption Analysis 2024 & 2032
- Figure 27: South America Military Radars Industry Revenue Share (%), by Consumption Analysis 2024 & 2032
- Figure 28: South America Military Radars Industry Revenue (Million), by Import Market Analysis (Value & Volume) 2024 & 2032
- Figure 29: South America Military Radars Industry Revenue Share (%), by Import Market Analysis (Value & Volume) 2024 & 2032
- Figure 30: South America Military Radars Industry Revenue (Million), by Export Market Analysis (Value & Volume) 2024 & 2032
- Figure 31: South America Military Radars Industry Revenue Share (%), by Export Market Analysis (Value & Volume) 2024 & 2032
- Figure 32: South America Military Radars Industry Revenue (Million), by Price Trend Analysis 2024 & 2032
- Figure 33: South America Military Radars Industry Revenue Share (%), by Price Trend Analysis 2024 & 2032
- Figure 34: South America Military Radars Industry Revenue (Million), by Country 2024 & 2032
- Figure 35: South America Military Radars Industry Revenue Share (%), by Country 2024 & 2032
- Figure 36: Europe Military Radars Industry Revenue (Million), by Production Analysis 2024 & 2032
- Figure 37: Europe Military Radars Industry Revenue Share (%), by Production Analysis 2024 & 2032
- Figure 38: Europe Military Radars Industry Revenue (Million), by Consumption Analysis 2024 & 2032
- Figure 39: Europe Military Radars Industry Revenue Share (%), by Consumption Analysis 2024 & 2032
- Figure 40: Europe Military Radars Industry Revenue (Million), by Import Market Analysis (Value & Volume) 2024 & 2032
- Figure 41: Europe Military Radars Industry Revenue Share (%), by Import Market Analysis (Value & Volume) 2024 & 2032
- Figure 42: Europe Military Radars Industry Revenue (Million), by Export Market Analysis (Value & Volume) 2024 & 2032
- Figure 43: Europe Military Radars Industry Revenue Share (%), by Export Market Analysis (Value & Volume) 2024 & 2032
- Figure 44: Europe Military Radars Industry Revenue (Million), by Price Trend Analysis 2024 & 2032
- Figure 45: Europe Military Radars Industry Revenue Share (%), by Price Trend Analysis 2024 & 2032
- Figure 46: Europe Military Radars Industry Revenue (Million), by Country 2024 & 2032
- Figure 47: Europe Military Radars Industry Revenue Share (%), by Country 2024 & 2032
- Figure 48: Middle East & Africa Military Radars Industry Revenue (Million), by Production Analysis 2024 & 2032
- Figure 49: Middle East & Africa Military Radars Industry Revenue Share (%), by Production Analysis 2024 & 2032
- Figure 50: Middle East & Africa Military Radars Industry Revenue (Million), by Consumption Analysis 2024 & 2032
- Figure 51: Middle East & Africa Military Radars Industry Revenue Share (%), by Consumption Analysis 2024 & 2032
- Figure 52: Middle East & Africa Military Radars Industry Revenue (Million), by Import Market Analysis (Value & Volume) 2024 & 2032
- Figure 53: Middle East & Africa Military Radars Industry Revenue Share (%), by Import Market Analysis (Value & Volume) 2024 & 2032
- Figure 54: Middle East & Africa Military Radars Industry Revenue (Million), by Export Market Analysis (Value & Volume) 2024 & 2032
- Figure 55: Middle East & Africa Military Radars Industry Revenue Share (%), by Export Market Analysis (Value & Volume) 2024 & 2032
- Figure 56: Middle East & Africa Military Radars Industry Revenue (Million), by Price Trend Analysis 2024 & 2032
- Figure 57: Middle East & Africa Military Radars Industry Revenue Share (%), by Price Trend Analysis 2024 & 2032
- Figure 58: Middle East & Africa Military Radars Industry Revenue (Million), by Country 2024 & 2032
- Figure 59: Middle East & Africa Military Radars Industry Revenue Share (%), by Country 2024 & 2032
- Figure 60: Asia Pacific Military Radars Industry Revenue (Million), by Production Analysis 2024 & 2032
- Figure 61: Asia Pacific Military Radars Industry Revenue Share (%), by Production Analysis 2024 & 2032
- Figure 62: Asia Pacific Military Radars Industry Revenue (Million), by Consumption Analysis 2024 & 2032
- Figure 63: Asia Pacific Military Radars Industry Revenue Share (%), by Consumption Analysis 2024 & 2032
- Figure 64: Asia Pacific Military Radars Industry Revenue (Million), by Import Market Analysis (Value & Volume) 2024 & 2032
- Figure 65: Asia Pacific Military Radars Industry Revenue Share (%), by Import Market Analysis (Value & Volume) 2024 & 2032
- Figure 66: Asia Pacific Military Radars Industry Revenue (Million), by Export Market Analysis (Value & Volume) 2024 & 2032
- Figure 67: Asia Pacific Military Radars Industry Revenue Share (%), by Export Market Analysis (Value & Volume) 2024 & 2032
- Figure 68: Asia Pacific Military Radars Industry Revenue (Million), by Price Trend Analysis 2024 & 2032
- Figure 69: Asia Pacific Military Radars Industry Revenue Share (%), by Price Trend Analysis 2024 & 2032
- Figure 70: Asia Pacific Military Radars Industry Revenue (Million), by Country 2024 & 2032
- Figure 71: Asia Pacific Military Radars Industry Revenue Share (%), by Country 2024 & 2032
List of Tables
- Table 1: Global Military Radars Industry Revenue Million Forecast, by Region 2019 & 2032
- Table 2: Global Military Radars Industry Revenue Million Forecast, by Production Analysis 2019 & 2032
- Table 3: Global Military Radars Industry Revenue Million Forecast, by Consumption Analysis 2019 & 2032
- Table 4: Global Military Radars Industry Revenue Million Forecast, by Import Market Analysis (Value & Volume) 2019 & 2032
- Table 5: Global Military Radars Industry Revenue Million Forecast, by Export Market Analysis (Value & Volume) 2019 & 2032
- Table 6: Global Military Radars Industry Revenue Million Forecast, by Price Trend Analysis 2019 & 2032
- Table 7: Global Military Radars Industry Revenue Million Forecast, by Region 2019 & 2032
- Table 8: Global Military Radars Industry Revenue Million Forecast, by Country 2019 & 2032
- Table 9: United States Military Radars Industry Revenue (Million) Forecast, by Application 2019 & 2032
- Table 10: Canada Military Radars Industry Revenue (Million) Forecast, by Application 2019 & 2032
- Table 11: Global Military Radars Industry Revenue Million Forecast, by Country 2019 & 2032
- Table 12: United Kingdom Military Radars Industry Revenue (Million) Forecast, by Application 2019 & 2032
- Table 13: Germany Military Radars Industry Revenue (Million) Forecast, by Application 2019 & 2032
- Table 14: France Military Radars Industry Revenue (Million) Forecast, by Application 2019 & 2032
- Table 15: Russia Military Radars Industry Revenue (Million) Forecast, by Application 2019 & 2032
- Table 16: Rest of Europe Military Radars Industry Revenue (Million) Forecast, by Application 2019 & 2032
- Table 17: Global Military Radars Industry Revenue Million Forecast, by Country 2019 & 2032
- Table 18: China Military Radars Industry Revenue (Million) Forecast, by Application 2019 & 2032
- Table 19: India Military Radars Industry Revenue (Million) Forecast, by Application 2019 & 2032
- Table 20: Japan Military Radars Industry Revenue (Million) Forecast, by Application 2019 & 2032
- Table 21: South Korea Military Radars Industry Revenue (Million) Forecast, by Application 2019 & 2032
- Table 22: Rest of Asia Pacific Military Radars Industry Revenue (Million) Forecast, by Application 2019 & 2032
- Table 23: Global Military Radars Industry Revenue Million Forecast, by Country 2019 & 2032
- Table 24: Brazil Military Radars Industry Revenue (Million) Forecast, by Application 2019 & 2032
- Table 25: Rest of Latin America Military Radars Industry Revenue (Million) Forecast, by Application 2019 & 2032
- Table 26: Global Military Radars Industry Revenue Million Forecast, by Country 2019 & 2032
- Table 27: United Arab Emirates Military Radars Industry Revenue (Million) Forecast, by Application 2019 & 2032
- Table 28: Saudi Arabia Military Radars Industry Revenue (Million) Forecast, by Application 2019 & 2032
- Table 29: Egypt Military Radars Industry Revenue (Million) Forecast, by Application 2019 & 2032
- Table 30: Rest of Middle East and Africa Military Radars Industry Revenue (Million) Forecast, by Application 2019 & 2032
- Table 31: Global Military Radars Industry Revenue Million Forecast, by Production Analysis 2019 & 2032
- Table 32: Global Military Radars Industry Revenue Million Forecast, by Consumption Analysis 2019 & 2032
- Table 33: Global Military Radars Industry Revenue Million Forecast, by Import Market Analysis (Value & Volume) 2019 & 2032
- Table 34: Global Military Radars Industry Revenue Million Forecast, by Export Market Analysis (Value & Volume) 2019 & 2032
- Table 35: Global Military Radars Industry Revenue Million Forecast, by Price Trend Analysis 2019 & 2032
- Table 36: Global Military Radars Industry Revenue Million Forecast, by Country 2019 & 2032
- Table 37: United States Military Radars Industry Revenue (Million) Forecast, by Application 2019 & 2032
- Table 38: Canada Military Radars Industry Revenue (Million) Forecast, by Application 2019 & 2032
- Table 39: Mexico Military Radars Industry Revenue (Million) Forecast, by Application 2019 & 2032
- Table 40: Global Military Radars Industry Revenue Million Forecast, by Production Analysis 2019 & 2032
- Table 41: Global Military Radars Industry Revenue Million Forecast, by Consumption Analysis 2019 & 2032
- Table 42: Global Military Radars Industry Revenue Million Forecast, by Import Market Analysis (Value & Volume) 2019 & 2032
- Table 43: Global Military Radars Industry Revenue Million Forecast, by Export Market Analysis (Value & Volume) 2019 & 2032
- Table 44: Global Military Radars Industry Revenue Million Forecast, by Price Trend Analysis 2019 & 2032
- Table 45: Global Military Radars Industry Revenue Million Forecast, by Country 2019 & 2032
- Table 46: Brazil Military Radars Industry Revenue (Million) Forecast, by Application 2019 & 2032
- Table 47: Argentina Military Radars Industry Revenue (Million) Forecast, by Application 2019 & 2032
- Table 48: Rest of South America Military Radars Industry Revenue (Million) Forecast, by Application 2019 & 2032
- Table 49: Global Military Radars Industry Revenue Million Forecast, by Production Analysis 2019 & 2032
- Table 50: Global Military Radars Industry Revenue Million Forecast, by Consumption Analysis 2019 & 2032
- Table 51: Global Military Radars Industry Revenue Million Forecast, by Import Market Analysis (Value & Volume) 2019 & 2032
- Table 52: Global Military Radars Industry Revenue Million Forecast, by Export Market Analysis (Value & Volume) 2019 & 2032
- Table 53: Global Military Radars Industry Revenue Million Forecast, by Price Trend Analysis 2019 & 2032
- Table 54: Global Military Radars Industry Revenue Million Forecast, by Country 2019 & 2032
- Table 55: United Kingdom Military Radars Industry Revenue (Million) Forecast, by Application 2019 & 2032
- Table 56: Germany Military Radars Industry Revenue (Million) Forecast, by Application 2019 & 2032
- Table 57: France Military Radars Industry Revenue (Million) Forecast, by Application 2019 & 2032
- Table 58: Italy Military Radars Industry Revenue (Million) Forecast, by Application 2019 & 2032
- Table 59: Spain Military Radars Industry Revenue (Million) Forecast, by Application 2019 & 2032
- Table 60: Russia Military Radars Industry Revenue (Million) Forecast, by Application 2019 & 2032
- Table 61: Benelux Military Radars Industry Revenue (Million) Forecast, by Application 2019 & 2032
- Table 62: Nordics Military Radars Industry Revenue (Million) Forecast, by Application 2019 & 2032
- Table 63: Rest of Europe Military Radars Industry Revenue (Million) Forecast, by Application 2019 & 2032
- Table 64: Global Military Radars Industry Revenue Million Forecast, by Production Analysis 2019 & 2032
- Table 65: Global Military Radars Industry Revenue Million Forecast, by Consumption Analysis 2019 & 2032
- Table 66: Global Military Radars Industry Revenue Million Forecast, by Import Market Analysis (Value & Volume) 2019 & 2032
- Table 67: Global Military Radars Industry Revenue Million Forecast, by Export Market Analysis (Value & Volume) 2019 & 2032
- Table 68: Global Military Radars Industry Revenue Million Forecast, by Price Trend Analysis 2019 & 2032
- Table 69: Global Military Radars Industry Revenue Million Forecast, by Country 2019 & 2032
- Table 70: Turkey Military Radars Industry Revenue (Million) Forecast, by Application 2019 & 2032
- Table 71: Israel Military Radars Industry Revenue (Million) Forecast, by Application 2019 & 2032
- Table 72: GCC Military Radars Industry Revenue (Million) Forecast, by Application 2019 & 2032
- Table 73: North Africa Military Radars Industry Revenue (Million) Forecast, by Application 2019 & 2032
- Table 74: South Africa Military Radars Industry Revenue (Million) Forecast, by Application 2019 & 2032
- Table 75: Rest of Middle East & Africa Military Radars Industry Revenue (Million) Forecast, by Application 2019 & 2032
- Table 76: Global Military Radars Industry Revenue Million Forecast, by Production Analysis 2019 & 2032
- Table 77: Global Military Radars Industry Revenue Million Forecast, by Consumption Analysis 2019 & 2032
- Table 78: Global Military Radars Industry Revenue Million Forecast, by Import Market Analysis (Value & Volume) 2019 & 2032
- Table 79: Global Military Radars Industry Revenue Million Forecast, by Export Market Analysis (Value & Volume) 2019 & 2032
- Table 80: Global Military Radars Industry Revenue Million Forecast, by Price Trend Analysis 2019 & 2032
- Table 81: Global Military Radars Industry Revenue Million Forecast, by Country 2019 & 2032
- Table 82: China Military Radars Industry Revenue (Million) Forecast, by Application 2019 & 2032
- Table 83: India Military Radars Industry Revenue (Million) Forecast, by Application 2019 & 2032
- Table 84: Japan Military Radars Industry Revenue (Million) Forecast, by Application 2019 & 2032
- Table 85: South Korea Military Radars Industry Revenue (Million) Forecast, by Application 2019 & 2032
- Table 86: ASEAN Military Radars Industry Revenue (Million) Forecast, by Application 2019 & 2032
- Table 87: Oceania Military Radars Industry Revenue (Million) Forecast, by Application 2019 & 2032
- Table 88: Rest of Asia Pacific Military Radars Industry Revenue (Million) Forecast, by Application 2019 & 2032
Frequently Asked Questions
1. What is the projected Compound Annual Growth Rate (CAGR) of the Military Radars Industry?
The projected CAGR is approximately 5.15%.
2. Which companies are prominent players in the Military Radars Industry?
Key companies in the market include THALES, Leonardo SpA, Lockheed Martin Corporation, Airbus SE, QinetiQ Group PL, Teledyne Technologies Incorporated, BAE Systems PLC, RTX Corporation, HENSOLDT Holding Germany GmbH, Israel Aerospace Industries Ltd, Northrop Grumman Corporation, Saab AB.
3. What are the main segments of the Military Radars Industry?
The market segments include Production Analysis, Consumption Analysis, Import Market Analysis (Value & Volume), Export Market Analysis (Value & Volume), Price Trend Analysis.
4. Can you provide details about the market size?
The market size is estimated to be USD 16.71 Million as of 2022.
5. What are some drivers contributing to market growth?
Increase in Internet of Things (IoT) and Autonomous Systems; Rise in Demand for Military and Defense Satellite Communication Solutions.
6. What are the notable trends driving market growth?
Airborne Segment Expected to Register the Highest CAGR During the Forecast Period.
7. Are there any restraints impacting market growth?
Cybersecurity Threats to Satellite Communication; Interference in Transmission of Data.
8. Can you provide examples of recent developments in the market?
N/A
9. What pricing options are available for accessing the report?
Pricing options include single-user, multi-user, and enterprise licenses priced at USD 4750, USD 5250, and USD 8750 respectively.
10. Is the market size provided in terms of value or volume?
The market size is provided in terms of value, measured in Million.
11. Are there any specific market keywords associated with the report?
Yes, the market keyword associated with the report is "Military Radars Industry," which aids in identifying and referencing the specific market segment covered.
12. How do I determine which pricing option suits my needs best?
The pricing options vary based on user requirements and access needs. Individual users may opt for single-user licenses, while businesses requiring broader access may choose multi-user or enterprise licenses for cost-effective access to the report.
13. Are there any additional resources or data provided in the Military Radars Industry report?
While the report offers comprehensive insights, it's advisable to review the specific contents or supplementary materials provided to ascertain if additional resources or data are available.
14. How can I stay updated on further developments or reports in the Military Radars Industry?
To stay informed about further developments, trends, and reports in the Military Radars Industry, consider subscribing to industry newsletters, following relevant companies and organizations, or regularly checking reputable industry news sources and publications.
Methodology
Step 1 - Identification of Relevant Samples Size from Population Database


Step 2 - Approaches for Defining Global Market Size (Value, Volume* & Price*)

Note*: In applicable scenarios
Step 3 - Data Sources
Primary Research
- Web Analytics
- Survey Reports
- Research Institute
- Latest Research Reports
- Opinion Leaders
Secondary Research
- Annual Reports
- White Paper
- Latest Press Release
- Industry Association
- Paid Database
- Investor Presentations

Step 4 - Data Triangulation
Involves using different sources of information in order to increase the validity of a study
These sources are likely to be stakeholders in a program - participants, other researchers, program staff, other community members, and so on.
Then we put all data in single framework & apply various statistical tools to find out the dynamic on the market.
During the analysis stage, feedback from the stakeholder groups would be compared to determine areas of agreement as well as areas of divergence
