

Key Insights
The global molluscicides market, valued at approximately 837.82 million in 2025, is projected to experience robust growth, exhibiting a compound annual growth rate (CAGR) of 9.67% from 2025 to 2033. This expansion is driven by increasing incidences of mollusk-induced crop damage, necessitating effective control measures. The rising adoption of sustainable and environmentally friendly molluscicides, coupled with growing global food demand, further fuels market expansion. The market offers diverse opportunities across various application modes and crop types, enabling tailored pest management solutions.
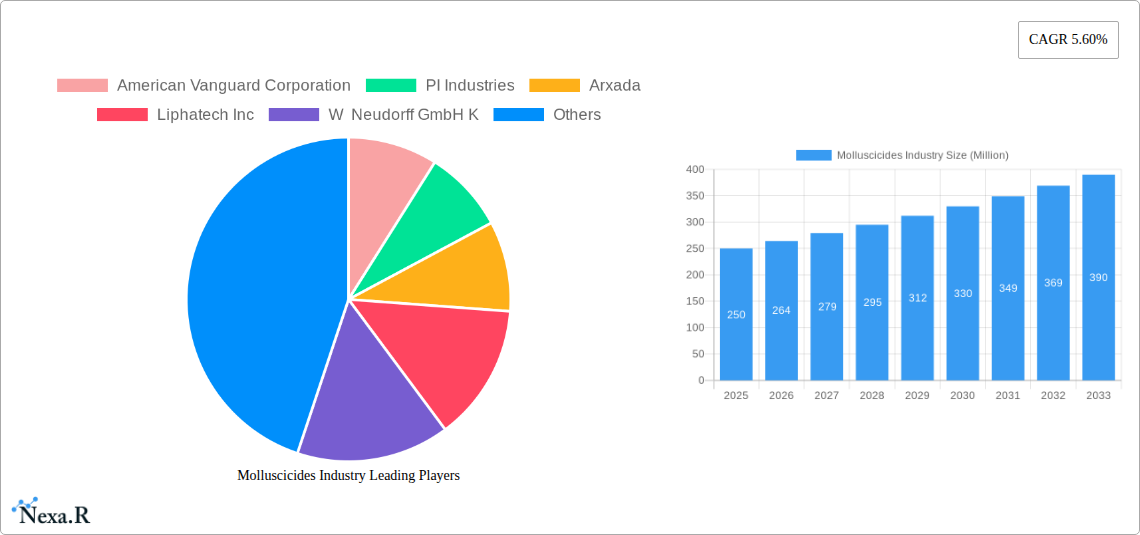
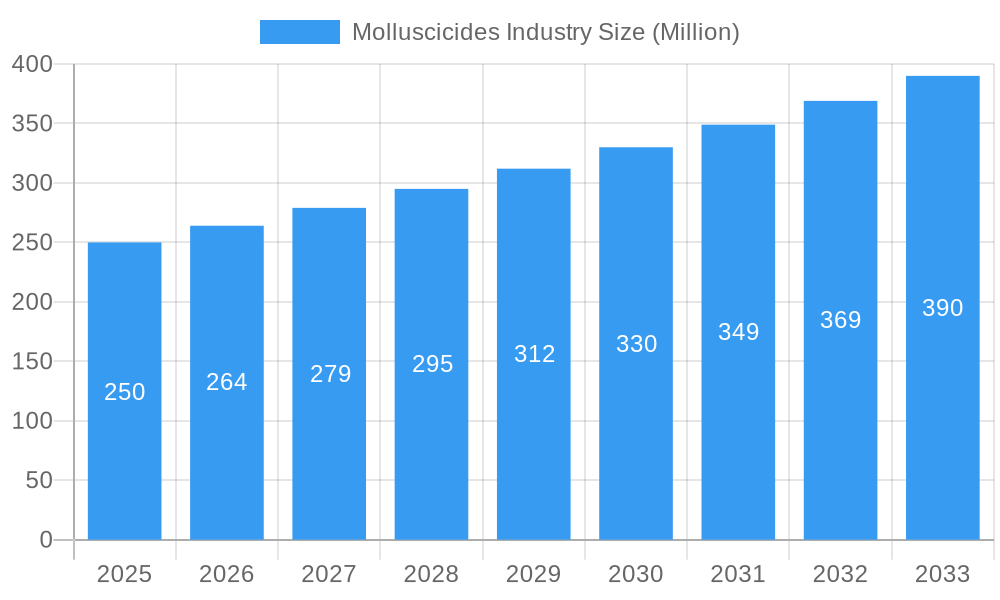
Molluscicides Industry Market Size (In Million)
Challenges to market growth include stringent regulatory frameworks, potential environmental concerns, fluctuating raw material prices, and the availability of substitutes. However, ongoing research and development into novel, effective, and eco-benign molluscicides are expected to mitigate these challenges. Key industry players are strategically investing in innovation and expansion within this dynamic sector.
Molluscicides Industry Company Market Share
Molluscicides Market Analysis: Growth, Trends, and Forecast (2025-2033)
This comprehensive report analyzes the molluscicides market, covering market dynamics, growth trends, regional segmentation, product landscape, key players, and future outlook. The market size in 2025 is estimated at 837.82 million.
Molluscicides Industry Market Dynamics & Structure
The global molluscicides market is characterized by moderate concentration, with key players like American Vanguard Corporation, PI Industries, Arxada, Liphatech Inc, W Neudorff GmbH K, Mitsui & Co Ltd (Certis Belchim), UPL Limited, and Nufarm Ltd holding significant market share. Technological innovation, particularly in the development of more effective and environmentally friendly formulations, is a key driver. Stringent regulatory frameworks concerning pesticide use influence market growth, creating both opportunities and challenges. The market also faces competition from alternative pest control methods, including biological control agents. M&A activity, as evidenced by recent acquisitions within the industry (detailed later), shapes the competitive landscape.
- Market Concentration: Moderately concentrated, with the top 8 players holding approximately xx% of the market share in 2025.
- Technological Innovation: Focus on developing bio-pesticides and formulations with reduced environmental impact.
- Regulatory Framework: Stringent regulations drive demand for safer and more compliant products.
- Competitive Substitutes: Biological control, integrated pest management (IPM) strategies.
- End-User Demographics: Primarily agricultural producers, turf and ornamental managers, and public health organizations.
- M&A Trends: Increasing consolidation through mergers and acquisitions, resulting in xx major deals between 2019 and 2024.
Molluscicides Industry Growth Trends & Insights
The global molluscicides market has demonstrated robust growth, exhibiting a Compound Annual Growth Rate (CAGR) of approximately XX% during the historical period spanning 2019 to 2024. Projections indicate a sustained upward trajectory, with the market anticipated to maintain a CAGR of around XX% throughout the forecast period of 2025 to 2033. This expansion is primarily fueled by several key drivers: the escalating demand for increased agricultural output globally, the continuous growth of urban green spaces necessitating effective pest control for turf and ornamental plants, and a heightened awareness among stakeholders regarding the significant economic repercussions of mollusk infestations on crops and infrastructure. Furthermore, rapid advancements in formulation and delivery technologies are playing a pivotal role in enhancing market adoption and effectiveness. Reflecting evolving consumer priorities, there's a discernible shift towards environmentally sustainable solutions, consequently stimulating substantial innovation in the development and application of bio-based molluscicides.
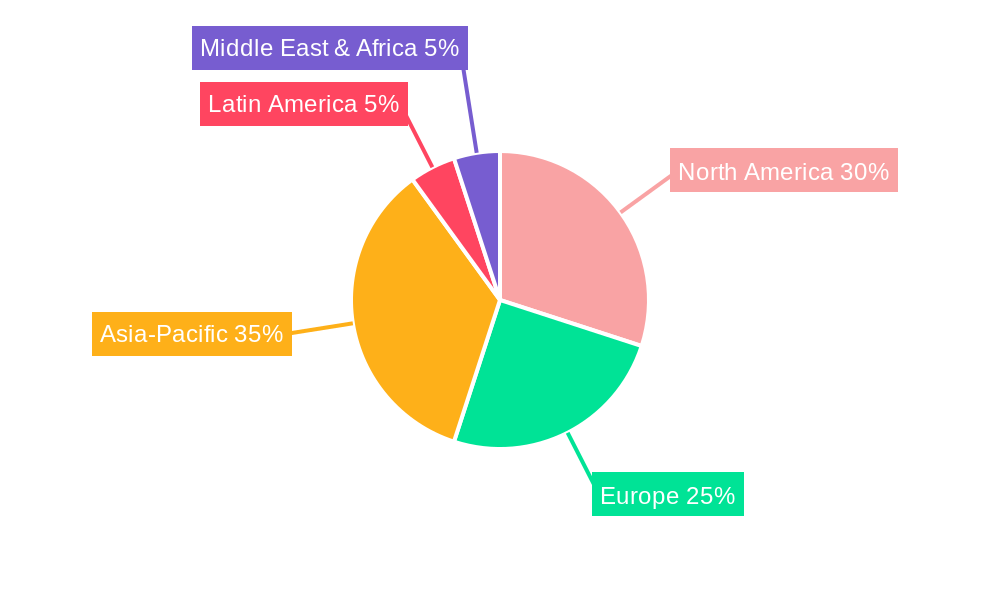
Dominant Regions, Countries, or Segments in Molluscicides Industry
The Fruits & Vegetables segment and the Soil Treatment application mode represent the largest market segments, driving overall market growth. Regions with significant agricultural output and substantial investments in crop protection experience higher demand. Favorable climatic conditions for mollusk infestation also contribute to regional growth. The dominance of specific regions is further influenced by governmental support for sustainable agricultural practices and infrastructure development.
- Leading Region: North America and Europe are currently dominant, owing to high agricultural output and adoption of advanced pest management techniques.
- Leading Application Mode: Soil treatment, due to its effectiveness and ease of application across large areas.
- Leading Crop Type: Fruits & vegetables, high value crops with significant vulnerability to mollusk damage.
- Key Drivers: Growing agricultural production, increasing awareness of mollusk damage, government support for crop protection.
Molluscicides Industry Product Landscape
The molluscicides market is characterized by a diverse and evolving product portfolio, encompassing a wide array of active ingredients, sophisticated formulations such as granular baits, liquid concentrates, and slow-release pellets, and varied application methodologies tailored for different agricultural and urban environments. Current industry innovation is heavily focused on optimizing product efficacy against a broader spectrum of mollusk species, minimizing unintended ecological impacts, and significantly enhancing end-user safety. Key differentiators and unique selling propositions for leading products include advanced targeted delivery systems that ensure precise application, superior residual activity for prolonged protection, and demonstrably lower toxicity profiles for both non-target organisms and humans. Technological breakthroughs are prominently featured in the development of cutting-edge bio-pesticides derived from natural sources, advanced microencapsulated formulations for controlled release, and intelligent delivery systems that adapt to environmental conditions.
Key Drivers, Barriers & Challenges in Molluscicides Industry
Key Drivers:
- Increasing global food demand leading to intensified agricultural practices.
- Growing urbanization and the need for effective turf and ornamental pest control.
- Rise of sustainable agriculture and consumer preference for eco-friendly products.
Key Challenges:
- Stringent regulations and approval processes for new molluscicide formulations.
- The emergence of mollusk resistance to existing products, necessitating the development of new active ingredients.
- Supply chain disruptions impacting the availability of raw materials and finished products. This resulted in a xx% increase in prices during 2022.
Emerging Opportunities in Molluscicides Industry
- The discovery and commercialization of novel active ingredients that offer superior efficacy while exhibiting a significantly reduced environmental footprint.
- Strategic market penetration into previously underserved regions and developing economies, particularly those with substantial agricultural sectors facing considerable mollusk challenges.
- Addressing the burgeoning consumer and regulatory demand for organic-certified and bio-based molluscicide alternatives.
- The integration of molluscicides into comprehensive Integrated Pest Management (IPM) frameworks, promoting synergistic control strategies that combine chemical, biological, and cultural methods.
- Development of smart, precision application technologies that optimize molluscicide use and minimize off-target exposure.
- Research into mollusk-specific attractants and repellents to enhance baiting strategies and reduce broad-spectrum application.
Growth Accelerators in the Molluscicides Industry
The long-term sustainable growth of the molluscicides industry will be profoundly shaped by continued technological innovation, with a particular emphasis on the pioneering development of advanced bio-pesticides and highly targeted, efficient delivery systems. Strategic alliances, mergers, and acquisitions among key industry stakeholders are expected to foster accelerated innovation cycles and facilitate broader market penetration. Moreover, supportive government policies aimed at promoting sustainable agricultural practices and increased investment in research and development initiatives by both public and private sectors will act as significant catalysts for market expansion and the adoption of more environmentally responsible solutions.
Key Players Shaping the Molluscicides Industry Market
- American Vanguard Corporation
- PI Industries
- Arxada
- Liphatech Inc
- W Neudorff GmbH K
- Mitsui & Co Ltd (Certis Belchim)
- UPL Limited
- Nufarm Ltd
Notable Milestones in Molluscicides Industry Sector
- June 2021: Mitsui & Co. Ltd. completed the full acquisition of Belchim Crop Protection, signaling a significant consolidation within the agrochemical sector.
- March 2022: The strategic merger of Belchim Crop Protection and Certis Europe led to the establishment of Certis Belchim BV, creating a stronger entity with enhanced market reach and product portfolios.
- November 2022: Certis Belchim BV further expanded its operational capabilities and market presence through the acquisition of the assets of Henry Manufacturing Limited, reinforcing its position in key markets.
- Early 2023: Launch of a new generation of slow-release molluscicide baits with improved weather resistance and reduced environmental persistence by a leading global agrochemical firm.
- Late 2023: Significant advancements reported in research for naturally derived molluscicidal compounds, showing promise for organic farming applications.
In-Depth Molluscicides Industry Market Outlook
The molluscicides market is poised for significant growth over the forecast period, driven by a combination of factors, including increasing agricultural production, growing urbanization, and the development of innovative, sustainable products. Strategic investments in research and development, coupled with strategic partnerships, will create substantial opportunities for market expansion and value creation. The focus on environmentally friendly solutions will further fuel market growth and shape future industry dynamics.
Molluscicides Industry Segmentation
- 1. Production Analysis
- 2. Consumption Analysis
- 3. Import Market Analysis (Value & Volume)
- 4. Export Market Analysis (Value & Volume)
- 5. Price Trend Analysis
Molluscicides Industry Segmentation By Geography
-
1. North America
- 1.1. United States
- 1.2. Canada
- 1.3. Mexico
-
2. South America
- 2.1. Brazil
- 2.2. Argentina
- 2.3. Rest of South America
-
3. Europe
- 3.1. United Kingdom
- 3.2. Germany
- 3.3. France
- 3.4. Italy
- 3.5. Spain
- 3.6. Russia
- 3.7. Benelux
- 3.8. Nordics
- 3.9. Rest of Europe
-
4. Middle East & Africa
- 4.1. Turkey
- 4.2. Israel
- 4.3. GCC
- 4.4. North Africa
- 4.5. South Africa
- 4.6. Rest of Middle East & Africa
-
5. Asia Pacific
- 5.1. China
- 5.2. India
- 5.3. Japan
- 5.4. South Korea
- 5.5. ASEAN
- 5.6. Oceania
- 5.7. Rest of Asia Pacific
Molluscicides Industry Regional Market Share
Geographic Coverage of Molluscicides Industry
Molluscicides Industry REPORT HIGHLIGHTS
| Aspects | Details |
|---|---|
| Study Period | 2020-2034 |
| Base Year | 2025 |
| Estimated Year | 2026 |
| Forecast Period | 2026-2034 |
| Historical Period | 2020-2025 |
| Growth Rate | CAGR of 9.67% from 2020-2034 |
| Segmentation |
|
Table of Contents
- 1. Introduction
- 1.1. Research Scope
- 1.2. Market Segmentation
- 1.3. Research Methodology
- 1.4. Definitions and Assumptions
- 2. Executive Summary
- 2.1. Introduction
- 3. Market Dynamics
- 3.1. Introduction
- 3.2. Market Drivers
- 3.2.1. Seed Treatment As A Solution To Enhance Yield; Growing Awareness For Seed Treatment Among The Farmers; Rising Trend Of Organic Farming
- 3.3. Market Restrains
- 3.3.1. Limitations Across Farm-Level Seed Treatment; Rising Environmental Concerns
- 3.4. Market Trends
- 3.4.1. South America dominated the global molluscicide market
- 4. Market Factor Analysis
- 4.1. Porters Five Forces
- 4.2. Supply/Value Chain
- 4.3. PESTEL analysis
- 4.4. Market Entropy
- 4.5. Patent/Trademark Analysis
- 5. Global Molluscicides Industry Analysis, Insights and Forecast, 2020-2032
- 5.1. Market Analysis, Insights and Forecast - by Production Analysis
- 5.2. Market Analysis, Insights and Forecast - by Consumption Analysis
- 5.3. Market Analysis, Insights and Forecast - by Import Market Analysis (Value & Volume)
- 5.4. Market Analysis, Insights and Forecast - by Export Market Analysis (Value & Volume)
- 5.5. Market Analysis, Insights and Forecast - by Price Trend Analysis
- 5.6. Market Analysis, Insights and Forecast - by Region
- 5.6.1. North America
- 5.6.2. South America
- 5.6.3. Europe
- 5.6.4. Middle East & Africa
- 5.6.5. Asia Pacific
- 5.1. Market Analysis, Insights and Forecast - by Production Analysis
- 6. North America Molluscicides Industry Analysis, Insights and Forecast, 2020-2032
- 6.1. Market Analysis, Insights and Forecast - by Production Analysis
- 6.2. Market Analysis, Insights and Forecast - by Consumption Analysis
- 6.3. Market Analysis, Insights and Forecast - by Import Market Analysis (Value & Volume)
- 6.4. Market Analysis, Insights and Forecast - by Export Market Analysis (Value & Volume)
- 6.5. Market Analysis, Insights and Forecast - by Price Trend Analysis
- 6.1. Market Analysis, Insights and Forecast - by Production Analysis
- 7. South America Molluscicides Industry Analysis, Insights and Forecast, 2020-2032
- 7.1. Market Analysis, Insights and Forecast - by Production Analysis
- 7.2. Market Analysis, Insights and Forecast - by Consumption Analysis
- 7.3. Market Analysis, Insights and Forecast - by Import Market Analysis (Value & Volume)
- 7.4. Market Analysis, Insights and Forecast - by Export Market Analysis (Value & Volume)
- 7.5. Market Analysis, Insights and Forecast - by Price Trend Analysis
- 7.1. Market Analysis, Insights and Forecast - by Production Analysis
- 8. Europe Molluscicides Industry Analysis, Insights and Forecast, 2020-2032
- 8.1. Market Analysis, Insights and Forecast - by Production Analysis
- 8.2. Market Analysis, Insights and Forecast - by Consumption Analysis
- 8.3. Market Analysis, Insights and Forecast - by Import Market Analysis (Value & Volume)
- 8.4. Market Analysis, Insights and Forecast - by Export Market Analysis (Value & Volume)
- 8.5. Market Analysis, Insights and Forecast - by Price Trend Analysis
- 8.1. Market Analysis, Insights and Forecast - by Production Analysis
- 9. Middle East & Africa Molluscicides Industry Analysis, Insights and Forecast, 2020-2032
- 9.1. Market Analysis, Insights and Forecast - by Production Analysis
- 9.2. Market Analysis, Insights and Forecast - by Consumption Analysis
- 9.3. Market Analysis, Insights and Forecast - by Import Market Analysis (Value & Volume)
- 9.4. Market Analysis, Insights and Forecast - by Export Market Analysis (Value & Volume)
- 9.5. Market Analysis, Insights and Forecast - by Price Trend Analysis
- 9.1. Market Analysis, Insights and Forecast - by Production Analysis
- 10. Asia Pacific Molluscicides Industry Analysis, Insights and Forecast, 2020-2032
- 10.1. Market Analysis, Insights and Forecast - by Production Analysis
- 10.2. Market Analysis, Insights and Forecast - by Consumption Analysis
- 10.3. Market Analysis, Insights and Forecast - by Import Market Analysis (Value & Volume)
- 10.4. Market Analysis, Insights and Forecast - by Export Market Analysis (Value & Volume)
- 10.5. Market Analysis, Insights and Forecast - by Price Trend Analysis
- 10.1. Market Analysis, Insights and Forecast - by Production Analysis
- 11. Competitive Analysis
- 11.1. Global Market Share Analysis 2025
- 11.2. Company Profiles
- 11.2.1 American Vanguard Corporation
- 11.2.1.1. Overview
- 11.2.1.2. Products
- 11.2.1.3. SWOT Analysis
- 11.2.1.4. Recent Developments
- 11.2.1.5. Financials (Based on Availability)
- 11.2.2 PI Industries
- 11.2.2.1. Overview
- 11.2.2.2. Products
- 11.2.2.3. SWOT Analysis
- 11.2.2.4. Recent Developments
- 11.2.2.5. Financials (Based on Availability)
- 11.2.3 Arxada
- 11.2.3.1. Overview
- 11.2.3.2. Products
- 11.2.3.3. SWOT Analysis
- 11.2.3.4. Recent Developments
- 11.2.3.5. Financials (Based on Availability)
- 11.2.4 Liphatech Inc
- 11.2.4.1. Overview
- 11.2.4.2. Products
- 11.2.4.3. SWOT Analysis
- 11.2.4.4. Recent Developments
- 11.2.4.5. Financials (Based on Availability)
- 11.2.5 W Neudorff GmbH K
- 11.2.5.1. Overview
- 11.2.5.2. Products
- 11.2.5.3. SWOT Analysis
- 11.2.5.4. Recent Developments
- 11.2.5.5. Financials (Based on Availability)
- 11.2.6 Mitsui & Co Ltd (Certis Belchim)
- 11.2.6.1. Overview
- 11.2.6.2. Products
- 11.2.6.3. SWOT Analysis
- 11.2.6.4. Recent Developments
- 11.2.6.5. Financials (Based on Availability)
- 11.2.7 UPL Limited
- 11.2.7.1. Overview
- 11.2.7.2. Products
- 11.2.7.3. SWOT Analysis
- 11.2.7.4. Recent Developments
- 11.2.7.5. Financials (Based on Availability)
- 11.2.8 Nufarm Ltd
- 11.2.8.1. Overview
- 11.2.8.2. Products
- 11.2.8.3. SWOT Analysis
- 11.2.8.4. Recent Developments
- 11.2.8.5. Financials (Based on Availability)
- 11.2.1 American Vanguard Corporation
List of Figures
- Figure 1: Global Molluscicides Industry Revenue Breakdown (million, %) by Region 2025 & 2033
- Figure 2: North America Molluscicides Industry Revenue (million), by Production Analysis 2025 & 2033
- Figure 3: North America Molluscicides Industry Revenue Share (%), by Production Analysis 2025 & 2033
- Figure 4: North America Molluscicides Industry Revenue (million), by Consumption Analysis 2025 & 2033
- Figure 5: North America Molluscicides Industry Revenue Share (%), by Consumption Analysis 2025 & 2033
- Figure 6: North America Molluscicides Industry Revenue (million), by Import Market Analysis (Value & Volume) 2025 & 2033
- Figure 7: North America Molluscicides Industry Revenue Share (%), by Import Market Analysis (Value & Volume) 2025 & 2033
- Figure 8: North America Molluscicides Industry Revenue (million), by Export Market Analysis (Value & Volume) 2025 & 2033
- Figure 9: North America Molluscicides Industry Revenue Share (%), by Export Market Analysis (Value & Volume) 2025 & 2033
- Figure 10: North America Molluscicides Industry Revenue (million), by Price Trend Analysis 2025 & 2033
- Figure 11: North America Molluscicides Industry Revenue Share (%), by Price Trend Analysis 2025 & 2033
- Figure 12: North America Molluscicides Industry Revenue (million), by Country 2025 & 2033
- Figure 13: North America Molluscicides Industry Revenue Share (%), by Country 2025 & 2033
- Figure 14: South America Molluscicides Industry Revenue (million), by Production Analysis 2025 & 2033
- Figure 15: South America Molluscicides Industry Revenue Share (%), by Production Analysis 2025 & 2033
- Figure 16: South America Molluscicides Industry Revenue (million), by Consumption Analysis 2025 & 2033
- Figure 17: South America Molluscicides Industry Revenue Share (%), by Consumption Analysis 2025 & 2033
- Figure 18: South America Molluscicides Industry Revenue (million), by Import Market Analysis (Value & Volume) 2025 & 2033
- Figure 19: South America Molluscicides Industry Revenue Share (%), by Import Market Analysis (Value & Volume) 2025 & 2033
- Figure 20: South America Molluscicides Industry Revenue (million), by Export Market Analysis (Value & Volume) 2025 & 2033
- Figure 21: South America Molluscicides Industry Revenue Share (%), by Export Market Analysis (Value & Volume) 2025 & 2033
- Figure 22: South America Molluscicides Industry Revenue (million), by Price Trend Analysis 2025 & 2033
- Figure 23: South America Molluscicides Industry Revenue Share (%), by Price Trend Analysis 2025 & 2033
- Figure 24: South America Molluscicides Industry Revenue (million), by Country 2025 & 2033
- Figure 25: South America Molluscicides Industry Revenue Share (%), by Country 2025 & 2033
- Figure 26: Europe Molluscicides Industry Revenue (million), by Production Analysis 2025 & 2033
- Figure 27: Europe Molluscicides Industry Revenue Share (%), by Production Analysis 2025 & 2033
- Figure 28: Europe Molluscicides Industry Revenue (million), by Consumption Analysis 2025 & 2033
- Figure 29: Europe Molluscicides Industry Revenue Share (%), by Consumption Analysis 2025 & 2033
- Figure 30: Europe Molluscicides Industry Revenue (million), by Import Market Analysis (Value & Volume) 2025 & 2033
- Figure 31: Europe Molluscicides Industry Revenue Share (%), by Import Market Analysis (Value & Volume) 2025 & 2033
- Figure 32: Europe Molluscicides Industry Revenue (million), by Export Market Analysis (Value & Volume) 2025 & 2033
- Figure 33: Europe Molluscicides Industry Revenue Share (%), by Export Market Analysis (Value & Volume) 2025 & 2033
- Figure 34: Europe Molluscicides Industry Revenue (million), by Price Trend Analysis 2025 & 2033
- Figure 35: Europe Molluscicides Industry Revenue Share (%), by Price Trend Analysis 2025 & 2033
- Figure 36: Europe Molluscicides Industry Revenue (million), by Country 2025 & 2033
- Figure 37: Europe Molluscicides Industry Revenue Share (%), by Country 2025 & 2033
- Figure 38: Middle East & Africa Molluscicides Industry Revenue (million), by Production Analysis 2025 & 2033
- Figure 39: Middle East & Africa Molluscicides Industry Revenue Share (%), by Production Analysis 2025 & 2033
- Figure 40: Middle East & Africa Molluscicides Industry Revenue (million), by Consumption Analysis 2025 & 2033
- Figure 41: Middle East & Africa Molluscicides Industry Revenue Share (%), by Consumption Analysis 2025 & 2033
- Figure 42: Middle East & Africa Molluscicides Industry Revenue (million), by Import Market Analysis (Value & Volume) 2025 & 2033
- Figure 43: Middle East & Africa Molluscicides Industry Revenue Share (%), by Import Market Analysis (Value & Volume) 2025 & 2033
- Figure 44: Middle East & Africa Molluscicides Industry Revenue (million), by Export Market Analysis (Value & Volume) 2025 & 2033
- Figure 45: Middle East & Africa Molluscicides Industry Revenue Share (%), by Export Market Analysis (Value & Volume) 2025 & 2033
- Figure 46: Middle East & Africa Molluscicides Industry Revenue (million), by Price Trend Analysis 2025 & 2033
- Figure 47: Middle East & Africa Molluscicides Industry Revenue Share (%), by Price Trend Analysis 2025 & 2033
- Figure 48: Middle East & Africa Molluscicides Industry Revenue (million), by Country 2025 & 2033
- Figure 49: Middle East & Africa Molluscicides Industry Revenue Share (%), by Country 2025 & 2033
- Figure 50: Asia Pacific Molluscicides Industry Revenue (million), by Production Analysis 2025 & 2033
- Figure 51: Asia Pacific Molluscicides Industry Revenue Share (%), by Production Analysis 2025 & 2033
- Figure 52: Asia Pacific Molluscicides Industry Revenue (million), by Consumption Analysis 2025 & 2033
- Figure 53: Asia Pacific Molluscicides Industry Revenue Share (%), by Consumption Analysis 2025 & 2033
- Figure 54: Asia Pacific Molluscicides Industry Revenue (million), by Import Market Analysis (Value & Volume) 2025 & 2033
- Figure 55: Asia Pacific Molluscicides Industry Revenue Share (%), by Import Market Analysis (Value & Volume) 2025 & 2033
- Figure 56: Asia Pacific Molluscicides Industry Revenue (million), by Export Market Analysis (Value & Volume) 2025 & 2033
- Figure 57: Asia Pacific Molluscicides Industry Revenue Share (%), by Export Market Analysis (Value & Volume) 2025 & 2033
- Figure 58: Asia Pacific Molluscicides Industry Revenue (million), by Price Trend Analysis 2025 & 2033
- Figure 59: Asia Pacific Molluscicides Industry Revenue Share (%), by Price Trend Analysis 2025 & 2033
- Figure 60: Asia Pacific Molluscicides Industry Revenue (million), by Country 2025 & 2033
- Figure 61: Asia Pacific Molluscicides Industry Revenue Share (%), by Country 2025 & 2033
List of Tables
- Table 1: Global Molluscicides Industry Revenue million Forecast, by Production Analysis 2020 & 2033
- Table 2: Global Molluscicides Industry Revenue million Forecast, by Consumption Analysis 2020 & 2033
- Table 3: Global Molluscicides Industry Revenue million Forecast, by Import Market Analysis (Value & Volume) 2020 & 2033
- Table 4: Global Molluscicides Industry Revenue million Forecast, by Export Market Analysis (Value & Volume) 2020 & 2033
- Table 5: Global Molluscicides Industry Revenue million Forecast, by Price Trend Analysis 2020 & 2033
- Table 6: Global Molluscicides Industry Revenue million Forecast, by Region 2020 & 2033
- Table 7: Global Molluscicides Industry Revenue million Forecast, by Production Analysis 2020 & 2033
- Table 8: Global Molluscicides Industry Revenue million Forecast, by Consumption Analysis 2020 & 2033
- Table 9: Global Molluscicides Industry Revenue million Forecast, by Import Market Analysis (Value & Volume) 2020 & 2033
- Table 10: Global Molluscicides Industry Revenue million Forecast, by Export Market Analysis (Value & Volume) 2020 & 2033
- Table 11: Global Molluscicides Industry Revenue million Forecast, by Price Trend Analysis 2020 & 2033
- Table 12: Global Molluscicides Industry Revenue million Forecast, by Country 2020 & 2033
- Table 13: United States Molluscicides Industry Revenue (million) Forecast, by Application 2020 & 2033
- Table 14: Canada Molluscicides Industry Revenue (million) Forecast, by Application 2020 & 2033
- Table 15: Mexico Molluscicides Industry Revenue (million) Forecast, by Application 2020 & 2033
- Table 16: Global Molluscicides Industry Revenue million Forecast, by Production Analysis 2020 & 2033
- Table 17: Global Molluscicides Industry Revenue million Forecast, by Consumption Analysis 2020 & 2033
- Table 18: Global Molluscicides Industry Revenue million Forecast, by Import Market Analysis (Value & Volume) 2020 & 2033
- Table 19: Global Molluscicides Industry Revenue million Forecast, by Export Market Analysis (Value & Volume) 2020 & 2033
- Table 20: Global Molluscicides Industry Revenue million Forecast, by Price Trend Analysis 2020 & 2033
- Table 21: Global Molluscicides Industry Revenue million Forecast, by Country 2020 & 2033
- Table 22: Brazil Molluscicides Industry Revenue (million) Forecast, by Application 2020 & 2033
- Table 23: Argentina Molluscicides Industry Revenue (million) Forecast, by Application 2020 & 2033
- Table 24: Rest of South America Molluscicides Industry Revenue (million) Forecast, by Application 2020 & 2033
- Table 25: Global Molluscicides Industry Revenue million Forecast, by Production Analysis 2020 & 2033
- Table 26: Global Molluscicides Industry Revenue million Forecast, by Consumption Analysis 2020 & 2033
- Table 27: Global Molluscicides Industry Revenue million Forecast, by Import Market Analysis (Value & Volume) 2020 & 2033
- Table 28: Global Molluscicides Industry Revenue million Forecast, by Export Market Analysis (Value & Volume) 2020 & 2033
- Table 29: Global Molluscicides Industry Revenue million Forecast, by Price Trend Analysis 2020 & 2033
- Table 30: Global Molluscicides Industry Revenue million Forecast, by Country 2020 & 2033
- Table 31: United Kingdom Molluscicides Industry Revenue (million) Forecast, by Application 2020 & 2033
- Table 32: Germany Molluscicides Industry Revenue (million) Forecast, by Application 2020 & 2033
- Table 33: France Molluscicides Industry Revenue (million) Forecast, by Application 2020 & 2033
- Table 34: Italy Molluscicides Industry Revenue (million) Forecast, by Application 2020 & 2033
- Table 35: Spain Molluscicides Industry Revenue (million) Forecast, by Application 2020 & 2033
- Table 36: Russia Molluscicides Industry Revenue (million) Forecast, by Application 2020 & 2033
- Table 37: Benelux Molluscicides Industry Revenue (million) Forecast, by Application 2020 & 2033
- Table 38: Nordics Molluscicides Industry Revenue (million) Forecast, by Application 2020 & 2033
- Table 39: Rest of Europe Molluscicides Industry Revenue (million) Forecast, by Application 2020 & 2033
- Table 40: Global Molluscicides Industry Revenue million Forecast, by Production Analysis 2020 & 2033
- Table 41: Global Molluscicides Industry Revenue million Forecast, by Consumption Analysis 2020 & 2033
- Table 42: Global Molluscicides Industry Revenue million Forecast, by Import Market Analysis (Value & Volume) 2020 & 2033
- Table 43: Global Molluscicides Industry Revenue million Forecast, by Export Market Analysis (Value & Volume) 2020 & 2033
- Table 44: Global Molluscicides Industry Revenue million Forecast, by Price Trend Analysis 2020 & 2033
- Table 45: Global Molluscicides Industry Revenue million Forecast, by Country 2020 & 2033
- Table 46: Turkey Molluscicides Industry Revenue (million) Forecast, by Application 2020 & 2033
- Table 47: Israel Molluscicides Industry Revenue (million) Forecast, by Application 2020 & 2033
- Table 48: GCC Molluscicides Industry Revenue (million) Forecast, by Application 2020 & 2033
- Table 49: North Africa Molluscicides Industry Revenue (million) Forecast, by Application 2020 & 2033
- Table 50: South Africa Molluscicides Industry Revenue (million) Forecast, by Application 2020 & 2033
- Table 51: Rest of Middle East & Africa Molluscicides Industry Revenue (million) Forecast, by Application 2020 & 2033
- Table 52: Global Molluscicides Industry Revenue million Forecast, by Production Analysis 2020 & 2033
- Table 53: Global Molluscicides Industry Revenue million Forecast, by Consumption Analysis 2020 & 2033
- Table 54: Global Molluscicides Industry Revenue million Forecast, by Import Market Analysis (Value & Volume) 2020 & 2033
- Table 55: Global Molluscicides Industry Revenue million Forecast, by Export Market Analysis (Value & Volume) 2020 & 2033
- Table 56: Global Molluscicides Industry Revenue million Forecast, by Price Trend Analysis 2020 & 2033
- Table 57: Global Molluscicides Industry Revenue million Forecast, by Country 2020 & 2033
- Table 58: China Molluscicides Industry Revenue (million) Forecast, by Application 2020 & 2033
- Table 59: India Molluscicides Industry Revenue (million) Forecast, by Application 2020 & 2033
- Table 60: Japan Molluscicides Industry Revenue (million) Forecast, by Application 2020 & 2033
- Table 61: South Korea Molluscicides Industry Revenue (million) Forecast, by Application 2020 & 2033
- Table 62: ASEAN Molluscicides Industry Revenue (million) Forecast, by Application 2020 & 2033
- Table 63: Oceania Molluscicides Industry Revenue (million) Forecast, by Application 2020 & 2033
- Table 64: Rest of Asia Pacific Molluscicides Industry Revenue (million) Forecast, by Application 2020 & 2033
Frequently Asked Questions
1. What is the projected Compound Annual Growth Rate (CAGR) of the Molluscicides Industry?
The projected CAGR is approximately 9.67%.
2. Which companies are prominent players in the Molluscicides Industry?
Key companies in the market include American Vanguard Corporation, PI Industries, Arxada, Liphatech Inc, W Neudorff GmbH K, Mitsui & Co Ltd (Certis Belchim), UPL Limited, Nufarm Ltd.
3. What are the main segments of the Molluscicides Industry?
The market segments include Production Analysis, Consumption Analysis, Import Market Analysis (Value & Volume), Export Market Analysis (Value & Volume), Price Trend Analysis.
4. Can you provide details about the market size?
The market size is estimated to be USD 837.82 million as of 2022.
5. What are some drivers contributing to market growth?
Seed Treatment As A Solution To Enhance Yield; Growing Awareness For Seed Treatment Among The Farmers; Rising Trend Of Organic Farming.
6. What are the notable trends driving market growth?
South America dominated the global molluscicide market.
7. Are there any restraints impacting market growth?
Limitations Across Farm-Level Seed Treatment; Rising Environmental Concerns.
8. Can you provide examples of recent developments in the market?
November 2022: Certis Belchim BV acquired the assets of Henry Manufacturing Limited in New Zealand. This includes its portfolio and pipeline of potassium fatty-acid salts, which have various applications in crop protection.March 2022: A new company called Certis Belchim BV was formed by Mitsui & Co. Ltd by merging its recently acquired Belchim Crop Protection and its European subsidiary Certis Europe. This was done in accordance with the terms of a definitive agreement.June 2021: Belchim Crop Protection was fully acquired by Mitsui & Co. Ltd after purchasing the remaining 32% of shares owned by Belchim Management NV/SA. Mitsui now holds a 62% stake in Belchim Crop Protection alongside ISK and Mitsui Chemicals Agro. This acquisition allows Mitsui to focus on establishing a sustainable crop protection company in Europe.
9. What pricing options are available for accessing the report?
Pricing options include single-user, multi-user, and enterprise licenses priced at USD 3800, USD 4500, and USD 5800 respectively.
10. Is the market size provided in terms of value or volume?
The market size is provided in terms of value, measured in million.
11. Are there any specific market keywords associated with the report?
Yes, the market keyword associated with the report is "Molluscicides Industry," which aids in identifying and referencing the specific market segment covered.
12. How do I determine which pricing option suits my needs best?
The pricing options vary based on user requirements and access needs. Individual users may opt for single-user licenses, while businesses requiring broader access may choose multi-user or enterprise licenses for cost-effective access to the report.
13. Are there any additional resources or data provided in the Molluscicides Industry report?
While the report offers comprehensive insights, it's advisable to review the specific contents or supplementary materials provided to ascertain if additional resources or data are available.
14. How can I stay updated on further developments or reports in the Molluscicides Industry?
To stay informed about further developments, trends, and reports in the Molluscicides Industry, consider subscribing to industry newsletters, following relevant companies and organizations, or regularly checking reputable industry news sources and publications.
Methodology
Step 1 - Identification of Relevant Samples Size from Population Database


Step 2 - Approaches for Defining Global Market Size (Value, Volume* & Price*)

Note*: In applicable scenarios
Step 3 - Data Sources
Primary Research
- Web Analytics
- Survey Reports
- Research Institute
- Latest Research Reports
- Opinion Leaders
Secondary Research
- Annual Reports
- White Paper
- Latest Press Release
- Industry Association
- Paid Database
- Investor Presentations

Step 4 - Data Triangulation
Involves using different sources of information in order to increase the validity of a study
These sources are likely to be stakeholders in a program - participants, other researchers, program staff, other community members, and so on.
Then we put all data in single framework & apply various statistical tools to find out the dynamic on the market.
During the analysis stage, feedback from the stakeholder groups would be compared to determine areas of agreement as well as areas of divergence