

Key Insights
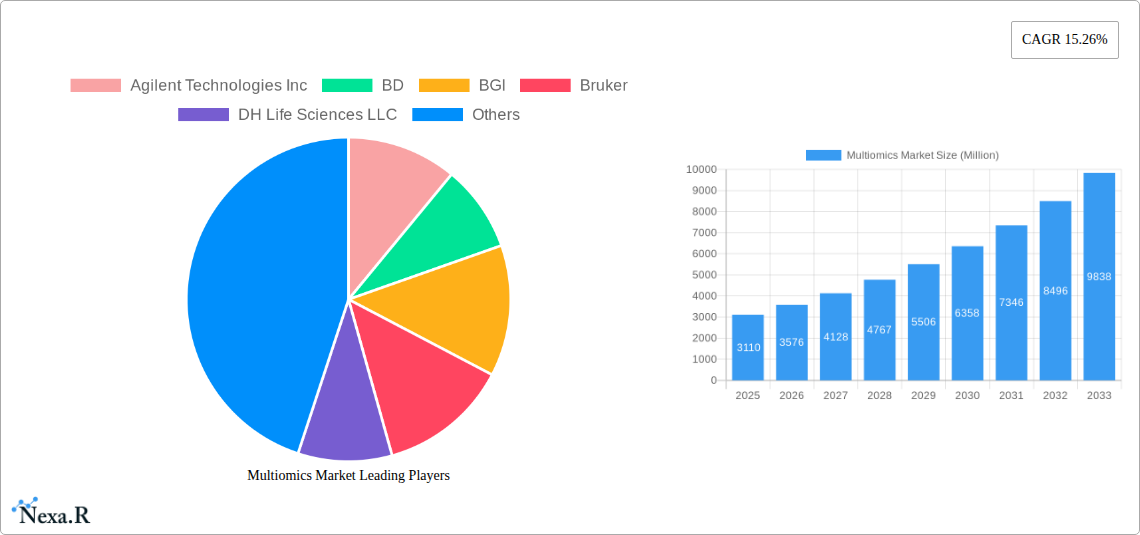
The multiomics market, currently valued at $3.11 billion in 2025, is experiencing robust growth, projected to expand at a Compound Annual Growth Rate (CAGR) of 15.26% from 2025 to 2033. This significant expansion is driven by several key factors. Advancements in sequencing technologies, coupled with decreasing costs, are making multiomics analysis more accessible to researchers and clinicians. The increasing prevalence of chronic diseases, such as cancer and cardiovascular disease, necessitates a deeper understanding of complex biological systems, fueling demand for comprehensive multiomics data analysis. Furthermore, the growing adoption of personalized medicine and the need for more precise diagnostic tools contribute to market growth. Major players like Illumina, Thermo Fisher Scientific, and Agilent Technologies are driving innovation through the development of sophisticated platforms and analytical software, fostering a competitive landscape that further accelerates market expansion.
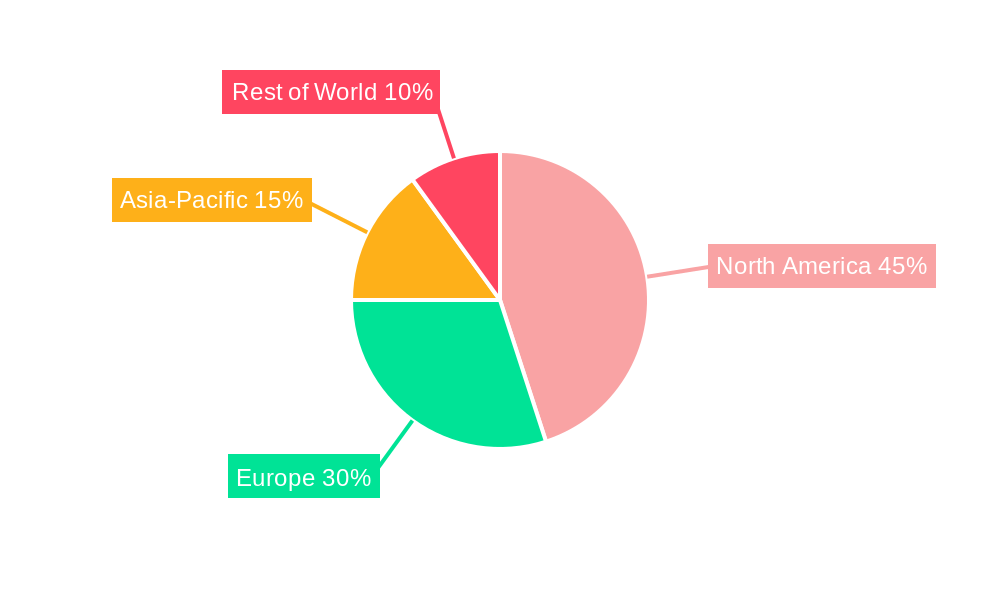
The market segmentation is complex, encompassing various technologies (e.g., genomics, transcriptomics, proteomics, metabolomics) and application areas (e.g., drug discovery, diagnostics, agricultural research). While precise segment-specific data is unavailable, we can infer that the genomics segment likely holds the largest market share currently, given its established maturity and widespread use. However, other "omics" areas are anticipated to grow rapidly, particularly proteomics and metabolomics, which are gaining traction in various research fields. Geographic expansion is also notable; North America and Europe currently dominate the market, yet the Asia-Pacific region is expected to exhibit the highest growth rate due to increasing investments in research infrastructure and expanding healthcare sectors. Regulatory approvals and ethical considerations surrounding data privacy and usage will undoubtedly influence market trajectory in the coming years.
Multiomics Market Report: A Comprehensive Analysis (2019-2033)
This in-depth report provides a comprehensive analysis of the Multiomics Market, encompassing market dynamics, growth trends, regional dominance, product landscape, key players, and future outlook. With a study period spanning 2019-2033, a base year of 2025, and a forecast period of 2025-2033, this report is an essential resource for industry professionals, investors, and researchers seeking to understand and capitalize on the rapidly evolving multiomics landscape. The report analyzes the parent market of Life Sciences and the child market of Genomics, offering a granular view of market segmentation and growth prospects. The market size is expected to reach xx Million by 2033.
Multiomics Market Dynamics & Structure
The multiomics market is characterized by a moderately concentrated landscape with key players vying for market share. Technological innovation, particularly in next-generation sequencing (NGS) and bioinformatics, is a primary driver of growth. Stringent regulatory frameworks governing data privacy and clinical validation pose challenges, but also encourage responsible market development. Competitive pressures are evident from the emergence of substitute technologies and the increasing prevalence of mergers and acquisitions (M&A) activities. End-users include research institutions, pharmaceutical companies, hospitals, and diagnostic labs, with the research sector currently dominating market share.
- Market Concentration: Moderately concentrated, with top 5 players holding approximately xx% market share in 2025.
- Technological Innovation: NGS advancements, improved bioinformatics tools, and miniaturization of instrumentation are key drivers.
- Regulatory Frameworks: Stringent regulations regarding data security and clinical validation influence market expansion.
- M&A Activity: Annual M&A deal volume estimated at xx deals in 2024, indicating consolidation within the sector.
- Innovation Barriers: High R&D costs, complexities in data integration, and skilled workforce shortages.
- End-User Demographics: Research institutions (xx%), pharmaceutical companies (xx%), hospitals (xx%), diagnostic labs (xx%).
Multiomics Market Growth Trends & Insights
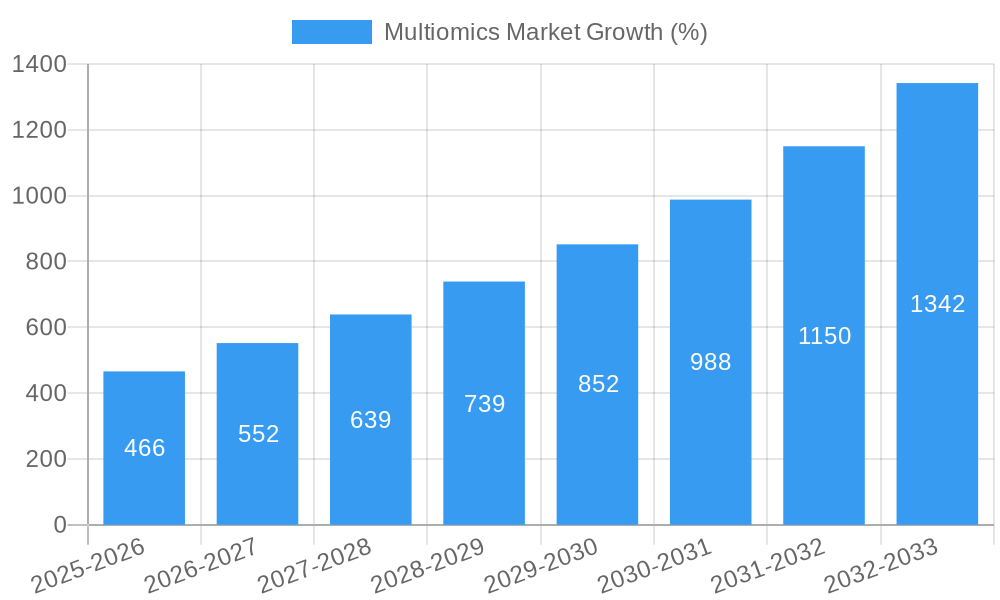
The multiomics market has witnessed substantial growth over the historical period (2019-2024), driven by increasing adoption rates across various sectors. Technological disruptions, including the development of more cost-effective and higher-throughput multiomics platforms, are accelerating market expansion. Consumer behavior shifts towards personalized medicine and precision healthcare further fuel demand. This positive trend is expected to continue into the forecast period (2025-2033), with a projected Compound Annual Growth Rate (CAGR) of xx% from 2025 to 2033. Market penetration is expected to reach xx% by 2033. The increasing affordability of multiomics technologies and the growing awareness of their clinical benefits among healthcare professionals are key drivers behind the accelerating adoption rate.
Dominant Regions, Countries, or Segments in Multiomics Market
North America currently holds the largest market share, driven by strong research funding, early adoption of advanced technologies, and robust healthcare infrastructure. Europe follows closely, while the Asia-Pacific region exhibits high growth potential due to increasing investments in healthcare R&D and growing awareness of multiomics applications. The pharmaceutical and biotechnology segment contributes significantly to market growth, owing to the increasing use of multiomics data for drug discovery and development.
- North America: High market share due to advanced healthcare infrastructure and robust funding.
- Europe: Significant market share driven by strong research capabilities and regulatory support.
- Asia-Pacific: High growth potential owing to increasing investments in healthcare R&D and rising prevalence of chronic diseases.
- Pharmaceutical & Biotechnology Segment: Largest segment in terms of revenue generation, driven by drug discovery and development applications.
Multiomics Market Product Landscape
The multiomics market offers a diverse range of products, including integrated platforms combining various omics technologies (genomics, transcriptomics, proteomics, metabolomics), advanced software for data analysis and interpretation, and specialized sample preparation kits. Unique selling propositions revolve around enhanced throughput, reduced costs, improved data quality, and user-friendly interfaces. Recent technological advancements focus on single-cell multiomics and spatial multiomics technologies, enabling more precise and comprehensive analyses.
Key Drivers, Barriers & Challenges in Multiomics Market
Key Drivers:
- Rising prevalence of chronic diseases demanding personalized medicine approaches.
- Increasing government funding for research and development in the life sciences.
- Advancements in next-generation sequencing and bioinformatics technologies.
- Growing adoption of multiomics in drug discovery and development.
Key Barriers and Challenges:
- High costs associated with multiomics technologies and data analysis.
- Complexity of integrating data from diverse omics platforms.
- Shortage of skilled professionals in bioinformatics and data analysis.
- Stringent regulatory requirements for clinical applications. Market entry for new players has been impacted by approximately xx% due to regulatory hurdles.
Emerging Opportunities in Multiomics Market
- Liquid Biopsies: Growing application in cancer diagnostics and monitoring.
- Single-Cell Multiomics: Providing detailed insights into cellular heterogeneity.
- Spatial Multiomics: Enabling the analysis of gene expression and protein localization within tissue samples.
- AI-driven Data Analysis: Accelerating the analysis and interpretation of large, complex datasets.
Growth Accelerators in the Multiomics Market Industry
Technological breakthroughs in NGS, improved bioinformatics tools, and the development of integrated multiomics platforms are key growth accelerators. Strategic partnerships between technology providers and research institutions are fostering innovation and accelerating market adoption. Expansion into new applications, such as precision medicine and environmental monitoring, further contributes to market growth.
Key Players Shaping the Multiomics Market Market
- Agilent Technologies Inc
- BD
- BGI
- Bruker
- DH Life Sciences LLC
- Illumina Inc
- Mission Bio
- NanoCellect Biomedical
- PerkinElmer Inc
- QIAGEN
- Shimadzu Corporation
- Singleron Biotechnologies
- Standard BioTools
- Thermo Fisher Scientific Inc
- List Not Exhaustive
Notable Milestones in Multiomics Market Sector
- February 2024: Vizzhy Inc. launched the world's first Multiomics Lab in Bengaluru, India, signifying a major advancement in personalized healthcare.
- September 2023: MGI launched the DCS Lab Initiative to promote large-scale multiomics research, providing access to advanced technologies.
- April 2023: Biomodal (formerly Cambridge Epigenetix) introduced a duet multiomics solution for simultaneous epigenetic and genetic analysis.
In-Depth Multiomics Market Market Outlook
The multiomics market is poised for continued strong growth, driven by the convergence of technological advancements, increasing healthcare investment, and the growing demand for personalized medicine solutions. Strategic partnerships, technological innovation, and market expansion into new application areas will play a crucial role in shaping the future of the multiomics market. The market presents significant opportunities for businesses to innovate and develop novel multiomics solutions to meet the growing needs of researchers, clinicians, and patients alike.
Multiomics Market Segmentation
-
1. Product
- 1.1. Instruments
- 1.2. Reagents
- 1.3. Other Products
-
2. Type
- 2.1. Single-cell Multiomics
- 2.2. Bulk Multiomics
-
3. Platform
- 3.1. Genomics
- 3.2. Transcriptomics
- 3.3. Proteomics
- 3.4. Metabolomics
- 3.5. Integrated Omics Platforms
- 3.6. Other Platforms
-
4. Application
- 4.1. Cell Biology
- 4.2. Oncology
- 4.3. Neurology
- 4.4. Immunology
- 4.5. Other Applications
-
5. End User
- 5.1. Academic and Research Institutes
- 5.2. Pharmaceutical & Biotechnology Companies
- 5.3. Other End Users
Multiomics Market Segmentation By Geography
-
1. North America
- 1.1. United States
- 1.2. Canada
- 1.3. Mexico
-
2. Europe
- 2.1. Germany
- 2.2. United Kingdom
- 2.3. France
- 2.4. Italy
- 2.5. Spain
- 2.6. Rest of Europe
-
3. Asia Pacific
- 3.1. China
- 3.2. Japan
- 3.3. India
- 3.4. Australia
- 3.5. South Korea
- 3.6. Rest of Asia Pacific
-
4. Middle East and Africa
- 4.1. GCC
- 4.2. South Africa
- 4.3. Rest of Middle East and Africa
-
5. South America
- 5.1. Brazil
- 5.2. Argentina
- 5.3. Rest of South America
Multiomics Market REPORT HIGHLIGHTS
| Aspects | Details |
|---|---|
| Study Period | 2019-2033 |
| Base Year | 2024 |
| Estimated Year | 2025 |
| Forecast Period | 2025-2033 |
| Historical Period | 2019-2024 |
| Growth Rate | CAGR of 15.26% from 2019-2033 |
| Segmentation |
|
Table of Contents
- 1. Introduction
- 1.1. Research Scope
- 1.2. Market Segmentation
- 1.3. Research Methodology
- 1.4. Definitions and Assumptions
- 2. Executive Summary
- 2.1. Introduction
- 3. Market Dynamics
- 3.1. Introduction
- 3.2. Market Drivers
- 3.2.1. Rising Demand for Single-cell Multiomics and Advancements in Omics Technologies; Increasing Investment in Genomics R&D; Growing Demand for Personalized Medicine
- 3.3. Market Restrains
- 3.3.1. Rising Demand for Single-cell Multiomics and Advancements in Omics Technologies; Increasing Investment in Genomics R&D; Growing Demand for Personalized Medicine
- 3.4. Market Trends
- 3.4.1. The Bulk Multiomics Segment is Expected to Hold the Largest Share of the Market
- 4. Market Factor Analysis
- 4.1. Porters Five Forces
- 4.2. Supply/Value Chain
- 4.3. PESTEL analysis
- 4.4. Market Entropy
- 4.5. Patent/Trademark Analysis
- 5. Global Multiomics Market Analysis, Insights and Forecast, 2019-2031
- 5.1. Market Analysis, Insights and Forecast - by Product
- 5.1.1. Instruments
- 5.1.2. Reagents
- 5.1.3. Other Products
- 5.2. Market Analysis, Insights and Forecast - by Type
- 5.2.1. Single-cell Multiomics
- 5.2.2. Bulk Multiomics
- 5.3. Market Analysis, Insights and Forecast - by Platform
- 5.3.1. Genomics
- 5.3.2. Transcriptomics
- 5.3.3. Proteomics
- 5.3.4. Metabolomics
- 5.3.5. Integrated Omics Platforms
- 5.3.6. Other Platforms
- 5.4. Market Analysis, Insights and Forecast - by Application
- 5.4.1. Cell Biology
- 5.4.2. Oncology
- 5.4.3. Neurology
- 5.4.4. Immunology
- 5.4.5. Other Applications
- 5.5. Market Analysis, Insights and Forecast - by End User
- 5.5.1. Academic and Research Institutes
- 5.5.2. Pharmaceutical & Biotechnology Companies
- 5.5.3. Other End Users
- 5.6. Market Analysis, Insights and Forecast - by Region
- 5.6.1. North America
- 5.6.2. Europe
- 5.6.3. Asia Pacific
- 5.6.4. Middle East and Africa
- 5.6.5. South America
- 5.1. Market Analysis, Insights and Forecast - by Product
- 6. North America Multiomics Market Analysis, Insights and Forecast, 2019-2031
- 6.1. Market Analysis, Insights and Forecast - by Product
- 6.1.1. Instruments
- 6.1.2. Reagents
- 6.1.3. Other Products
- 6.2. Market Analysis, Insights and Forecast - by Type
- 6.2.1. Single-cell Multiomics
- 6.2.2. Bulk Multiomics
- 6.3. Market Analysis, Insights and Forecast - by Platform
- 6.3.1. Genomics
- 6.3.2. Transcriptomics
- 6.3.3. Proteomics
- 6.3.4. Metabolomics
- 6.3.5. Integrated Omics Platforms
- 6.3.6. Other Platforms
- 6.4. Market Analysis, Insights and Forecast - by Application
- 6.4.1. Cell Biology
- 6.4.2. Oncology
- 6.4.3. Neurology
- 6.4.4. Immunology
- 6.4.5. Other Applications
- 6.5. Market Analysis, Insights and Forecast - by End User
- 6.5.1. Academic and Research Institutes
- 6.5.2. Pharmaceutical & Biotechnology Companies
- 6.5.3. Other End Users
- 6.1. Market Analysis, Insights and Forecast - by Product
- 7. Europe Multiomics Market Analysis, Insights and Forecast, 2019-2031
- 7.1. Market Analysis, Insights and Forecast - by Product
- 7.1.1. Instruments
- 7.1.2. Reagents
- 7.1.3. Other Products
- 7.2. Market Analysis, Insights and Forecast - by Type
- 7.2.1. Single-cell Multiomics
- 7.2.2. Bulk Multiomics
- 7.3. Market Analysis, Insights and Forecast - by Platform
- 7.3.1. Genomics
- 7.3.2. Transcriptomics
- 7.3.3. Proteomics
- 7.3.4. Metabolomics
- 7.3.5. Integrated Omics Platforms
- 7.3.6. Other Platforms
- 7.4. Market Analysis, Insights and Forecast - by Application
- 7.4.1. Cell Biology
- 7.4.2. Oncology
- 7.4.3. Neurology
- 7.4.4. Immunology
- 7.4.5. Other Applications
- 7.5. Market Analysis, Insights and Forecast - by End User
- 7.5.1. Academic and Research Institutes
- 7.5.2. Pharmaceutical & Biotechnology Companies
- 7.5.3. Other End Users
- 7.1. Market Analysis, Insights and Forecast - by Product
- 8. Asia Pacific Multiomics Market Analysis, Insights and Forecast, 2019-2031
- 8.1. Market Analysis, Insights and Forecast - by Product
- 8.1.1. Instruments
- 8.1.2. Reagents
- 8.1.3. Other Products
- 8.2. Market Analysis, Insights and Forecast - by Type
- 8.2.1. Single-cell Multiomics
- 8.2.2. Bulk Multiomics
- 8.3. Market Analysis, Insights and Forecast - by Platform
- 8.3.1. Genomics
- 8.3.2. Transcriptomics
- 8.3.3. Proteomics
- 8.3.4. Metabolomics
- 8.3.5. Integrated Omics Platforms
- 8.3.6. Other Platforms
- 8.4. Market Analysis, Insights and Forecast - by Application
- 8.4.1. Cell Biology
- 8.4.2. Oncology
- 8.4.3. Neurology
- 8.4.4. Immunology
- 8.4.5. Other Applications
- 8.5. Market Analysis, Insights and Forecast - by End User
- 8.5.1. Academic and Research Institutes
- 8.5.2. Pharmaceutical & Biotechnology Companies
- 8.5.3. Other End Users
- 8.1. Market Analysis, Insights and Forecast - by Product
- 9. Middle East and Africa Multiomics Market Analysis, Insights and Forecast, 2019-2031
- 9.1. Market Analysis, Insights and Forecast - by Product
- 9.1.1. Instruments
- 9.1.2. Reagents
- 9.1.3. Other Products
- 9.2. Market Analysis, Insights and Forecast - by Type
- 9.2.1. Single-cell Multiomics
- 9.2.2. Bulk Multiomics
- 9.3. Market Analysis, Insights and Forecast - by Platform
- 9.3.1. Genomics
- 9.3.2. Transcriptomics
- 9.3.3. Proteomics
- 9.3.4. Metabolomics
- 9.3.5. Integrated Omics Platforms
- 9.3.6. Other Platforms
- 9.4. Market Analysis, Insights and Forecast - by Application
- 9.4.1. Cell Biology
- 9.4.2. Oncology
- 9.4.3. Neurology
- 9.4.4. Immunology
- 9.4.5. Other Applications
- 9.5. Market Analysis, Insights and Forecast - by End User
- 9.5.1. Academic and Research Institutes
- 9.5.2. Pharmaceutical & Biotechnology Companies
- 9.5.3. Other End Users
- 9.1. Market Analysis, Insights and Forecast - by Product
- 10. South America Multiomics Market Analysis, Insights and Forecast, 2019-2031
- 10.1. Market Analysis, Insights and Forecast - by Product
- 10.1.1. Instruments
- 10.1.2. Reagents
- 10.1.3. Other Products
- 10.2. Market Analysis, Insights and Forecast - by Type
- 10.2.1. Single-cell Multiomics
- 10.2.2. Bulk Multiomics
- 10.3. Market Analysis, Insights and Forecast - by Platform
- 10.3.1. Genomics
- 10.3.2. Transcriptomics
- 10.3.3. Proteomics
- 10.3.4. Metabolomics
- 10.3.5. Integrated Omics Platforms
- 10.3.6. Other Platforms
- 10.4. Market Analysis, Insights and Forecast - by Application
- 10.4.1. Cell Biology
- 10.4.2. Oncology
- 10.4.3. Neurology
- 10.4.4. Immunology
- 10.4.5. Other Applications
- 10.5. Market Analysis, Insights and Forecast - by End User
- 10.5.1. Academic and Research Institutes
- 10.5.2. Pharmaceutical & Biotechnology Companies
- 10.5.3. Other End Users
- 10.1. Market Analysis, Insights and Forecast - by Product
- 11. Competitive Analysis
- 11.1. Global Market Share Analysis 2024
- 11.2. Company Profiles
- 11.2.1 Agilent Technologies Inc
- 11.2.1.1. Overview
- 11.2.1.2. Products
- 11.2.1.3. SWOT Analysis
- 11.2.1.4. Recent Developments
- 11.2.1.5. Financials (Based on Availability)
- 11.2.2 BD
- 11.2.2.1. Overview
- 11.2.2.2. Products
- 11.2.2.3. SWOT Analysis
- 11.2.2.4. Recent Developments
- 11.2.2.5. Financials (Based on Availability)
- 11.2.3 BGI
- 11.2.3.1. Overview
- 11.2.3.2. Products
- 11.2.3.3. SWOT Analysis
- 11.2.3.4. Recent Developments
- 11.2.3.5. Financials (Based on Availability)
- 11.2.4 Bruker
- 11.2.4.1. Overview
- 11.2.4.2. Products
- 11.2.4.3. SWOT Analysis
- 11.2.4.4. Recent Developments
- 11.2.4.5. Financials (Based on Availability)
- 11.2.5 DH Life Sciences LLC
- 11.2.5.1. Overview
- 11.2.5.2. Products
- 11.2.5.3. SWOT Analysis
- 11.2.5.4. Recent Developments
- 11.2.5.5. Financials (Based on Availability)
- 11.2.6 Illumina Inc
- 11.2.6.1. Overview
- 11.2.6.2. Products
- 11.2.6.3. SWOT Analysis
- 11.2.6.4. Recent Developments
- 11.2.6.5. Financials (Based on Availability)
- 11.2.7 Mission Bio
- 11.2.7.1. Overview
- 11.2.7.2. Products
- 11.2.7.3. SWOT Analysis
- 11.2.7.4. Recent Developments
- 11.2.7.5. Financials (Based on Availability)
- 11.2.8 NanoCellect Biomedical
- 11.2.8.1. Overview
- 11.2.8.2. Products
- 11.2.8.3. SWOT Analysis
- 11.2.8.4. Recent Developments
- 11.2.8.5. Financials (Based on Availability)
- 11.2.9 PerkinElmer Inc
- 11.2.9.1. Overview
- 11.2.9.2. Products
- 11.2.9.3. SWOT Analysis
- 11.2.9.4. Recent Developments
- 11.2.9.5. Financials (Based on Availability)
- 11.2.10 QIAGEN
- 11.2.10.1. Overview
- 11.2.10.2. Products
- 11.2.10.3. SWOT Analysis
- 11.2.10.4. Recent Developments
- 11.2.10.5. Financials (Based on Availability)
- 11.2.11 Shimadzu Corporation
- 11.2.11.1. Overview
- 11.2.11.2. Products
- 11.2.11.3. SWOT Analysis
- 11.2.11.4. Recent Developments
- 11.2.11.5. Financials (Based on Availability)
- 11.2.12 Singleron Biotechnologies
- 11.2.12.1. Overview
- 11.2.12.2. Products
- 11.2.12.3. SWOT Analysis
- 11.2.12.4. Recent Developments
- 11.2.12.5. Financials (Based on Availability)
- 11.2.13 Standard BioTools
- 11.2.13.1. Overview
- 11.2.13.2. Products
- 11.2.13.3. SWOT Analysis
- 11.2.13.4. Recent Developments
- 11.2.13.5. Financials (Based on Availability)
- 11.2.14 Thermo Fisher Scientific Inc *List Not Exhaustive
- 11.2.14.1. Overview
- 11.2.14.2. Products
- 11.2.14.3. SWOT Analysis
- 11.2.14.4. Recent Developments
- 11.2.14.5. Financials (Based on Availability)
- 11.2.1 Agilent Technologies Inc
List of Figures
- Figure 1: Global Multiomics Market Revenue Breakdown (Million, %) by Region 2024 & 2032
- Figure 2: Global Multiomics Market Volume Breakdown (Billion, %) by Region 2024 & 2032
- Figure 3: North America Multiomics Market Revenue (Million), by Product 2024 & 2032
- Figure 4: North America Multiomics Market Volume (Billion), by Product 2024 & 2032
- Figure 5: North America Multiomics Market Revenue Share (%), by Product 2024 & 2032
- Figure 6: North America Multiomics Market Volume Share (%), by Product 2024 & 2032
- Figure 7: North America Multiomics Market Revenue (Million), by Type 2024 & 2032
- Figure 8: North America Multiomics Market Volume (Billion), by Type 2024 & 2032
- Figure 9: North America Multiomics Market Revenue Share (%), by Type 2024 & 2032
- Figure 10: North America Multiomics Market Volume Share (%), by Type 2024 & 2032
- Figure 11: North America Multiomics Market Revenue (Million), by Platform 2024 & 2032
- Figure 12: North America Multiomics Market Volume (Billion), by Platform 2024 & 2032
- Figure 13: North America Multiomics Market Revenue Share (%), by Platform 2024 & 2032
- Figure 14: North America Multiomics Market Volume Share (%), by Platform 2024 & 2032
- Figure 15: North America Multiomics Market Revenue (Million), by Application 2024 & 2032
- Figure 16: North America Multiomics Market Volume (Billion), by Application 2024 & 2032
- Figure 17: North America Multiomics Market Revenue Share (%), by Application 2024 & 2032
- Figure 18: North America Multiomics Market Volume Share (%), by Application 2024 & 2032
- Figure 19: North America Multiomics Market Revenue (Million), by End User 2024 & 2032
- Figure 20: North America Multiomics Market Volume (Billion), by End User 2024 & 2032
- Figure 21: North America Multiomics Market Revenue Share (%), by End User 2024 & 2032
- Figure 22: North America Multiomics Market Volume Share (%), by End User 2024 & 2032
- Figure 23: North America Multiomics Market Revenue (Million), by Country 2024 & 2032
- Figure 24: North America Multiomics Market Volume (Billion), by Country 2024 & 2032
- Figure 25: North America Multiomics Market Revenue Share (%), by Country 2024 & 2032
- Figure 26: North America Multiomics Market Volume Share (%), by Country 2024 & 2032
- Figure 27: Europe Multiomics Market Revenue (Million), by Product 2024 & 2032
- Figure 28: Europe Multiomics Market Volume (Billion), by Product 2024 & 2032
- Figure 29: Europe Multiomics Market Revenue Share (%), by Product 2024 & 2032
- Figure 30: Europe Multiomics Market Volume Share (%), by Product 2024 & 2032
- Figure 31: Europe Multiomics Market Revenue (Million), by Type 2024 & 2032
- Figure 32: Europe Multiomics Market Volume (Billion), by Type 2024 & 2032
- Figure 33: Europe Multiomics Market Revenue Share (%), by Type 2024 & 2032
- Figure 34: Europe Multiomics Market Volume Share (%), by Type 2024 & 2032
- Figure 35: Europe Multiomics Market Revenue (Million), by Platform 2024 & 2032
- Figure 36: Europe Multiomics Market Volume (Billion), by Platform 2024 & 2032
- Figure 37: Europe Multiomics Market Revenue Share (%), by Platform 2024 & 2032
- Figure 38: Europe Multiomics Market Volume Share (%), by Platform 2024 & 2032
- Figure 39: Europe Multiomics Market Revenue (Million), by Application 2024 & 2032
- Figure 40: Europe Multiomics Market Volume (Billion), by Application 2024 & 2032
- Figure 41: Europe Multiomics Market Revenue Share (%), by Application 2024 & 2032
- Figure 42: Europe Multiomics Market Volume Share (%), by Application 2024 & 2032
- Figure 43: Europe Multiomics Market Revenue (Million), by End User 2024 & 2032
- Figure 44: Europe Multiomics Market Volume (Billion), by End User 2024 & 2032
- Figure 45: Europe Multiomics Market Revenue Share (%), by End User 2024 & 2032
- Figure 46: Europe Multiomics Market Volume Share (%), by End User 2024 & 2032
- Figure 47: Europe Multiomics Market Revenue (Million), by Country 2024 & 2032
- Figure 48: Europe Multiomics Market Volume (Billion), by Country 2024 & 2032
- Figure 49: Europe Multiomics Market Revenue Share (%), by Country 2024 & 2032
- Figure 50: Europe Multiomics Market Volume Share (%), by Country 2024 & 2032
- Figure 51: Asia Pacific Multiomics Market Revenue (Million), by Product 2024 & 2032
- Figure 52: Asia Pacific Multiomics Market Volume (Billion), by Product 2024 & 2032
- Figure 53: Asia Pacific Multiomics Market Revenue Share (%), by Product 2024 & 2032
- Figure 54: Asia Pacific Multiomics Market Volume Share (%), by Product 2024 & 2032
- Figure 55: Asia Pacific Multiomics Market Revenue (Million), by Type 2024 & 2032
- Figure 56: Asia Pacific Multiomics Market Volume (Billion), by Type 2024 & 2032
- Figure 57: Asia Pacific Multiomics Market Revenue Share (%), by Type 2024 & 2032
- Figure 58: Asia Pacific Multiomics Market Volume Share (%), by Type 2024 & 2032
- Figure 59: Asia Pacific Multiomics Market Revenue (Million), by Platform 2024 & 2032
- Figure 60: Asia Pacific Multiomics Market Volume (Billion), by Platform 2024 & 2032
- Figure 61: Asia Pacific Multiomics Market Revenue Share (%), by Platform 2024 & 2032
- Figure 62: Asia Pacific Multiomics Market Volume Share (%), by Platform 2024 & 2032
- Figure 63: Asia Pacific Multiomics Market Revenue (Million), by Application 2024 & 2032
- Figure 64: Asia Pacific Multiomics Market Volume (Billion), by Application 2024 & 2032
- Figure 65: Asia Pacific Multiomics Market Revenue Share (%), by Application 2024 & 2032
- Figure 66: Asia Pacific Multiomics Market Volume Share (%), by Application 2024 & 2032
- Figure 67: Asia Pacific Multiomics Market Revenue (Million), by End User 2024 & 2032
- Figure 68: Asia Pacific Multiomics Market Volume (Billion), by End User 2024 & 2032
- Figure 69: Asia Pacific Multiomics Market Revenue Share (%), by End User 2024 & 2032
- Figure 70: Asia Pacific Multiomics Market Volume Share (%), by End User 2024 & 2032
- Figure 71: Asia Pacific Multiomics Market Revenue (Million), by Country 2024 & 2032
- Figure 72: Asia Pacific Multiomics Market Volume (Billion), by Country 2024 & 2032
- Figure 73: Asia Pacific Multiomics Market Revenue Share (%), by Country 2024 & 2032
- Figure 74: Asia Pacific Multiomics Market Volume Share (%), by Country 2024 & 2032
- Figure 75: Middle East and Africa Multiomics Market Revenue (Million), by Product 2024 & 2032
- Figure 76: Middle East and Africa Multiomics Market Volume (Billion), by Product 2024 & 2032
- Figure 77: Middle East and Africa Multiomics Market Revenue Share (%), by Product 2024 & 2032
- Figure 78: Middle East and Africa Multiomics Market Volume Share (%), by Product 2024 & 2032
- Figure 79: Middle East and Africa Multiomics Market Revenue (Million), by Type 2024 & 2032
- Figure 80: Middle East and Africa Multiomics Market Volume (Billion), by Type 2024 & 2032
- Figure 81: Middle East and Africa Multiomics Market Revenue Share (%), by Type 2024 & 2032
- Figure 82: Middle East and Africa Multiomics Market Volume Share (%), by Type 2024 & 2032
- Figure 83: Middle East and Africa Multiomics Market Revenue (Million), by Platform 2024 & 2032
- Figure 84: Middle East and Africa Multiomics Market Volume (Billion), by Platform 2024 & 2032
- Figure 85: Middle East and Africa Multiomics Market Revenue Share (%), by Platform 2024 & 2032
- Figure 86: Middle East and Africa Multiomics Market Volume Share (%), by Platform 2024 & 2032
- Figure 87: Middle East and Africa Multiomics Market Revenue (Million), by Application 2024 & 2032
- Figure 88: Middle East and Africa Multiomics Market Volume (Billion), by Application 2024 & 2032
- Figure 89: Middle East and Africa Multiomics Market Revenue Share (%), by Application 2024 & 2032
- Figure 90: Middle East and Africa Multiomics Market Volume Share (%), by Application 2024 & 2032
- Figure 91: Middle East and Africa Multiomics Market Revenue (Million), by End User 2024 & 2032
- Figure 92: Middle East and Africa Multiomics Market Volume (Billion), by End User 2024 & 2032
- Figure 93: Middle East and Africa Multiomics Market Revenue Share (%), by End User 2024 & 2032
- Figure 94: Middle East and Africa Multiomics Market Volume Share (%), by End User 2024 & 2032
- Figure 95: Middle East and Africa Multiomics Market Revenue (Million), by Country 2024 & 2032
- Figure 96: Middle East and Africa Multiomics Market Volume (Billion), by Country 2024 & 2032
- Figure 97: Middle East and Africa Multiomics Market Revenue Share (%), by Country 2024 & 2032
- Figure 98: Middle East and Africa Multiomics Market Volume Share (%), by Country 2024 & 2032
- Figure 99: South America Multiomics Market Revenue (Million), by Product 2024 & 2032
- Figure 100: South America Multiomics Market Volume (Billion), by Product 2024 & 2032
- Figure 101: South America Multiomics Market Revenue Share (%), by Product 2024 & 2032
- Figure 102: South America Multiomics Market Volume Share (%), by Product 2024 & 2032
- Figure 103: South America Multiomics Market Revenue (Million), by Type 2024 & 2032
- Figure 104: South America Multiomics Market Volume (Billion), by Type 2024 & 2032
- Figure 105: South America Multiomics Market Revenue Share (%), by Type 2024 & 2032
- Figure 106: South America Multiomics Market Volume Share (%), by Type 2024 & 2032
- Figure 107: South America Multiomics Market Revenue (Million), by Platform 2024 & 2032
- Figure 108: South America Multiomics Market Volume (Billion), by Platform 2024 & 2032
- Figure 109: South America Multiomics Market Revenue Share (%), by Platform 2024 & 2032
- Figure 110: South America Multiomics Market Volume Share (%), by Platform 2024 & 2032
- Figure 111: South America Multiomics Market Revenue (Million), by Application 2024 & 2032
- Figure 112: South America Multiomics Market Volume (Billion), by Application 2024 & 2032
- Figure 113: South America Multiomics Market Revenue Share (%), by Application 2024 & 2032
- Figure 114: South America Multiomics Market Volume Share (%), by Application 2024 & 2032
- Figure 115: South America Multiomics Market Revenue (Million), by End User 2024 & 2032
- Figure 116: South America Multiomics Market Volume (Billion), by End User 2024 & 2032
- Figure 117: South America Multiomics Market Revenue Share (%), by End User 2024 & 2032
- Figure 118: South America Multiomics Market Volume Share (%), by End User 2024 & 2032
- Figure 119: South America Multiomics Market Revenue (Million), by Country 2024 & 2032
- Figure 120: South America Multiomics Market Volume (Billion), by Country 2024 & 2032
- Figure 121: South America Multiomics Market Revenue Share (%), by Country 2024 & 2032
- Figure 122: South America Multiomics Market Volume Share (%), by Country 2024 & 2032
List of Tables
- Table 1: Global Multiomics Market Revenue Million Forecast, by Region 2019 & 2032
- Table 2: Global Multiomics Market Volume Billion Forecast, by Region 2019 & 2032
- Table 3: Global Multiomics Market Revenue Million Forecast, by Product 2019 & 2032
- Table 4: Global Multiomics Market Volume Billion Forecast, by Product 2019 & 2032
- Table 5: Global Multiomics Market Revenue Million Forecast, by Type 2019 & 2032
- Table 6: Global Multiomics Market Volume Billion Forecast, by Type 2019 & 2032
- Table 7: Global Multiomics Market Revenue Million Forecast, by Platform 2019 & 2032
- Table 8: Global Multiomics Market Volume Billion Forecast, by Platform 2019 & 2032
- Table 9: Global Multiomics Market Revenue Million Forecast, by Application 2019 & 2032
- Table 10: Global Multiomics Market Volume Billion Forecast, by Application 2019 & 2032
- Table 11: Global Multiomics Market Revenue Million Forecast, by End User 2019 & 2032
- Table 12: Global Multiomics Market Volume Billion Forecast, by End User 2019 & 2032
- Table 13: Global Multiomics Market Revenue Million Forecast, by Region 2019 & 2032
- Table 14: Global Multiomics Market Volume Billion Forecast, by Region 2019 & 2032
- Table 15: Global Multiomics Market Revenue Million Forecast, by Product 2019 & 2032
- Table 16: Global Multiomics Market Volume Billion Forecast, by Product 2019 & 2032
- Table 17: Global Multiomics Market Revenue Million Forecast, by Type 2019 & 2032
- Table 18: Global Multiomics Market Volume Billion Forecast, by Type 2019 & 2032
- Table 19: Global Multiomics Market Revenue Million Forecast, by Platform 2019 & 2032
- Table 20: Global Multiomics Market Volume Billion Forecast, by Platform 2019 & 2032
- Table 21: Global Multiomics Market Revenue Million Forecast, by Application 2019 & 2032
- Table 22: Global Multiomics Market Volume Billion Forecast, by Application 2019 & 2032
- Table 23: Global Multiomics Market Revenue Million Forecast, by End User 2019 & 2032
- Table 24: Global Multiomics Market Volume Billion Forecast, by End User 2019 & 2032
- Table 25: Global Multiomics Market Revenue Million Forecast, by Country 2019 & 2032
- Table 26: Global Multiomics Market Volume Billion Forecast, by Country 2019 & 2032
- Table 27: United States Multiomics Market Revenue (Million) Forecast, by Application 2019 & 2032
- Table 28: United States Multiomics Market Volume (Billion) Forecast, by Application 2019 & 2032
- Table 29: Canada Multiomics Market Revenue (Million) Forecast, by Application 2019 & 2032
- Table 30: Canada Multiomics Market Volume (Billion) Forecast, by Application 2019 & 2032
- Table 31: Mexico Multiomics Market Revenue (Million) Forecast, by Application 2019 & 2032
- Table 32: Mexico Multiomics Market Volume (Billion) Forecast, by Application 2019 & 2032
- Table 33: Global Multiomics Market Revenue Million Forecast, by Product 2019 & 2032
- Table 34: Global Multiomics Market Volume Billion Forecast, by Product 2019 & 2032
- Table 35: Global Multiomics Market Revenue Million Forecast, by Type 2019 & 2032
- Table 36: Global Multiomics Market Volume Billion Forecast, by Type 2019 & 2032
- Table 37: Global Multiomics Market Revenue Million Forecast, by Platform 2019 & 2032
- Table 38: Global Multiomics Market Volume Billion Forecast, by Platform 2019 & 2032
- Table 39: Global Multiomics Market Revenue Million Forecast, by Application 2019 & 2032
- Table 40: Global Multiomics Market Volume Billion Forecast, by Application 2019 & 2032
- Table 41: Global Multiomics Market Revenue Million Forecast, by End User 2019 & 2032
- Table 42: Global Multiomics Market Volume Billion Forecast, by End User 2019 & 2032
- Table 43: Global Multiomics Market Revenue Million Forecast, by Country 2019 & 2032
- Table 44: Global Multiomics Market Volume Billion Forecast, by Country 2019 & 2032
- Table 45: Germany Multiomics Market Revenue (Million) Forecast, by Application 2019 & 2032
- Table 46: Germany Multiomics Market Volume (Billion) Forecast, by Application 2019 & 2032
- Table 47: United Kingdom Multiomics Market Revenue (Million) Forecast, by Application 2019 & 2032
- Table 48: United Kingdom Multiomics Market Volume (Billion) Forecast, by Application 2019 & 2032
- Table 49: France Multiomics Market Revenue (Million) Forecast, by Application 2019 & 2032
- Table 50: France Multiomics Market Volume (Billion) Forecast, by Application 2019 & 2032
- Table 51: Italy Multiomics Market Revenue (Million) Forecast, by Application 2019 & 2032
- Table 52: Italy Multiomics Market Volume (Billion) Forecast, by Application 2019 & 2032
- Table 53: Spain Multiomics Market Revenue (Million) Forecast, by Application 2019 & 2032
- Table 54: Spain Multiomics Market Volume (Billion) Forecast, by Application 2019 & 2032
- Table 55: Rest of Europe Multiomics Market Revenue (Million) Forecast, by Application 2019 & 2032
- Table 56: Rest of Europe Multiomics Market Volume (Billion) Forecast, by Application 2019 & 2032
- Table 57: Global Multiomics Market Revenue Million Forecast, by Product 2019 & 2032
- Table 58: Global Multiomics Market Volume Billion Forecast, by Product 2019 & 2032
- Table 59: Global Multiomics Market Revenue Million Forecast, by Type 2019 & 2032
- Table 60: Global Multiomics Market Volume Billion Forecast, by Type 2019 & 2032
- Table 61: Global Multiomics Market Revenue Million Forecast, by Platform 2019 & 2032
- Table 62: Global Multiomics Market Volume Billion Forecast, by Platform 2019 & 2032
- Table 63: Global Multiomics Market Revenue Million Forecast, by Application 2019 & 2032
- Table 64: Global Multiomics Market Volume Billion Forecast, by Application 2019 & 2032
- Table 65: Global Multiomics Market Revenue Million Forecast, by End User 2019 & 2032
- Table 66: Global Multiomics Market Volume Billion Forecast, by End User 2019 & 2032
- Table 67: Global Multiomics Market Revenue Million Forecast, by Country 2019 & 2032
- Table 68: Global Multiomics Market Volume Billion Forecast, by Country 2019 & 2032
- Table 69: China Multiomics Market Revenue (Million) Forecast, by Application 2019 & 2032
- Table 70: China Multiomics Market Volume (Billion) Forecast, by Application 2019 & 2032
- Table 71: Japan Multiomics Market Revenue (Million) Forecast, by Application 2019 & 2032
- Table 72: Japan Multiomics Market Volume (Billion) Forecast, by Application 2019 & 2032
- Table 73: India Multiomics Market Revenue (Million) Forecast, by Application 2019 & 2032
- Table 74: India Multiomics Market Volume (Billion) Forecast, by Application 2019 & 2032
- Table 75: Australia Multiomics Market Revenue (Million) Forecast, by Application 2019 & 2032
- Table 76: Australia Multiomics Market Volume (Billion) Forecast, by Application 2019 & 2032
- Table 77: South Korea Multiomics Market Revenue (Million) Forecast, by Application 2019 & 2032
- Table 78: South Korea Multiomics Market Volume (Billion) Forecast, by Application 2019 & 2032
- Table 79: Rest of Asia Pacific Multiomics Market Revenue (Million) Forecast, by Application 2019 & 2032
- Table 80: Rest of Asia Pacific Multiomics Market Volume (Billion) Forecast, by Application 2019 & 2032
- Table 81: Global Multiomics Market Revenue Million Forecast, by Product 2019 & 2032
- Table 82: Global Multiomics Market Volume Billion Forecast, by Product 2019 & 2032
- Table 83: Global Multiomics Market Revenue Million Forecast, by Type 2019 & 2032
- Table 84: Global Multiomics Market Volume Billion Forecast, by Type 2019 & 2032
- Table 85: Global Multiomics Market Revenue Million Forecast, by Platform 2019 & 2032
- Table 86: Global Multiomics Market Volume Billion Forecast, by Platform 2019 & 2032
- Table 87: Global Multiomics Market Revenue Million Forecast, by Application 2019 & 2032
- Table 88: Global Multiomics Market Volume Billion Forecast, by Application 2019 & 2032
- Table 89: Global Multiomics Market Revenue Million Forecast, by End User 2019 & 2032
- Table 90: Global Multiomics Market Volume Billion Forecast, by End User 2019 & 2032
- Table 91: Global Multiomics Market Revenue Million Forecast, by Country 2019 & 2032
- Table 92: Global Multiomics Market Volume Billion Forecast, by Country 2019 & 2032
- Table 93: GCC Multiomics Market Revenue (Million) Forecast, by Application 2019 & 2032
- Table 94: GCC Multiomics Market Volume (Billion) Forecast, by Application 2019 & 2032
- Table 95: South Africa Multiomics Market Revenue (Million) Forecast, by Application 2019 & 2032
- Table 96: South Africa Multiomics Market Volume (Billion) Forecast, by Application 2019 & 2032
- Table 97: Rest of Middle East and Africa Multiomics Market Revenue (Million) Forecast, by Application 2019 & 2032
- Table 98: Rest of Middle East and Africa Multiomics Market Volume (Billion) Forecast, by Application 2019 & 2032
- Table 99: Global Multiomics Market Revenue Million Forecast, by Product 2019 & 2032
- Table 100: Global Multiomics Market Volume Billion Forecast, by Product 2019 & 2032
- Table 101: Global Multiomics Market Revenue Million Forecast, by Type 2019 & 2032
- Table 102: Global Multiomics Market Volume Billion Forecast, by Type 2019 & 2032
- Table 103: Global Multiomics Market Revenue Million Forecast, by Platform 2019 & 2032
- Table 104: Global Multiomics Market Volume Billion Forecast, by Platform 2019 & 2032
- Table 105: Global Multiomics Market Revenue Million Forecast, by Application 2019 & 2032
- Table 106: Global Multiomics Market Volume Billion Forecast, by Application 2019 & 2032
- Table 107: Global Multiomics Market Revenue Million Forecast, by End User 2019 & 2032
- Table 108: Global Multiomics Market Volume Billion Forecast, by End User 2019 & 2032
- Table 109: Global Multiomics Market Revenue Million Forecast, by Country 2019 & 2032
- Table 110: Global Multiomics Market Volume Billion Forecast, by Country 2019 & 2032
- Table 111: Brazil Multiomics Market Revenue (Million) Forecast, by Application 2019 & 2032
- Table 112: Brazil Multiomics Market Volume (Billion) Forecast, by Application 2019 & 2032
- Table 113: Argentina Multiomics Market Revenue (Million) Forecast, by Application 2019 & 2032
- Table 114: Argentina Multiomics Market Volume (Billion) Forecast, by Application 2019 & 2032
- Table 115: Rest of South America Multiomics Market Revenue (Million) Forecast, by Application 2019 & 2032
- Table 116: Rest of South America Multiomics Market Volume (Billion) Forecast, by Application 2019 & 2032
Frequently Asked Questions
1. What is the projected Compound Annual Growth Rate (CAGR) of the Multiomics Market?
The projected CAGR is approximately 15.26%.
2. Which companies are prominent players in the Multiomics Market?
Key companies in the market include Agilent Technologies Inc, BD, BGI, Bruker, DH Life Sciences LLC, Illumina Inc, Mission Bio, NanoCellect Biomedical, PerkinElmer Inc, QIAGEN, Shimadzu Corporation, Singleron Biotechnologies, Standard BioTools, Thermo Fisher Scientific Inc *List Not Exhaustive.
3. What are the main segments of the Multiomics Market?
The market segments include Product, Type, Platform, Application, End User.
4. Can you provide details about the market size?
The market size is estimated to be USD 3.11 Million as of 2022.
5. What are some drivers contributing to market growth?
Rising Demand for Single-cell Multiomics and Advancements in Omics Technologies; Increasing Investment in Genomics R&D; Growing Demand for Personalized Medicine.
6. What are the notable trends driving market growth?
The Bulk Multiomics Segment is Expected to Hold the Largest Share of the Market.
7. Are there any restraints impacting market growth?
Rising Demand for Single-cell Multiomics and Advancements in Omics Technologies; Increasing Investment in Genomics R&D; Growing Demand for Personalized Medicine.
8. Can you provide examples of recent developments in the market?
February 2024: Vizzhy Inc. launched the world's inaugural Multiomics Lab in Bengaluru, India, heralding a major advancement in healthcare innovation. Equipped with cutting-edge tools and health AI technology, the lab enables physicians to pinpoint root causes and offer personalized recommendations for their patients.September 2023: MGI, a provider of technology and tools for life science, introduced the DCS Lab Initiative to stimulate crucial scientific research. This initiative encourages large-scale multiomics laboratories. Under the initiative, the organization offers products for numerous applications, including cell omics, DNA sequencing, and spatial omics based on DNBSEQ technologies, to specified research institutions globally.April 2023: Biomodal, formerly Cambridge Epigenetix, introduced a new duet multiomics solution that can enable simultaneous phased reading of epigenetic and genetic information in a single, low-volume sample.
9. What pricing options are available for accessing the report?
Pricing options include single-user, multi-user, and enterprise licenses priced at USD 4750, USD 5250, and USD 8750 respectively.
10. Is the market size provided in terms of value or volume?
The market size is provided in terms of value, measured in Million and volume, measured in Billion.
11. Are there any specific market keywords associated with the report?
Yes, the market keyword associated with the report is "Multiomics Market," which aids in identifying and referencing the specific market segment covered.
12. How do I determine which pricing option suits my needs best?
The pricing options vary based on user requirements and access needs. Individual users may opt for single-user licenses, while businesses requiring broader access may choose multi-user or enterprise licenses for cost-effective access to the report.
13. Are there any additional resources or data provided in the Multiomics Market report?
While the report offers comprehensive insights, it's advisable to review the specific contents or supplementary materials provided to ascertain if additional resources or data are available.
14. How can I stay updated on further developments or reports in the Multiomics Market?
To stay informed about further developments, trends, and reports in the Multiomics Market, consider subscribing to industry newsletters, following relevant companies and organizations, or regularly checking reputable industry news sources and publications.
Methodology
Step 1 - Identification of Relevant Samples Size from Population Database


Step 2 - Approaches for Defining Global Market Size (Value, Volume* & Price*)

Note*: In applicable scenarios
Step 3 - Data Sources
Primary Research
- Web Analytics
- Survey Reports
- Research Institute
- Latest Research Reports
- Opinion Leaders
Secondary Research
- Annual Reports
- White Paper
- Latest Press Release
- Industry Association
- Paid Database
- Investor Presentations

Step 4 - Data Triangulation
Involves using different sources of information in order to increase the validity of a study
These sources are likely to be stakeholders in a program - participants, other researchers, program staff, other community members, and so on.
Then we put all data in single framework & apply various statistical tools to find out the dynamic on the market.
During the analysis stage, feedback from the stakeholder groups would be compared to determine areas of agreement as well as areas of divergence
