

Key Insights
The North American in-store analytics market is experiencing robust growth, projected to reach a substantial size driven by the increasing adoption of advanced technologies and the imperative for retailers to enhance customer experience and operational efficiency. The market's Compound Annual Growth Rate (CAGR) of 22% from 2019-2033 indicates a significant upward trajectory. Key drivers include the need for real-time customer insights to personalize shopping experiences, optimize store layouts and inventory management, and improve loss prevention strategies. The shift towards cloud-based solutions simplifies deployment and offers scalability, further fueling market expansion. While the large enterprise segment currently dominates, the growing adoption of in-store analytics by small and medium-sized enterprises (SMEs) presents a significant opportunity for market expansion. Specific applications like customer management, risk and compliance management, and store operation management are experiencing particularly high demand, reflecting retailers' focus on data-driven decision-making across all aspects of their operations. Competition is intense, with established players like SAP SE and Cisco Systems alongside innovative startups constantly striving to offer cutting-edge solutions.
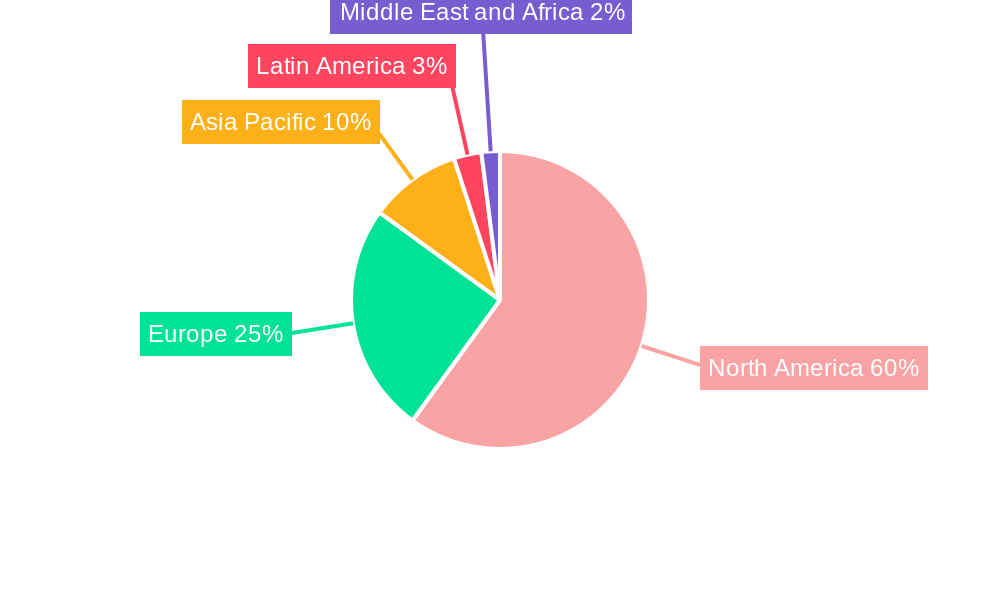
The North American market's dominance is likely due to factors such as high technological adoption rates, a strong retail sector, and substantial investments in data analytics infrastructure. However, other regions like Europe and Asia-Pacific are expected to witness significant growth, albeit at potentially slightly slower rates. The ongoing evolution of artificial intelligence (AI) and machine learning (ML) within in-store analytics promises to unlock even greater insights, improving predictive capabilities and automating complex processes. Challenges remain, including data privacy concerns and the need for robust data integration capabilities. Nevertheless, the overall market outlook is extremely positive, indicating sustained growth and innovation in the coming years, driven by retailers' continuous quest for enhanced efficiency and improved customer engagement.
North American In-Store Analytics Market Report: 2019-2033
This comprehensive report provides a detailed analysis of the North American (NA) In-Store Analytics market, encompassing its current state, future trajectory, and key players. With a study period spanning 2019-2033 (base year 2025, forecast period 2025-2033), this report is an invaluable resource for industry professionals, investors, and strategic decision-makers seeking to understand and capitalize on this dynamic market. The report segments the market by component (Software, Services), deployment (Cloud, On-premise), organization size (Large Enterprises, Small and Medium Enterprises), application (Customer Management, Risk and Compliance Management, Store Operation Management, Marketing and Merchandising, Other Applications), and country (United States, Canada). The total market value is projected to reach xx Million by 2033.
NA In-Store Analytics Market Dynamics & Structure
The NA in-store analytics market is characterized by moderate concentration, with several major players competing alongside a range of smaller, specialized firms. Technological innovation, particularly in AI and machine learning, is a key driver, enabling more sophisticated data analysis and actionable insights. Regulatory frameworks concerning data privacy and security significantly influence market practices. Competitive pressures from substitute technologies (e.g., simpler manual data collection methods) remain, though the value proposition of automated, data-driven insights is increasingly compelling. The end-user demographic is primarily comprised of retailers across various sectors, with large enterprises leading in adoption due to greater resources. M&A activity in the sector has been moderate, reflecting consolidation trends and the pursuit of enhanced capabilities.
- Market Concentration: Moderately concentrated, with a few dominant players holding significant market share (estimated at xx% combined).
- Technological Innovation: AI, machine learning, and computer vision are driving advancements in data collection and analysis.
- Regulatory Landscape: Data privacy regulations (e.g., CCPA, GDPR) impact data collection and usage practices.
- Competitive Substitutes: Manual data collection methods offer lower-cost alternatives but lack the scalability and analytical depth.
- End-User Demographics: Retailers across sectors (grocery, apparel, electronics) constitute the primary user base. Large enterprises exhibit higher adoption rates.
- M&A Trends: Moderate M&A activity, driven by strategic acquisitions to expand capabilities and market reach (estimated xx deals in the past 5 years).
NA In-Store Analytics Market Growth Trends & Insights
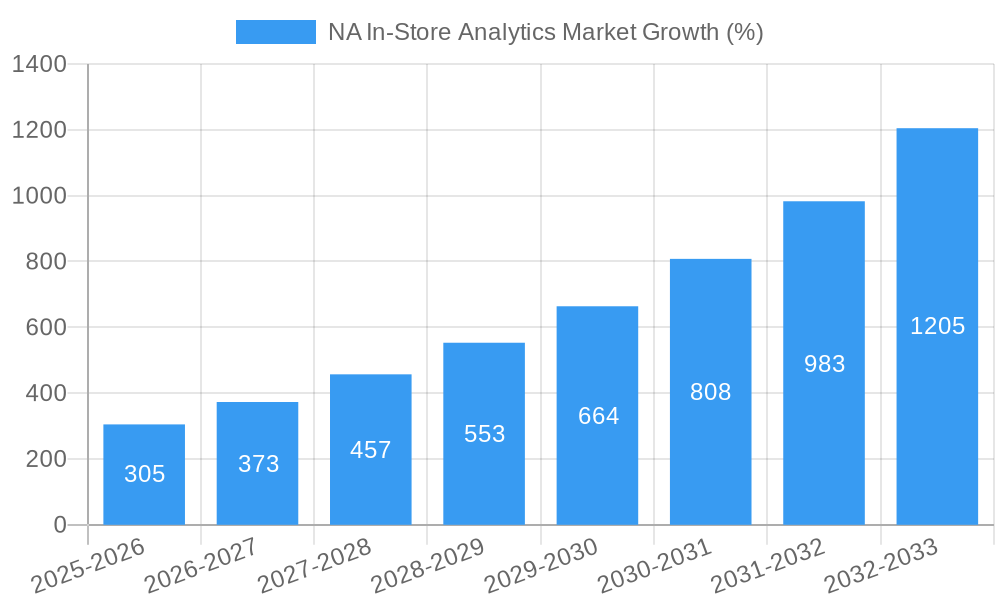
The NA in-store analytics market exhibits robust growth, driven by the increasing need for retailers to optimize operations, enhance customer experience, and gain a competitive edge. Market size has grown steadily over the historical period (2019-2024), with a Compound Annual Growth Rate (CAGR) of xx% and is projected to maintain a CAGR of xx% during the forecast period (2025-2033). Adoption rates are rising across all segments, particularly amongst large enterprises and cloud-based deployments. Technological disruptions, including the rise of AI-powered solutions, are accelerating market evolution. Consumer behavior shifts towards personalized experiences and omnichannel shopping are fueling demand for more insightful data analytics. The market penetration is currently estimated at xx% and is expected to reach xx% by 2033.
Dominant Regions, Countries, or Segments in NA In-Store Analytics Market
The United States dominates the NA in-store analytics market, accounting for a larger share (xx%) of overall revenue, driven by its large retail sector and advanced technological infrastructure. Within segments, the software component holds a significant share (xx%), fueled by increasing demand for sophisticated analytical tools. Cloud-based deployments are witnessing faster growth (xx% CAGR) compared to on-premise solutions, attributed to scalability and cost-effectiveness. Large enterprises are the primary adopters, due to higher budgets and advanced technological needs. Customer management and store operation management applications are leading in adoption, signifying the focus on enhancing customer experience and optimizing operational efficiency.
- United States: Larger market size, advanced tech infrastructure, high retail density.
- Software Component: Growing demand for sophisticated analytical tools.
- Cloud Deployment: Scalability, cost-effectiveness driving faster growth.
- Large Enterprises: Higher budgets, advanced technological needs.
- Customer Management & Store Operation Management Applications: Focus on enhancing CX and operational efficiency.
NA In-Store Analytics Market Product Landscape
Product innovation in the NA in-store analytics market is rapid, with new solutions emerging that integrate AI, machine learning, and computer vision to provide increasingly accurate and actionable insights. These solutions offer advanced capabilities such as real-time data analysis, predictive modeling, and automated reporting. Key features include enhanced data visualization, improved integration with existing retail systems, and support for diverse data sources. Unique selling propositions often revolve around accuracy, ease of use, and the ability to deliver specific business outcomes (e.g., increased sales, improved inventory management).
Key Drivers, Barriers & Challenges in NA In-Store Analytics Market
Key Drivers: The primary drivers include the need to enhance customer experience, optimize store operations, improve inventory management, and gain competitive advantage. Technological advancements such as AI and the growing availability of data are also crucial drivers. Government initiatives promoting digital transformation in the retail sector are also contributing to market growth.
Challenges: High implementation costs, data security concerns, and the complexity of integrating solutions with existing systems pose significant barriers to adoption, especially for smaller retailers. The need for skilled professionals to interpret and utilize data effectively also presents a challenge. Competition from established players and emerging startups impacts pricing strategies and market share. Supply chain disruptions can impact the availability of hardware and software components, potentially hindering growth.
Emerging Opportunities in NA In-Store Analytics Market
Untapped opportunities exist in the application of in-store analytics to niche retail sectors (e.g., specialty stores, pop-up shops), and in integrating in-store analytics with other retail technologies (e.g., loyalty programs, personalized recommendations). The development of more user-friendly solutions with intuitive interfaces will also drive adoption, particularly amongst smaller businesses. The growing adoption of omnichannel strategies creates opportunities to better connect online and offline customer journeys, leveraging in-store data for more effective marketing and customer engagement.
Growth Accelerators in the NA In-Store Analytics Market Industry
Strategic partnerships between technology providers and retailers are accelerating market growth, driving innovation and enabling faster adoption. Technological breakthroughs in AI and machine learning provide more accurate and actionable insights. The expansion of 5G network coverage and improved data connectivity are improving the ability to collect and analyze data in real-time. The increasing focus on creating personalized shopping experiences is also creating an increased need for accurate and timely data.
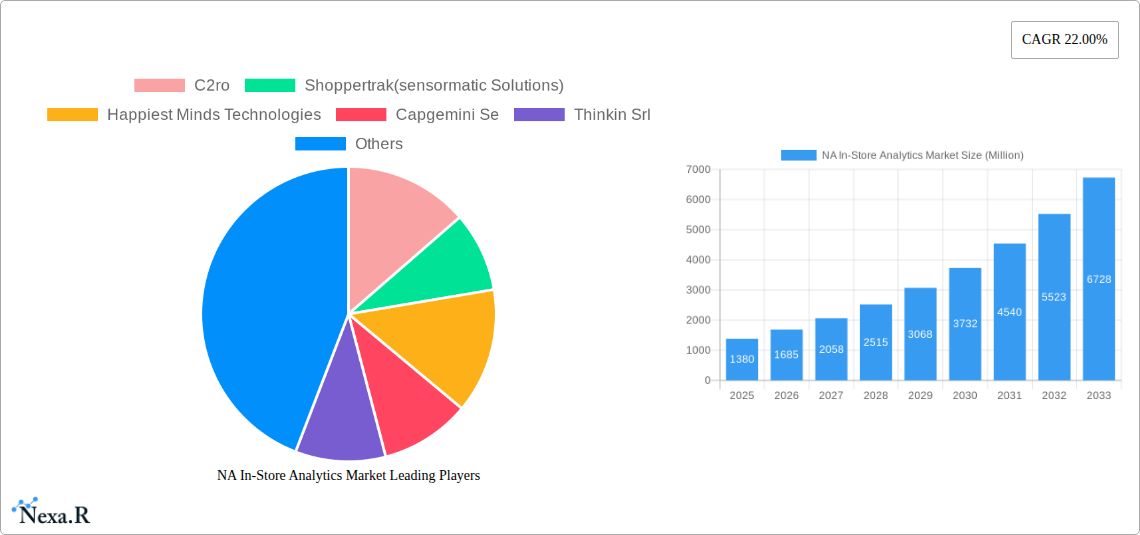
Key Players Shaping the NA In-Store Analytics Market Market
- C2ro
- Shoppertrak (sensormatic Solutions)
- Happiest Minds Technologies
- Capgemini SE
- Thinkin Srl
- Retailnext Inc
- Cisco Meraki (Cisco Systems Inc)
- Cloud4wi Inc
- Capillary Technologies
- Amoobi
- Analytiks AI
- SAP SE
- Trax Image Recognition
Notable Milestones in NA In-Store Analytics Market Sector
- January 2023: Google Cloud launched four new and upgraded AI technologies designed to enhance retail in-store operations and e-commerce experiences.
- July 2023: Acosta and Pensa Systems partnered to leverage in-store data and shelf intelligence for improved retail performance.
In-Depth NA In-Store Analytics Market Market Outlook
The NA in-store analytics market is poised for continued robust growth, driven by technological advancements, strategic partnerships, and the growing demand for data-driven insights. Future opportunities lie in expanding into untapped market segments, developing more sophisticated analytical tools, and leveraging the power of AI and machine learning to deliver greater value to retailers. The strategic integration of in-store analytics with other retail technologies will further enhance its impact on business outcomes and customer experiences. The market's future growth trajectory is projected to remain strong, offering substantial opportunities for both established players and new entrants.
NA In-Store Analytics Market Segmentation
-
1. Component
- 1.1. Software
- 1.2. Services
-
2. Deployment
- 2.1. Cloud
- 2.2. On-premise
-
3. Organization Size
- 3.1. Large Enterprises
- 3.2. Small and Medium Enterprises
-
4. Application
- 4.1. Customer Management
- 4.2. Risk and Compliance Management
- 4.3. Store Operation Management
- 4.4. Marketing and Merchandizing
- 4.5. Other Applications
NA In-Store Analytics Market Segmentation By Geography
-
1. North America
- 1.1. United States
- 1.2. Canada
- 1.3. Mexico
NA In-Store Analytics Market REPORT HIGHLIGHTS
| Aspects | Details |
|---|---|
| Study Period | 2019-2033 |
| Base Year | 2024 |
| Estimated Year | 2025 |
| Forecast Period | 2025-2033 |
| Historical Period | 2019-2024 |
| Growth Rate | CAGR of 22.00% from 2019-2033 |
| Segmentation |
|
Table of Contents
- 1. Introduction
- 1.1. Research Scope
- 1.2. Market Segmentation
- 1.3. Research Methodology
- 1.4. Definitions and Assumptions
- 2. Executive Summary
- 2.1. Introduction
- 3. Market Dynamics
- 3.1. Introduction
- 3.2. Market Drivers
- 3.2.1. Increasing Data Volume In In-store Operations; Need For Better Customer Service And Enhanced Shopping Experience
- 3.3. Market Restrains
- 3.3.1. Lack of Personnel Skills
- 3.4. Market Trends
- 3.4.1. Store Operation Management to Exhibit Good Growth Over the Forecast Period
- 4. Market Factor Analysis
- 4.1. Porters Five Forces
- 4.2. Supply/Value Chain
- 4.3. PESTEL analysis
- 4.4. Market Entropy
- 4.5. Patent/Trademark Analysis
- 5. NA In-Store Analytics Market Analysis, Insights and Forecast, 2019-2031
- 5.1. Market Analysis, Insights and Forecast - by Component
- 5.1.1. Software
- 5.1.2. Services
- 5.2. Market Analysis, Insights and Forecast - by Deployment
- 5.2.1. Cloud
- 5.2.2. On-premise
- 5.3. Market Analysis, Insights and Forecast - by Organization Size
- 5.3.1. Large Enterprises
- 5.3.2. Small and Medium Enterprises
- 5.4. Market Analysis, Insights and Forecast - by Application
- 5.4.1. Customer Management
- 5.4.2. Risk and Compliance Management
- 5.4.3. Store Operation Management
- 5.4.4. Marketing and Merchandizing
- 5.4.5. Other Applications
- 5.5. Market Analysis, Insights and Forecast - by Region
- 5.5.1. North America
- 5.1. Market Analysis, Insights and Forecast - by Component
- 6. North America NA In-Store Analytics Market Analysis, Insights and Forecast, 2019-2031
- 6.1. Market Analysis, Insights and Forecast - By Country/Sub-region
- 6.1.1.
- 7. Europe NA In-Store Analytics Market Analysis, Insights and Forecast, 2019-2031
- 7.1. Market Analysis, Insights and Forecast - By Country/Sub-region
- 7.1.1.
- 8. Asia Pacific NA In-Store Analytics Market Analysis, Insights and Forecast, 2019-2031
- 8.1. Market Analysis, Insights and Forecast - By Country/Sub-region
- 8.1.1.
- 9. Latin America NA In-Store Analytics Market Analysis, Insights and Forecast, 2019-2031
- 9.1. Market Analysis, Insights and Forecast - By Country/Sub-region
- 9.1.1.
- 10. Middle East and Africa NA In-Store Analytics Market Analysis, Insights and Forecast, 2019-2031
- 10.1. Market Analysis, Insights and Forecast - By Country/Sub-region
- 10.1.1.
- 11. Competitive Analysis
- 11.1. Market Share Analysis 2024
- 11.2. Company Profiles
- 11.2.1 C2ro
- 11.2.1.1. Overview
- 11.2.1.2. Products
- 11.2.1.3. SWOT Analysis
- 11.2.1.4. Recent Developments
- 11.2.1.5. Financials (Based on Availability)
- 11.2.2 Shoppertrak(sensormatic Solutions)
- 11.2.2.1. Overview
- 11.2.2.2. Products
- 11.2.2.3. SWOT Analysis
- 11.2.2.4. Recent Developments
- 11.2.2.5. Financials (Based on Availability)
- 11.2.3 Happiest Minds Technologies
- 11.2.3.1. Overview
- 11.2.3.2. Products
- 11.2.3.3. SWOT Analysis
- 11.2.3.4. Recent Developments
- 11.2.3.5. Financials (Based on Availability)
- 11.2.4 Capgemini Se
- 11.2.4.1. Overview
- 11.2.4.2. Products
- 11.2.4.3. SWOT Analysis
- 11.2.4.4. Recent Developments
- 11.2.4.5. Financials (Based on Availability)
- 11.2.5 Thinkin Srl
- 11.2.5.1. Overview
- 11.2.5.2. Products
- 11.2.5.3. SWOT Analysis
- 11.2.5.4. Recent Developments
- 11.2.5.5. Financials (Based on Availability)
- 11.2.6 Retailnext Inc
- 11.2.6.1. Overview
- 11.2.6.2. Products
- 11.2.6.3. SWOT Analysis
- 11.2.6.4. Recent Developments
- 11.2.6.5. Financials (Based on Availability)
- 11.2.7 Cisco Meraki (Cisco Systems Inc )
- 11.2.7.1. Overview
- 11.2.7.2. Products
- 11.2.7.3. SWOT Analysis
- 11.2.7.4. Recent Developments
- 11.2.7.5. Financials (Based on Availability)
- 11.2.8 Cloud4wi Inc
- 11.2.8.1. Overview
- 11.2.8.2. Products
- 11.2.8.3. SWOT Analysis
- 11.2.8.4. Recent Developments
- 11.2.8.5. Financials (Based on Availability)
- 11.2.9 Capillary Technologies
- 11.2.9.1. Overview
- 11.2.9.2. Products
- 11.2.9.3. SWOT Analysis
- 11.2.9.4. Recent Developments
- 11.2.9.5. Financials (Based on Availability)
- 11.2.10 Amoobi
- 11.2.10.1. Overview
- 11.2.10.2. Products
- 11.2.10.3. SWOT Analysis
- 11.2.10.4. Recent Developments
- 11.2.10.5. Financials (Based on Availability)
- 11.2.11 Analytiks AI
- 11.2.11.1. Overview
- 11.2.11.2. Products
- 11.2.11.3. SWOT Analysis
- 11.2.11.4. Recent Developments
- 11.2.11.5. Financials (Based on Availability)
- 11.2.12 SAP SE
- 11.2.12.1. Overview
- 11.2.12.2. Products
- 11.2.12.3. SWOT Analysis
- 11.2.12.4. Recent Developments
- 11.2.12.5. Financials (Based on Availability)
- 11.2.13 Trax Image Recognition
- 11.2.13.1. Overview
- 11.2.13.2. Products
- 11.2.13.3. SWOT Analysis
- 11.2.13.4. Recent Developments
- 11.2.13.5. Financials (Based on Availability)
- 11.2.1 C2ro
List of Figures
- Figure 1: NA In-Store Analytics Market Revenue Breakdown (Million, %) by Product 2024 & 2032
- Figure 2: NA In-Store Analytics Market Share (%) by Company 2024
List of Tables
- Table 1: NA In-Store Analytics Market Revenue Million Forecast, by Region 2019 & 2032
- Table 2: NA In-Store Analytics Market Volume K Unit Forecast, by Region 2019 & 2032
- Table 3: NA In-Store Analytics Market Revenue Million Forecast, by Component 2019 & 2032
- Table 4: NA In-Store Analytics Market Volume K Unit Forecast, by Component 2019 & 2032
- Table 5: NA In-Store Analytics Market Revenue Million Forecast, by Deployment 2019 & 2032
- Table 6: NA In-Store Analytics Market Volume K Unit Forecast, by Deployment 2019 & 2032
- Table 7: NA In-Store Analytics Market Revenue Million Forecast, by Organization Size 2019 & 2032
- Table 8: NA In-Store Analytics Market Volume K Unit Forecast, by Organization Size 2019 & 2032
- Table 9: NA In-Store Analytics Market Revenue Million Forecast, by Application 2019 & 2032
- Table 10: NA In-Store Analytics Market Volume K Unit Forecast, by Application 2019 & 2032
- Table 11: NA In-Store Analytics Market Revenue Million Forecast, by Region 2019 & 2032
- Table 12: NA In-Store Analytics Market Volume K Unit Forecast, by Region 2019 & 2032
- Table 13: NA In-Store Analytics Market Revenue Million Forecast, by Country 2019 & 2032
- Table 14: NA In-Store Analytics Market Volume K Unit Forecast, by Country 2019 & 2032
- Table 15: NA In-Store Analytics Market Revenue (Million) Forecast, by Application 2019 & 2032
- Table 16: NA In-Store Analytics Market Volume (K Unit) Forecast, by Application 2019 & 2032
- Table 17: NA In-Store Analytics Market Revenue Million Forecast, by Country 2019 & 2032
- Table 18: NA In-Store Analytics Market Volume K Unit Forecast, by Country 2019 & 2032
- Table 19: NA In-Store Analytics Market Revenue (Million) Forecast, by Application 2019 & 2032
- Table 20: NA In-Store Analytics Market Volume (K Unit) Forecast, by Application 2019 & 2032
- Table 21: NA In-Store Analytics Market Revenue Million Forecast, by Country 2019 & 2032
- Table 22: NA In-Store Analytics Market Volume K Unit Forecast, by Country 2019 & 2032
- Table 23: NA In-Store Analytics Market Revenue (Million) Forecast, by Application 2019 & 2032
- Table 24: NA In-Store Analytics Market Volume (K Unit) Forecast, by Application 2019 & 2032
- Table 25: NA In-Store Analytics Market Revenue Million Forecast, by Country 2019 & 2032
- Table 26: NA In-Store Analytics Market Volume K Unit Forecast, by Country 2019 & 2032
- Table 27: NA In-Store Analytics Market Revenue (Million) Forecast, by Application 2019 & 2032
- Table 28: NA In-Store Analytics Market Volume (K Unit) Forecast, by Application 2019 & 2032
- Table 29: NA In-Store Analytics Market Revenue Million Forecast, by Country 2019 & 2032
- Table 30: NA In-Store Analytics Market Volume K Unit Forecast, by Country 2019 & 2032
- Table 31: NA In-Store Analytics Market Revenue (Million) Forecast, by Application 2019 & 2032
- Table 32: NA In-Store Analytics Market Volume (K Unit) Forecast, by Application 2019 & 2032
- Table 33: NA In-Store Analytics Market Revenue Million Forecast, by Component 2019 & 2032
- Table 34: NA In-Store Analytics Market Volume K Unit Forecast, by Component 2019 & 2032
- Table 35: NA In-Store Analytics Market Revenue Million Forecast, by Deployment 2019 & 2032
- Table 36: NA In-Store Analytics Market Volume K Unit Forecast, by Deployment 2019 & 2032
- Table 37: NA In-Store Analytics Market Revenue Million Forecast, by Organization Size 2019 & 2032
- Table 38: NA In-Store Analytics Market Volume K Unit Forecast, by Organization Size 2019 & 2032
- Table 39: NA In-Store Analytics Market Revenue Million Forecast, by Application 2019 & 2032
- Table 40: NA In-Store Analytics Market Volume K Unit Forecast, by Application 2019 & 2032
- Table 41: NA In-Store Analytics Market Revenue Million Forecast, by Country 2019 & 2032
- Table 42: NA In-Store Analytics Market Volume K Unit Forecast, by Country 2019 & 2032
- Table 43: United States NA In-Store Analytics Market Revenue (Million) Forecast, by Application 2019 & 2032
- Table 44: United States NA In-Store Analytics Market Volume (K Unit) Forecast, by Application 2019 & 2032
- Table 45: Canada NA In-Store Analytics Market Revenue (Million) Forecast, by Application 2019 & 2032
- Table 46: Canada NA In-Store Analytics Market Volume (K Unit) Forecast, by Application 2019 & 2032
- Table 47: Mexico NA In-Store Analytics Market Revenue (Million) Forecast, by Application 2019 & 2032
- Table 48: Mexico NA In-Store Analytics Market Volume (K Unit) Forecast, by Application 2019 & 2032
Frequently Asked Questions
1. What is the projected Compound Annual Growth Rate (CAGR) of the NA In-Store Analytics Market?
The projected CAGR is approximately 22.00%.
2. Which companies are prominent players in the NA In-Store Analytics Market?
Key companies in the market include C2ro, Shoppertrak(sensormatic Solutions), Happiest Minds Technologies, Capgemini Se, Thinkin Srl, Retailnext Inc, Cisco Meraki (Cisco Systems Inc ), Cloud4wi Inc, Capillary Technologies, Amoobi, Analytiks AI, SAP SE, Trax Image Recognition.
3. What are the main segments of the NA In-Store Analytics Market?
The market segments include Component, Deployment, Organization Size, Application.
4. Can you provide details about the market size?
The market size is estimated to be USD 1.38 Million as of 2022.
5. What are some drivers contributing to market growth?
Increasing Data Volume In In-store Operations; Need For Better Customer Service And Enhanced Shopping Experience.
6. What are the notable trends driving market growth?
Store Operation Management to Exhibit Good Growth Over the Forecast Period.
7. Are there any restraints impacting market growth?
Lack of Personnel Skills.
8. Can you provide examples of recent developments in the market?
July 2023 - Acosta, an Acosta Group agency and a provider of commerce-centric solutions for the modern marketplace to retailers, brands, and foodservice providers, and Pensa Systems, a provider of digital retail shelf inventory management solutions, have partnered to boost revenue growth for CPG retailers and brands with highly accurate retail shelf visibility, strategic business insights as well as in-store execution. The shelf intelligence of the Pensa brand is being integrated into this new partnership by Acosta's analytics, in-store data collection, business intelligence, and merchandising solutions for all retailers on the market.
9. What pricing options are available for accessing the report?
Pricing options include single-user, multi-user, and enterprise licenses priced at USD 4750, USD 4950, and USD 6800 respectively.
10. Is the market size provided in terms of value or volume?
The market size is provided in terms of value, measured in Million and volume, measured in K Unit.
11. Are there any specific market keywords associated with the report?
Yes, the market keyword associated with the report is "NA In-Store Analytics Market," which aids in identifying and referencing the specific market segment covered.
12. How do I determine which pricing option suits my needs best?
The pricing options vary based on user requirements and access needs. Individual users may opt for single-user licenses, while businesses requiring broader access may choose multi-user or enterprise licenses for cost-effective access to the report.
13. Are there any additional resources or data provided in the NA In-Store Analytics Market report?
While the report offers comprehensive insights, it's advisable to review the specific contents or supplementary materials provided to ascertain if additional resources or data are available.
14. How can I stay updated on further developments or reports in the NA In-Store Analytics Market?
To stay informed about further developments, trends, and reports in the NA In-Store Analytics Market, consider subscribing to industry newsletters, following relevant companies and organizations, or regularly checking reputable industry news sources and publications.
Methodology
Step 1 - Identification of Relevant Samples Size from Population Database


Step 2 - Approaches for Defining Global Market Size (Value, Volume* & Price*)

Note*: In applicable scenarios
Step 3 - Data Sources
Primary Research
- Web Analytics
- Survey Reports
- Research Institute
- Latest Research Reports
- Opinion Leaders
Secondary Research
- Annual Reports
- White Paper
- Latest Press Release
- Industry Association
- Paid Database
- Investor Presentations

Step 4 - Data Triangulation
Involves using different sources of information in order to increase the validity of a study
These sources are likely to be stakeholders in a program - participants, other researchers, program staff, other community members, and so on.
Then we put all data in single framework & apply various statistical tools to find out the dynamic on the market.
During the analysis stage, feedback from the stakeholder groups would be compared to determine areas of agreement as well as areas of divergence
