

Key Insights
The North American Managed Mobility Services (MMS) market is experiencing robust growth, driven by the increasing adoption of mobile devices in enterprises across various sectors and the rising need for secure and efficient mobile device management. The market's compound annual growth rate (CAGR) of 20.54% from 2019 to 2024 suggests a significant expansion, and this momentum is expected to continue throughout the forecast period (2025-2033). Key drivers include the escalating demand for enhanced security features to mitigate cyber threats, the increasing complexity of mobile device ecosystems, and the need for improved employee productivity through streamlined mobile device management. The BFSI, retail, and healthcare sectors are major contributors to market growth, reflecting the critical role of mobile devices in their operations and the consequent need for robust MMS solutions. The cloud deployment model is gaining traction due to its scalability, cost-effectiveness, and ease of access. However, concerns related to data security and privacy in cloud-based solutions could pose a slight restraint.
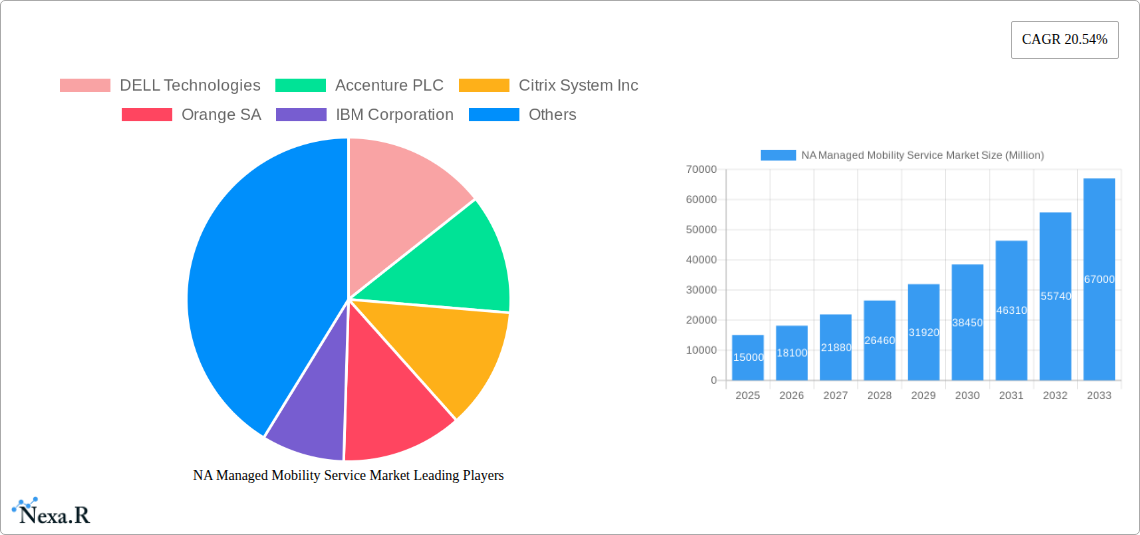
The North American market is dominated by major players like Dell Technologies, Accenture, and IBM, showcasing the strategic importance of MMS. These companies offer comprehensive solutions encompassing Mobile Device Management (MDM), Mobile Application Management (MAM), and Mobile Security. The competitive landscape is characterized by both established technology giants and specialized service providers, leading to innovation and a wide range of options for businesses of all sizes. The on-premise deployment model continues to hold a significant portion of the market share, especially among organizations with stringent security requirements and concerns regarding data sovereignty. However, the shift towards cloud-based solutions is undeniable, and this transition will continue to reshape the market dynamics in the coming years. The high CAGR indicates substantial investment in this sector, fueled by the continuous advancements in mobile technologies and their integration into business operations.
This comprehensive report provides a detailed analysis of the North America Managed Mobility Service (MMS) market, offering invaluable insights for industry professionals, investors, and strategic decision-makers. The report covers the period 2019-2033, with a focus on the estimated year 2025 and a forecast period of 2025-2033. The market is segmented by type, deployment, end-user industry, and geography, providing a granular understanding of its current state and future trajectory. The total market size in 2025 is estimated at xx Million.
NA Managed Mobility Service Market Market Dynamics & Structure
The North American Managed Mobility Service market is characterized by a moderately consolidated structure with key players vying for market share. Technological innovation, particularly in areas like 5G integration, AI-driven security solutions, and automation, is a significant driver of growth. Regulatory frameworks, including data privacy regulations like CCPA and GDPR, influence market dynamics and shape vendor strategies. The market also witnesses competition from alternative solutions such as Bring Your Own Device (BYOD) programs, which present a challenge to MMS providers. The end-user demographic is evolving, with an increasing number of enterprises adopting cloud-based solutions for enhanced scalability and cost-effectiveness. M&A activities are prevalent, with larger players acquiring smaller companies to expand their service portfolios and geographic reach.
- Market Concentration: Moderately consolidated, with the top 5 players holding approximately xx% market share in 2025.
- Technological Innovation: 5G, AI-powered security, and automation are driving market growth.
- Regulatory Framework: CCPA, GDPR, and other data privacy regulations significantly impact market strategies.
- Competitive Substitutes: BYOD programs and internal IT solutions pose competition.
- M&A Activity: xx M&A deals were recorded between 2019 and 2024. The average deal value is estimated at xx Million.
- Innovation Barriers: High initial investment costs, integration complexities, and skills gaps represent key barriers to innovation.
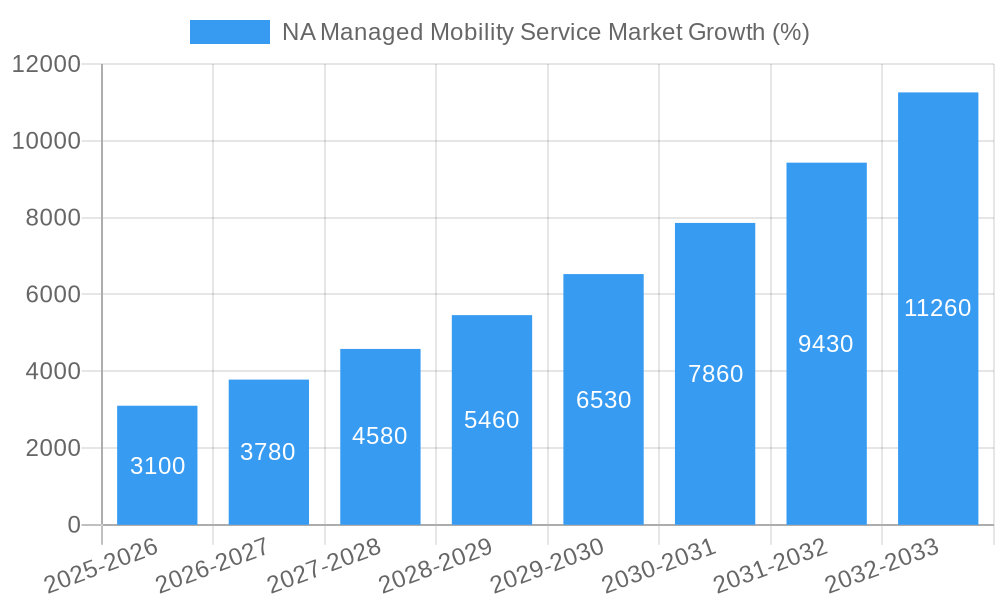
NA Managed Mobility Service Market Growth Trends & Insights
The NA Managed Mobility Service market experienced robust growth during the historical period (2019-2024), driven by increasing mobile device adoption, the rise of remote work, and the growing need for robust security solutions. The market is projected to maintain a healthy CAGR of xx% during the forecast period (2025-2033), reaching an estimated xx Million by 2033. Market penetration is currently at xx% and is expected to reach xx% by 2033, driven by increased awareness of the benefits of managed mobility services and enhanced security concerns. Technological disruptions, such as the widespread adoption of 5G and IoT devices, are further fueling market growth. Consumer behavior shifts towards enhanced mobile device dependence are creating increased demand for comprehensive MMS solutions.
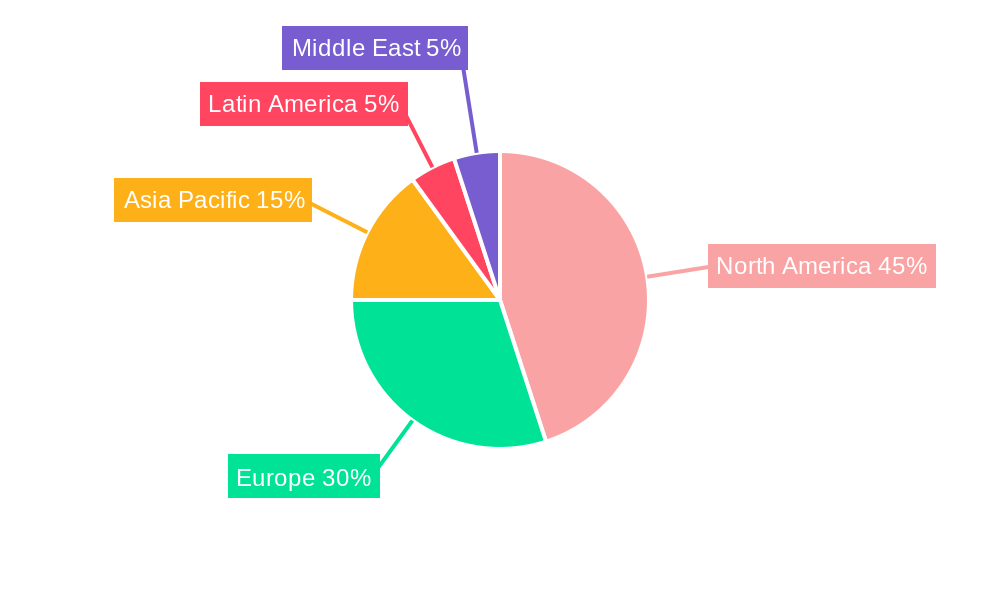
Dominant Regions, Countries, or Segments in NA Managed Mobility Service Market
The United States dominates the North American Managed Mobility Services market, accounting for approximately xx% of the total market value in 2025. Within the segmentation, the Mobile Device Management (MDM) segment holds the largest market share, followed by Mobile Security. The Cloud deployment model is experiencing the fastest growth, driven by its scalability and cost-effectiveness. The BFSI, IT and Telecom, and Healthcare sectors are the key end-user industries driving demand.
- By Type: Mobile Device Management (MDM) holds the largest market share (xx%) in 2025, followed by Mobile Security (xx%).
- By Deployment: Cloud deployment is the fastest-growing segment, with a projected CAGR of xx% during 2025-2033.
- By End-user Industry: BFSI (xx%), IT and Telecom (xx%), and Healthcare (xx%) are the leading sectors.
- Key Drivers (US): Strong digital infrastructure, high mobile device penetration, stringent data security regulations, and robust economic growth.
NA Managed Mobility Service Market Product Landscape
The NA Managed Mobility Service market showcases a diverse range of products and solutions, integrating advanced technologies such as AI, machine learning, and automation to enhance security, streamline device management, and improve operational efficiency. These solutions offer robust features like remote device wipe, application management, security patching, and analytics dashboards providing real-time insights into device performance and security threats. Unique selling propositions often include ease of integration with existing IT infrastructure, tailored solutions for specific industries, and proactive threat detection.
Key Drivers, Barriers & Challenges in NA Managed Mobility Service Market
Key Drivers: The growing adoption of mobile devices in the workplace, the increasing need for secure and reliable mobile solutions, and the rising demand for remote work capabilities are key drivers. Government initiatives promoting digital transformation and investments in 5G infrastructure are also contributing to market growth.
Key Challenges: High implementation costs, security concerns, and the complexity of integrating MMS solutions with existing IT infrastructure pose significant challenges. Competition from alternative solutions and the shortage of skilled professionals also hinder market growth. Supply chain disruptions can impact the availability of devices and services, further adding to challenges.
Emerging Opportunities in NA Managed Mobility Service Market
Emerging opportunities lie in the integration of MMS solutions with IoT devices, the development of advanced security features leveraging AI and machine learning, and the expansion into untapped markets like the education and government sectors. The growing focus on sustainability and the need for environmentally friendly solutions present additional opportunities for innovative MMS providers.
Growth Accelerators in the NA Managed Mobility Service Market Industry
Strategic partnerships between MMS providers and technology companies are accelerating market growth. Technological breakthroughs like 5G and AI are driving innovation and expansion into new applications. Expansion into emerging markets and the adoption of cloud-based solutions are also significantly accelerating market growth.
Key Players Shaping the NA Managed Mobility Service Market Market
- DELL Technologies
- Accenture PLC
- Citrix System Inc
- Orange SA
- IBM Corporation
- Wipro Ltd
- Fujitsu Ltd
- Hewlett Packard Enterprise Company
- Tech Mahindra Limited
- AT&T Inc
- Telefonica SA
Notable Milestones in NA Managed Mobility Service Market Sector
- 2020: Increased adoption of cloud-based MDM solutions due to the pandemic.
- 2021: Launch of several AI-powered mobile security solutions.
- 2022: Significant M&A activity amongst key players.
- 2023: Increased focus on 5G integration within MMS solutions.
In-Depth NA Managed Mobility Service Market Market Outlook
The North American Managed Mobility Service market is poised for substantial growth in the coming years, driven by persistent technological advancements, increasing enterprise adoption of cloud-based solutions, and the growing need for robust security measures. Strategic partnerships and focused investments in R&D will play a crucial role in shaping the market's future. The focus on enhancing user experience and integrating AI-driven capabilities will further propel market expansion.
NA Managed Mobility Service Market Segmentation
-
1. Type
- 1.1. Mobile Device Management
- 1.2. Mobile Security
- 1.3. Mobile Application Management
- 1.4. Other Type
-
2. Deployment
- 2.1. Cloud
- 2.2. On-premise
-
3. End-user Industry
- 3.1. BFSI
- 3.2. Retail
- 3.3. Power and Energy
- 3.4. Manufacturing
- 3.5. IT and Telecom
- 3.6. Education
- 3.7. Healthcare
- 3.8. Other End-user Industry
NA Managed Mobility Service Market Segmentation By Geography
-
1. North America
- 1.1. United States
- 1.2. Canada
- 1.3. Mexico
-
2. South America
- 2.1. Brazil
- 2.2. Argentina
- 2.3. Rest of South America
-
3. Europe
- 3.1. United Kingdom
- 3.2. Germany
- 3.3. France
- 3.4. Italy
- 3.5. Spain
- 3.6. Russia
- 3.7. Benelux
- 3.8. Nordics
- 3.9. Rest of Europe
-
4. Middle East & Africa
- 4.1. Turkey
- 4.2. Israel
- 4.3. GCC
- 4.4. North Africa
- 4.5. South Africa
- 4.6. Rest of Middle East & Africa
-
5. Asia Pacific
- 5.1. China
- 5.2. India
- 5.3. Japan
- 5.4. South Korea
- 5.5. ASEAN
- 5.6. Oceania
- 5.7. Rest of Asia Pacific
NA Managed Mobility Service Market REPORT HIGHLIGHTS
| Aspects | Details |
|---|---|
| Study Period | 2019-2033 |
| Base Year | 2024 |
| Estimated Year | 2025 |
| Forecast Period | 2025-2033 |
| Historical Period | 2019-2024 |
| Growth Rate | CAGR of 20.54% from 2019-2033 |
| Segmentation |
|
Table of Contents
- 1. Introduction
- 1.1. Research Scope
- 1.2. Market Segmentation
- 1.3. Research Methodology
- 1.4. Definitions and Assumptions
- 2. Executive Summary
- 2.1. Introduction
- 3. Market Dynamics
- 3.1. Introduction
- 3.2. Market Drivers
- 3.2.1. ; Increasing Acceptability for BYOD in Organizations; Companies Outsourcing IT Activities
- 3.3. Market Restrains
- 3.3.1. ; Lack of Control over Operations and Cost Visibility
- 3.4. Market Trends
- 3.4.1. Mobile Application Management to Hold Major Share
- 4. Market Factor Analysis
- 4.1. Porters Five Forces
- 4.2. Supply/Value Chain
- 4.3. PESTEL analysis
- 4.4. Market Entropy
- 4.5. Patent/Trademark Analysis
- 5. Global NA Managed Mobility Service Market Analysis, Insights and Forecast, 2019-2031
- 5.1. Market Analysis, Insights and Forecast - by Type
- 5.1.1. Mobile Device Management
- 5.1.2. Mobile Security
- 5.1.3. Mobile Application Management
- 5.1.4. Other Type
- 5.2. Market Analysis, Insights and Forecast - by Deployment
- 5.2.1. Cloud
- 5.2.2. On-premise
- 5.3. Market Analysis, Insights and Forecast - by End-user Industry
- 5.3.1. BFSI
- 5.3.2. Retail
- 5.3.3. Power and Energy
- 5.3.4. Manufacturing
- 5.3.5. IT and Telecom
- 5.3.6. Education
- 5.3.7. Healthcare
- 5.3.8. Other End-user Industry
- 5.4. Market Analysis, Insights and Forecast - by Region
- 5.4.1. North America
- 5.4.2. South America
- 5.4.3. Europe
- 5.4.4. Middle East & Africa
- 5.4.5. Asia Pacific
- 5.1. Market Analysis, Insights and Forecast - by Type
- 6. North America NA Managed Mobility Service Market Analysis, Insights and Forecast, 2019-2031
- 6.1. Market Analysis, Insights and Forecast - by Type
- 6.1.1. Mobile Device Management
- 6.1.2. Mobile Security
- 6.1.3. Mobile Application Management
- 6.1.4. Other Type
- 6.2. Market Analysis, Insights and Forecast - by Deployment
- 6.2.1. Cloud
- 6.2.2. On-premise
- 6.3. Market Analysis, Insights and Forecast - by End-user Industry
- 6.3.1. BFSI
- 6.3.2. Retail
- 6.3.3. Power and Energy
- 6.3.4. Manufacturing
- 6.3.5. IT and Telecom
- 6.3.6. Education
- 6.3.7. Healthcare
- 6.3.8. Other End-user Industry
- 6.1. Market Analysis, Insights and Forecast - by Type
- 7. South America NA Managed Mobility Service Market Analysis, Insights and Forecast, 2019-2031
- 7.1. Market Analysis, Insights and Forecast - by Type
- 7.1.1. Mobile Device Management
- 7.1.2. Mobile Security
- 7.1.3. Mobile Application Management
- 7.1.4. Other Type
- 7.2. Market Analysis, Insights and Forecast - by Deployment
- 7.2.1. Cloud
- 7.2.2. On-premise
- 7.3. Market Analysis, Insights and Forecast - by End-user Industry
- 7.3.1. BFSI
- 7.3.2. Retail
- 7.3.3. Power and Energy
- 7.3.4. Manufacturing
- 7.3.5. IT and Telecom
- 7.3.6. Education
- 7.3.7. Healthcare
- 7.3.8. Other End-user Industry
- 7.1. Market Analysis, Insights and Forecast - by Type
- 8. Europe NA Managed Mobility Service Market Analysis, Insights and Forecast, 2019-2031
- 8.1. Market Analysis, Insights and Forecast - by Type
- 8.1.1. Mobile Device Management
- 8.1.2. Mobile Security
- 8.1.3. Mobile Application Management
- 8.1.4. Other Type
- 8.2. Market Analysis, Insights and Forecast - by Deployment
- 8.2.1. Cloud
- 8.2.2. On-premise
- 8.3. Market Analysis, Insights and Forecast - by End-user Industry
- 8.3.1. BFSI
- 8.3.2. Retail
- 8.3.3. Power and Energy
- 8.3.4. Manufacturing
- 8.3.5. IT and Telecom
- 8.3.6. Education
- 8.3.7. Healthcare
- 8.3.8. Other End-user Industry
- 8.1. Market Analysis, Insights and Forecast - by Type
- 9. Middle East & Africa NA Managed Mobility Service Market Analysis, Insights and Forecast, 2019-2031
- 9.1. Market Analysis, Insights and Forecast - by Type
- 9.1.1. Mobile Device Management
- 9.1.2. Mobile Security
- 9.1.3. Mobile Application Management
- 9.1.4. Other Type
- 9.2. Market Analysis, Insights and Forecast - by Deployment
- 9.2.1. Cloud
- 9.2.2. On-premise
- 9.3. Market Analysis, Insights and Forecast - by End-user Industry
- 9.3.1. BFSI
- 9.3.2. Retail
- 9.3.3. Power and Energy
- 9.3.4. Manufacturing
- 9.3.5. IT and Telecom
- 9.3.6. Education
- 9.3.7. Healthcare
- 9.3.8. Other End-user Industry
- 9.1. Market Analysis, Insights and Forecast - by Type
- 10. Asia Pacific NA Managed Mobility Service Market Analysis, Insights and Forecast, 2019-2031
- 10.1. Market Analysis, Insights and Forecast - by Type
- 10.1.1. Mobile Device Management
- 10.1.2. Mobile Security
- 10.1.3. Mobile Application Management
- 10.1.4. Other Type
- 10.2. Market Analysis, Insights and Forecast - by Deployment
- 10.2.1. Cloud
- 10.2.2. On-premise
- 10.3. Market Analysis, Insights and Forecast - by End-user Industry
- 10.3.1. BFSI
- 10.3.2. Retail
- 10.3.3. Power and Energy
- 10.3.4. Manufacturing
- 10.3.5. IT and Telecom
- 10.3.6. Education
- 10.3.7. Healthcare
- 10.3.8. Other End-user Industry
- 10.1. Market Analysis, Insights and Forecast - by Type
- 11. North America NA Managed Mobility Service Market Analysis, Insights and Forecast, 2019-2031
- 11.1. Market Analysis, Insights and Forecast - By Country/Sub-region
- 11.1.1.
- 12. Europe NA Managed Mobility Service Market Analysis, Insights and Forecast, 2019-2031
- 12.1. Market Analysis, Insights and Forecast - By Country/Sub-region
- 12.1.1.
- 13. Asia Pacific NA Managed Mobility Service Market Analysis, Insights and Forecast, 2019-2031
- 13.1. Market Analysis, Insights and Forecast - By Country/Sub-region
- 13.1.1.
- 14. Latin America NA Managed Mobility Service Market Analysis, Insights and Forecast, 2019-2031
- 14.1. Market Analysis, Insights and Forecast - By Country/Sub-region
- 14.1.1.
- 15. Middle East NA Managed Mobility Service Market Analysis, Insights and Forecast, 2019-2031
- 15.1. Market Analysis, Insights and Forecast - By Country/Sub-region
- 15.1.1.
- 16. Competitive Analysis
- 16.1. Global Market Share Analysis 2024
- 16.2. Company Profiles
- 16.2.1 DELL Technologies
- 16.2.1.1. Overview
- 16.2.1.2. Products
- 16.2.1.3. SWOT Analysis
- 16.2.1.4. Recent Developments
- 16.2.1.5. Financials (Based on Availability)
- 16.2.2 Accenture PLC
- 16.2.2.1. Overview
- 16.2.2.2. Products
- 16.2.2.3. SWOT Analysis
- 16.2.2.4. Recent Developments
- 16.2.2.5. Financials (Based on Availability)
- 16.2.3 Citrix System Inc
- 16.2.3.1. Overview
- 16.2.3.2. Products
- 16.2.3.3. SWOT Analysis
- 16.2.3.4. Recent Developments
- 16.2.3.5. Financials (Based on Availability)
- 16.2.4 Orange SA
- 16.2.4.1. Overview
- 16.2.4.2. Products
- 16.2.4.3. SWOT Analysis
- 16.2.4.4. Recent Developments
- 16.2.4.5. Financials (Based on Availability)
- 16.2.5 IBM Corporation
- 16.2.5.1. Overview
- 16.2.5.2. Products
- 16.2.5.3. SWOT Analysis
- 16.2.5.4. Recent Developments
- 16.2.5.5. Financials (Based on Availability)
- 16.2.6 Wipro Ltd
- 16.2.6.1. Overview
- 16.2.6.2. Products
- 16.2.6.3. SWOT Analysis
- 16.2.6.4. Recent Developments
- 16.2.6.5. Financials (Based on Availability)
- 16.2.7 Fujitsu Ltd
- 16.2.7.1. Overview
- 16.2.7.2. Products
- 16.2.7.3. SWOT Analysis
- 16.2.7.4. Recent Developments
- 16.2.7.5. Financials (Based on Availability)
- 16.2.8 Hewlett Packard Enterprise Company
- 16.2.8.1. Overview
- 16.2.8.2. Products
- 16.2.8.3. SWOT Analysis
- 16.2.8.4. Recent Developments
- 16.2.8.5. Financials (Based on Availability)
- 16.2.9 Tech Mahindra Limited
- 16.2.9.1. Overview
- 16.2.9.2. Products
- 16.2.9.3. SWOT Analysis
- 16.2.9.4. Recent Developments
- 16.2.9.5. Financials (Based on Availability)
- 16.2.10 AT&T Inc
- 16.2.10.1. Overview
- 16.2.10.2. Products
- 16.2.10.3. SWOT Analysis
- 16.2.10.4. Recent Developments
- 16.2.10.5. Financials (Based on Availability)
- 16.2.11 Telefonica SA
- 16.2.11.1. Overview
- 16.2.11.2. Products
- 16.2.11.3. SWOT Analysis
- 16.2.11.4. Recent Developments
- 16.2.11.5. Financials (Based on Availability)
- 16.2.1 DELL Technologies
List of Figures
- Figure 1: Global NA Managed Mobility Service Market Revenue Breakdown (Million, %) by Region 2024 & 2032
- Figure 2: Global NA Managed Mobility Service Market Volume Breakdown (K Unit, %) by Region 2024 & 2032
- Figure 3: North America NA Managed Mobility Service Market Revenue (Million), by Country 2024 & 2032
- Figure 4: North America NA Managed Mobility Service Market Volume (K Unit), by Country 2024 & 2032
- Figure 5: North America NA Managed Mobility Service Market Revenue Share (%), by Country 2024 & 2032
- Figure 6: North America NA Managed Mobility Service Market Volume Share (%), by Country 2024 & 2032
- Figure 7: Europe NA Managed Mobility Service Market Revenue (Million), by Country 2024 & 2032
- Figure 8: Europe NA Managed Mobility Service Market Volume (K Unit), by Country 2024 & 2032
- Figure 9: Europe NA Managed Mobility Service Market Revenue Share (%), by Country 2024 & 2032
- Figure 10: Europe NA Managed Mobility Service Market Volume Share (%), by Country 2024 & 2032
- Figure 11: Asia Pacific NA Managed Mobility Service Market Revenue (Million), by Country 2024 & 2032
- Figure 12: Asia Pacific NA Managed Mobility Service Market Volume (K Unit), by Country 2024 & 2032
- Figure 13: Asia Pacific NA Managed Mobility Service Market Revenue Share (%), by Country 2024 & 2032
- Figure 14: Asia Pacific NA Managed Mobility Service Market Volume Share (%), by Country 2024 & 2032
- Figure 15: Latin America NA Managed Mobility Service Market Revenue (Million), by Country 2024 & 2032
- Figure 16: Latin America NA Managed Mobility Service Market Volume (K Unit), by Country 2024 & 2032
- Figure 17: Latin America NA Managed Mobility Service Market Revenue Share (%), by Country 2024 & 2032
- Figure 18: Latin America NA Managed Mobility Service Market Volume Share (%), by Country 2024 & 2032
- Figure 19: Middle East NA Managed Mobility Service Market Revenue (Million), by Country 2024 & 2032
- Figure 20: Middle East NA Managed Mobility Service Market Volume (K Unit), by Country 2024 & 2032
- Figure 21: Middle East NA Managed Mobility Service Market Revenue Share (%), by Country 2024 & 2032
- Figure 22: Middle East NA Managed Mobility Service Market Volume Share (%), by Country 2024 & 2032
- Figure 23: North America NA Managed Mobility Service Market Revenue (Million), by Type 2024 & 2032
- Figure 24: North America NA Managed Mobility Service Market Volume (K Unit), by Type 2024 & 2032
- Figure 25: North America NA Managed Mobility Service Market Revenue Share (%), by Type 2024 & 2032
- Figure 26: North America NA Managed Mobility Service Market Volume Share (%), by Type 2024 & 2032
- Figure 27: North America NA Managed Mobility Service Market Revenue (Million), by Deployment 2024 & 2032
- Figure 28: North America NA Managed Mobility Service Market Volume (K Unit), by Deployment 2024 & 2032
- Figure 29: North America NA Managed Mobility Service Market Revenue Share (%), by Deployment 2024 & 2032
- Figure 30: North America NA Managed Mobility Service Market Volume Share (%), by Deployment 2024 & 2032
- Figure 31: North America NA Managed Mobility Service Market Revenue (Million), by End-user Industry 2024 & 2032
- Figure 32: North America NA Managed Mobility Service Market Volume (K Unit), by End-user Industry 2024 & 2032
- Figure 33: North America NA Managed Mobility Service Market Revenue Share (%), by End-user Industry 2024 & 2032
- Figure 34: North America NA Managed Mobility Service Market Volume Share (%), by End-user Industry 2024 & 2032
- Figure 35: North America NA Managed Mobility Service Market Revenue (Million), by Country 2024 & 2032
- Figure 36: North America NA Managed Mobility Service Market Volume (K Unit), by Country 2024 & 2032
- Figure 37: North America NA Managed Mobility Service Market Revenue Share (%), by Country 2024 & 2032
- Figure 38: North America NA Managed Mobility Service Market Volume Share (%), by Country 2024 & 2032
- Figure 39: South America NA Managed Mobility Service Market Revenue (Million), by Type 2024 & 2032
- Figure 40: South America NA Managed Mobility Service Market Volume (K Unit), by Type 2024 & 2032
- Figure 41: South America NA Managed Mobility Service Market Revenue Share (%), by Type 2024 & 2032
- Figure 42: South America NA Managed Mobility Service Market Volume Share (%), by Type 2024 & 2032
- Figure 43: South America NA Managed Mobility Service Market Revenue (Million), by Deployment 2024 & 2032
- Figure 44: South America NA Managed Mobility Service Market Volume (K Unit), by Deployment 2024 & 2032
- Figure 45: South America NA Managed Mobility Service Market Revenue Share (%), by Deployment 2024 & 2032
- Figure 46: South America NA Managed Mobility Service Market Volume Share (%), by Deployment 2024 & 2032
- Figure 47: South America NA Managed Mobility Service Market Revenue (Million), by End-user Industry 2024 & 2032
- Figure 48: South America NA Managed Mobility Service Market Volume (K Unit), by End-user Industry 2024 & 2032
- Figure 49: South America NA Managed Mobility Service Market Revenue Share (%), by End-user Industry 2024 & 2032
- Figure 50: South America NA Managed Mobility Service Market Volume Share (%), by End-user Industry 2024 & 2032
- Figure 51: South America NA Managed Mobility Service Market Revenue (Million), by Country 2024 & 2032
- Figure 52: South America NA Managed Mobility Service Market Volume (K Unit), by Country 2024 & 2032
- Figure 53: South America NA Managed Mobility Service Market Revenue Share (%), by Country 2024 & 2032
- Figure 54: South America NA Managed Mobility Service Market Volume Share (%), by Country 2024 & 2032
- Figure 55: Europe NA Managed Mobility Service Market Revenue (Million), by Type 2024 & 2032
- Figure 56: Europe NA Managed Mobility Service Market Volume (K Unit), by Type 2024 & 2032
- Figure 57: Europe NA Managed Mobility Service Market Revenue Share (%), by Type 2024 & 2032
- Figure 58: Europe NA Managed Mobility Service Market Volume Share (%), by Type 2024 & 2032
- Figure 59: Europe NA Managed Mobility Service Market Revenue (Million), by Deployment 2024 & 2032
- Figure 60: Europe NA Managed Mobility Service Market Volume (K Unit), by Deployment 2024 & 2032
- Figure 61: Europe NA Managed Mobility Service Market Revenue Share (%), by Deployment 2024 & 2032
- Figure 62: Europe NA Managed Mobility Service Market Volume Share (%), by Deployment 2024 & 2032
- Figure 63: Europe NA Managed Mobility Service Market Revenue (Million), by End-user Industry 2024 & 2032
- Figure 64: Europe NA Managed Mobility Service Market Volume (K Unit), by End-user Industry 2024 & 2032
- Figure 65: Europe NA Managed Mobility Service Market Revenue Share (%), by End-user Industry 2024 & 2032
- Figure 66: Europe NA Managed Mobility Service Market Volume Share (%), by End-user Industry 2024 & 2032
- Figure 67: Europe NA Managed Mobility Service Market Revenue (Million), by Country 2024 & 2032
- Figure 68: Europe NA Managed Mobility Service Market Volume (K Unit), by Country 2024 & 2032
- Figure 69: Europe NA Managed Mobility Service Market Revenue Share (%), by Country 2024 & 2032
- Figure 70: Europe NA Managed Mobility Service Market Volume Share (%), by Country 2024 & 2032
- Figure 71: Middle East & Africa NA Managed Mobility Service Market Revenue (Million), by Type 2024 & 2032
- Figure 72: Middle East & Africa NA Managed Mobility Service Market Volume (K Unit), by Type 2024 & 2032
- Figure 73: Middle East & Africa NA Managed Mobility Service Market Revenue Share (%), by Type 2024 & 2032
- Figure 74: Middle East & Africa NA Managed Mobility Service Market Volume Share (%), by Type 2024 & 2032
- Figure 75: Middle East & Africa NA Managed Mobility Service Market Revenue (Million), by Deployment 2024 & 2032
- Figure 76: Middle East & Africa NA Managed Mobility Service Market Volume (K Unit), by Deployment 2024 & 2032
- Figure 77: Middle East & Africa NA Managed Mobility Service Market Revenue Share (%), by Deployment 2024 & 2032
- Figure 78: Middle East & Africa NA Managed Mobility Service Market Volume Share (%), by Deployment 2024 & 2032
- Figure 79: Middle East & Africa NA Managed Mobility Service Market Revenue (Million), by End-user Industry 2024 & 2032
- Figure 80: Middle East & Africa NA Managed Mobility Service Market Volume (K Unit), by End-user Industry 2024 & 2032
- Figure 81: Middle East & Africa NA Managed Mobility Service Market Revenue Share (%), by End-user Industry 2024 & 2032
- Figure 82: Middle East & Africa NA Managed Mobility Service Market Volume Share (%), by End-user Industry 2024 & 2032
- Figure 83: Middle East & Africa NA Managed Mobility Service Market Revenue (Million), by Country 2024 & 2032
- Figure 84: Middle East & Africa NA Managed Mobility Service Market Volume (K Unit), by Country 2024 & 2032
- Figure 85: Middle East & Africa NA Managed Mobility Service Market Revenue Share (%), by Country 2024 & 2032
- Figure 86: Middle East & Africa NA Managed Mobility Service Market Volume Share (%), by Country 2024 & 2032
- Figure 87: Asia Pacific NA Managed Mobility Service Market Revenue (Million), by Type 2024 & 2032
- Figure 88: Asia Pacific NA Managed Mobility Service Market Volume (K Unit), by Type 2024 & 2032
- Figure 89: Asia Pacific NA Managed Mobility Service Market Revenue Share (%), by Type 2024 & 2032
- Figure 90: Asia Pacific NA Managed Mobility Service Market Volume Share (%), by Type 2024 & 2032
- Figure 91: Asia Pacific NA Managed Mobility Service Market Revenue (Million), by Deployment 2024 & 2032
- Figure 92: Asia Pacific NA Managed Mobility Service Market Volume (K Unit), by Deployment 2024 & 2032
- Figure 93: Asia Pacific NA Managed Mobility Service Market Revenue Share (%), by Deployment 2024 & 2032
- Figure 94: Asia Pacific NA Managed Mobility Service Market Volume Share (%), by Deployment 2024 & 2032
- Figure 95: Asia Pacific NA Managed Mobility Service Market Revenue (Million), by End-user Industry 2024 & 2032
- Figure 96: Asia Pacific NA Managed Mobility Service Market Volume (K Unit), by End-user Industry 2024 & 2032
- Figure 97: Asia Pacific NA Managed Mobility Service Market Revenue Share (%), by End-user Industry 2024 & 2032
- Figure 98: Asia Pacific NA Managed Mobility Service Market Volume Share (%), by End-user Industry 2024 & 2032
- Figure 99: Asia Pacific NA Managed Mobility Service Market Revenue (Million), by Country 2024 & 2032
- Figure 100: Asia Pacific NA Managed Mobility Service Market Volume (K Unit), by Country 2024 & 2032
- Figure 101: Asia Pacific NA Managed Mobility Service Market Revenue Share (%), by Country 2024 & 2032
- Figure 102: Asia Pacific NA Managed Mobility Service Market Volume Share (%), by Country 2024 & 2032
List of Tables
- Table 1: Global NA Managed Mobility Service Market Revenue Million Forecast, by Region 2019 & 2032
- Table 2: Global NA Managed Mobility Service Market Volume K Unit Forecast, by Region 2019 & 2032
- Table 3: Global NA Managed Mobility Service Market Revenue Million Forecast, by Type 2019 & 2032
- Table 4: Global NA Managed Mobility Service Market Volume K Unit Forecast, by Type 2019 & 2032
- Table 5: Global NA Managed Mobility Service Market Revenue Million Forecast, by Deployment 2019 & 2032
- Table 6: Global NA Managed Mobility Service Market Volume K Unit Forecast, by Deployment 2019 & 2032
- Table 7: Global NA Managed Mobility Service Market Revenue Million Forecast, by End-user Industry 2019 & 2032
- Table 8: Global NA Managed Mobility Service Market Volume K Unit Forecast, by End-user Industry 2019 & 2032
- Table 9: Global NA Managed Mobility Service Market Revenue Million Forecast, by Region 2019 & 2032
- Table 10: Global NA Managed Mobility Service Market Volume K Unit Forecast, by Region 2019 & 2032
- Table 11: Global NA Managed Mobility Service Market Revenue Million Forecast, by Country 2019 & 2032
- Table 12: Global NA Managed Mobility Service Market Volume K Unit Forecast, by Country 2019 & 2032
- Table 13: NA Managed Mobility Service Market Revenue (Million) Forecast, by Application 2019 & 2032
- Table 14: NA Managed Mobility Service Market Volume (K Unit) Forecast, by Application 2019 & 2032
- Table 15: Global NA Managed Mobility Service Market Revenue Million Forecast, by Country 2019 & 2032
- Table 16: Global NA Managed Mobility Service Market Volume K Unit Forecast, by Country 2019 & 2032
- Table 17: NA Managed Mobility Service Market Revenue (Million) Forecast, by Application 2019 & 2032
- Table 18: NA Managed Mobility Service Market Volume (K Unit) Forecast, by Application 2019 & 2032
- Table 19: Global NA Managed Mobility Service Market Revenue Million Forecast, by Country 2019 & 2032
- Table 20: Global NA Managed Mobility Service Market Volume K Unit Forecast, by Country 2019 & 2032
- Table 21: NA Managed Mobility Service Market Revenue (Million) Forecast, by Application 2019 & 2032
- Table 22: NA Managed Mobility Service Market Volume (K Unit) Forecast, by Application 2019 & 2032
- Table 23: Global NA Managed Mobility Service Market Revenue Million Forecast, by Country 2019 & 2032
- Table 24: Global NA Managed Mobility Service Market Volume K Unit Forecast, by Country 2019 & 2032
- Table 25: NA Managed Mobility Service Market Revenue (Million) Forecast, by Application 2019 & 2032
- Table 26: NA Managed Mobility Service Market Volume (K Unit) Forecast, by Application 2019 & 2032
- Table 27: Global NA Managed Mobility Service Market Revenue Million Forecast, by Country 2019 & 2032
- Table 28: Global NA Managed Mobility Service Market Volume K Unit Forecast, by Country 2019 & 2032
- Table 29: NA Managed Mobility Service Market Revenue (Million) Forecast, by Application 2019 & 2032
- Table 30: NA Managed Mobility Service Market Volume (K Unit) Forecast, by Application 2019 & 2032
- Table 31: Global NA Managed Mobility Service Market Revenue Million Forecast, by Type 2019 & 2032
- Table 32: Global NA Managed Mobility Service Market Volume K Unit Forecast, by Type 2019 & 2032
- Table 33: Global NA Managed Mobility Service Market Revenue Million Forecast, by Deployment 2019 & 2032
- Table 34: Global NA Managed Mobility Service Market Volume K Unit Forecast, by Deployment 2019 & 2032
- Table 35: Global NA Managed Mobility Service Market Revenue Million Forecast, by End-user Industry 2019 & 2032
- Table 36: Global NA Managed Mobility Service Market Volume K Unit Forecast, by End-user Industry 2019 & 2032
- Table 37: Global NA Managed Mobility Service Market Revenue Million Forecast, by Country 2019 & 2032
- Table 38: Global NA Managed Mobility Service Market Volume K Unit Forecast, by Country 2019 & 2032
- Table 39: United States NA Managed Mobility Service Market Revenue (Million) Forecast, by Application 2019 & 2032
- Table 40: United States NA Managed Mobility Service Market Volume (K Unit) Forecast, by Application 2019 & 2032
- Table 41: Canada NA Managed Mobility Service Market Revenue (Million) Forecast, by Application 2019 & 2032
- Table 42: Canada NA Managed Mobility Service Market Volume (K Unit) Forecast, by Application 2019 & 2032
- Table 43: Mexico NA Managed Mobility Service Market Revenue (Million) Forecast, by Application 2019 & 2032
- Table 44: Mexico NA Managed Mobility Service Market Volume (K Unit) Forecast, by Application 2019 & 2032
- Table 45: Global NA Managed Mobility Service Market Revenue Million Forecast, by Type 2019 & 2032
- Table 46: Global NA Managed Mobility Service Market Volume K Unit Forecast, by Type 2019 & 2032
- Table 47: Global NA Managed Mobility Service Market Revenue Million Forecast, by Deployment 2019 & 2032
- Table 48: Global NA Managed Mobility Service Market Volume K Unit Forecast, by Deployment 2019 & 2032
- Table 49: Global NA Managed Mobility Service Market Revenue Million Forecast, by End-user Industry 2019 & 2032
- Table 50: Global NA Managed Mobility Service Market Volume K Unit Forecast, by End-user Industry 2019 & 2032
- Table 51: Global NA Managed Mobility Service Market Revenue Million Forecast, by Country 2019 & 2032
- Table 52: Global NA Managed Mobility Service Market Volume K Unit Forecast, by Country 2019 & 2032
- Table 53: Brazil NA Managed Mobility Service Market Revenue (Million) Forecast, by Application 2019 & 2032
- Table 54: Brazil NA Managed Mobility Service Market Volume (K Unit) Forecast, by Application 2019 & 2032
- Table 55: Argentina NA Managed Mobility Service Market Revenue (Million) Forecast, by Application 2019 & 2032
- Table 56: Argentina NA Managed Mobility Service Market Volume (K Unit) Forecast, by Application 2019 & 2032
- Table 57: Rest of South America NA Managed Mobility Service Market Revenue (Million) Forecast, by Application 2019 & 2032
- Table 58: Rest of South America NA Managed Mobility Service Market Volume (K Unit) Forecast, by Application 2019 & 2032
- Table 59: Global NA Managed Mobility Service Market Revenue Million Forecast, by Type 2019 & 2032
- Table 60: Global NA Managed Mobility Service Market Volume K Unit Forecast, by Type 2019 & 2032
- Table 61: Global NA Managed Mobility Service Market Revenue Million Forecast, by Deployment 2019 & 2032
- Table 62: Global NA Managed Mobility Service Market Volume K Unit Forecast, by Deployment 2019 & 2032
- Table 63: Global NA Managed Mobility Service Market Revenue Million Forecast, by End-user Industry 2019 & 2032
- Table 64: Global NA Managed Mobility Service Market Volume K Unit Forecast, by End-user Industry 2019 & 2032
- Table 65: Global NA Managed Mobility Service Market Revenue Million Forecast, by Country 2019 & 2032
- Table 66: Global NA Managed Mobility Service Market Volume K Unit Forecast, by Country 2019 & 2032
- Table 67: United Kingdom NA Managed Mobility Service Market Revenue (Million) Forecast, by Application 2019 & 2032
- Table 68: United Kingdom NA Managed Mobility Service Market Volume (K Unit) Forecast, by Application 2019 & 2032
- Table 69: Germany NA Managed Mobility Service Market Revenue (Million) Forecast, by Application 2019 & 2032
- Table 70: Germany NA Managed Mobility Service Market Volume (K Unit) Forecast, by Application 2019 & 2032
- Table 71: France NA Managed Mobility Service Market Revenue (Million) Forecast, by Application 2019 & 2032
- Table 72: France NA Managed Mobility Service Market Volume (K Unit) Forecast, by Application 2019 & 2032
- Table 73: Italy NA Managed Mobility Service Market Revenue (Million) Forecast, by Application 2019 & 2032
- Table 74: Italy NA Managed Mobility Service Market Volume (K Unit) Forecast, by Application 2019 & 2032
- Table 75: Spain NA Managed Mobility Service Market Revenue (Million) Forecast, by Application 2019 & 2032
- Table 76: Spain NA Managed Mobility Service Market Volume (K Unit) Forecast, by Application 2019 & 2032
- Table 77: Russia NA Managed Mobility Service Market Revenue (Million) Forecast, by Application 2019 & 2032
- Table 78: Russia NA Managed Mobility Service Market Volume (K Unit) Forecast, by Application 2019 & 2032
- Table 79: Benelux NA Managed Mobility Service Market Revenue (Million) Forecast, by Application 2019 & 2032
- Table 80: Benelux NA Managed Mobility Service Market Volume (K Unit) Forecast, by Application 2019 & 2032
- Table 81: Nordics NA Managed Mobility Service Market Revenue (Million) Forecast, by Application 2019 & 2032
- Table 82: Nordics NA Managed Mobility Service Market Volume (K Unit) Forecast, by Application 2019 & 2032
- Table 83: Rest of Europe NA Managed Mobility Service Market Revenue (Million) Forecast, by Application 2019 & 2032
- Table 84: Rest of Europe NA Managed Mobility Service Market Volume (K Unit) Forecast, by Application 2019 & 2032
- Table 85: Global NA Managed Mobility Service Market Revenue Million Forecast, by Type 2019 & 2032
- Table 86: Global NA Managed Mobility Service Market Volume K Unit Forecast, by Type 2019 & 2032
- Table 87: Global NA Managed Mobility Service Market Revenue Million Forecast, by Deployment 2019 & 2032
- Table 88: Global NA Managed Mobility Service Market Volume K Unit Forecast, by Deployment 2019 & 2032
- Table 89: Global NA Managed Mobility Service Market Revenue Million Forecast, by End-user Industry 2019 & 2032
- Table 90: Global NA Managed Mobility Service Market Volume K Unit Forecast, by End-user Industry 2019 & 2032
- Table 91: Global NA Managed Mobility Service Market Revenue Million Forecast, by Country 2019 & 2032
- Table 92: Global NA Managed Mobility Service Market Volume K Unit Forecast, by Country 2019 & 2032
- Table 93: Turkey NA Managed Mobility Service Market Revenue (Million) Forecast, by Application 2019 & 2032
- Table 94: Turkey NA Managed Mobility Service Market Volume (K Unit) Forecast, by Application 2019 & 2032
- Table 95: Israel NA Managed Mobility Service Market Revenue (Million) Forecast, by Application 2019 & 2032
- Table 96: Israel NA Managed Mobility Service Market Volume (K Unit) Forecast, by Application 2019 & 2032
- Table 97: GCC NA Managed Mobility Service Market Revenue (Million) Forecast, by Application 2019 & 2032
- Table 98: GCC NA Managed Mobility Service Market Volume (K Unit) Forecast, by Application 2019 & 2032
- Table 99: North Africa NA Managed Mobility Service Market Revenue (Million) Forecast, by Application 2019 & 2032
- Table 100: North Africa NA Managed Mobility Service Market Volume (K Unit) Forecast, by Application 2019 & 2032
- Table 101: South Africa NA Managed Mobility Service Market Revenue (Million) Forecast, by Application 2019 & 2032
- Table 102: South Africa NA Managed Mobility Service Market Volume (K Unit) Forecast, by Application 2019 & 2032
- Table 103: Rest of Middle East & Africa NA Managed Mobility Service Market Revenue (Million) Forecast, by Application 2019 & 2032
- Table 104: Rest of Middle East & Africa NA Managed Mobility Service Market Volume (K Unit) Forecast, by Application 2019 & 2032
- Table 105: Global NA Managed Mobility Service Market Revenue Million Forecast, by Type 2019 & 2032
- Table 106: Global NA Managed Mobility Service Market Volume K Unit Forecast, by Type 2019 & 2032
- Table 107: Global NA Managed Mobility Service Market Revenue Million Forecast, by Deployment 2019 & 2032
- Table 108: Global NA Managed Mobility Service Market Volume K Unit Forecast, by Deployment 2019 & 2032
- Table 109: Global NA Managed Mobility Service Market Revenue Million Forecast, by End-user Industry 2019 & 2032
- Table 110: Global NA Managed Mobility Service Market Volume K Unit Forecast, by End-user Industry 2019 & 2032
- Table 111: Global NA Managed Mobility Service Market Revenue Million Forecast, by Country 2019 & 2032
- Table 112: Global NA Managed Mobility Service Market Volume K Unit Forecast, by Country 2019 & 2032
- Table 113: China NA Managed Mobility Service Market Revenue (Million) Forecast, by Application 2019 & 2032
- Table 114: China NA Managed Mobility Service Market Volume (K Unit) Forecast, by Application 2019 & 2032
- Table 115: India NA Managed Mobility Service Market Revenue (Million) Forecast, by Application 2019 & 2032
- Table 116: India NA Managed Mobility Service Market Volume (K Unit) Forecast, by Application 2019 & 2032
- Table 117: Japan NA Managed Mobility Service Market Revenue (Million) Forecast, by Application 2019 & 2032
- Table 118: Japan NA Managed Mobility Service Market Volume (K Unit) Forecast, by Application 2019 & 2032
- Table 119: South Korea NA Managed Mobility Service Market Revenue (Million) Forecast, by Application 2019 & 2032
- Table 120: South Korea NA Managed Mobility Service Market Volume (K Unit) Forecast, by Application 2019 & 2032
- Table 121: ASEAN NA Managed Mobility Service Market Revenue (Million) Forecast, by Application 2019 & 2032
- Table 122: ASEAN NA Managed Mobility Service Market Volume (K Unit) Forecast, by Application 2019 & 2032
- Table 123: Oceania NA Managed Mobility Service Market Revenue (Million) Forecast, by Application 2019 & 2032
- Table 124: Oceania NA Managed Mobility Service Market Volume (K Unit) Forecast, by Application 2019 & 2032
- Table 125: Rest of Asia Pacific NA Managed Mobility Service Market Revenue (Million) Forecast, by Application 2019 & 2032
- Table 126: Rest of Asia Pacific NA Managed Mobility Service Market Volume (K Unit) Forecast, by Application 2019 & 2032
Frequently Asked Questions
1. What is the projected Compound Annual Growth Rate (CAGR) of the NA Managed Mobility Service Market?
The projected CAGR is approximately 20.54%.
2. Which companies are prominent players in the NA Managed Mobility Service Market?
Key companies in the market include DELL Technologies, Accenture PLC, Citrix System Inc, Orange SA, IBM Corporation, Wipro Ltd, Fujitsu Ltd, Hewlett Packard Enterprise Company, Tech Mahindra Limited, AT&T Inc, Telefonica SA.
3. What are the main segments of the NA Managed Mobility Service Market?
The market segments include Type, Deployment, End-user Industry.
4. Can you provide details about the market size?
The market size is estimated to be USD XX Million as of 2022.
5. What are some drivers contributing to market growth?
; Increasing Acceptability for BYOD in Organizations; Companies Outsourcing IT Activities.
6. What are the notable trends driving market growth?
Mobile Application Management to Hold Major Share.
7. Are there any restraints impacting market growth?
; Lack of Control over Operations and Cost Visibility.
8. Can you provide examples of recent developments in the market?
N/A
9. What pricing options are available for accessing the report?
Pricing options include single-user, multi-user, and enterprise licenses priced at USD 4750, USD 4950, and USD 6800 respectively.
10. Is the market size provided in terms of value or volume?
The market size is provided in terms of value, measured in Million and volume, measured in K Unit.
11. Are there any specific market keywords associated with the report?
Yes, the market keyword associated with the report is "NA Managed Mobility Service Market," which aids in identifying and referencing the specific market segment covered.
12. How do I determine which pricing option suits my needs best?
The pricing options vary based on user requirements and access needs. Individual users may opt for single-user licenses, while businesses requiring broader access may choose multi-user or enterprise licenses for cost-effective access to the report.
13. Are there any additional resources or data provided in the NA Managed Mobility Service Market report?
While the report offers comprehensive insights, it's advisable to review the specific contents or supplementary materials provided to ascertain if additional resources or data are available.
14. How can I stay updated on further developments or reports in the NA Managed Mobility Service Market?
To stay informed about further developments, trends, and reports in the NA Managed Mobility Service Market, consider subscribing to industry newsletters, following relevant companies and organizations, or regularly checking reputable industry news sources and publications.
Methodology
Step 1 - Identification of Relevant Samples Size from Population Database


Step 2 - Approaches for Defining Global Market Size (Value, Volume* & Price*)

Note*: In applicable scenarios
Step 3 - Data Sources
Primary Research
- Web Analytics
- Survey Reports
- Research Institute
- Latest Research Reports
- Opinion Leaders
Secondary Research
- Annual Reports
- White Paper
- Latest Press Release
- Industry Association
- Paid Database
- Investor Presentations

Step 4 - Data Triangulation
Involves using different sources of information in order to increase the validity of a study
These sources are likely to be stakeholders in a program - participants, other researchers, program staff, other community members, and so on.
Then we put all data in single framework & apply various statistical tools to find out the dynamic on the market.
During the analysis stage, feedback from the stakeholder groups would be compared to determine areas of agreement as well as areas of divergence
