

Key Insights
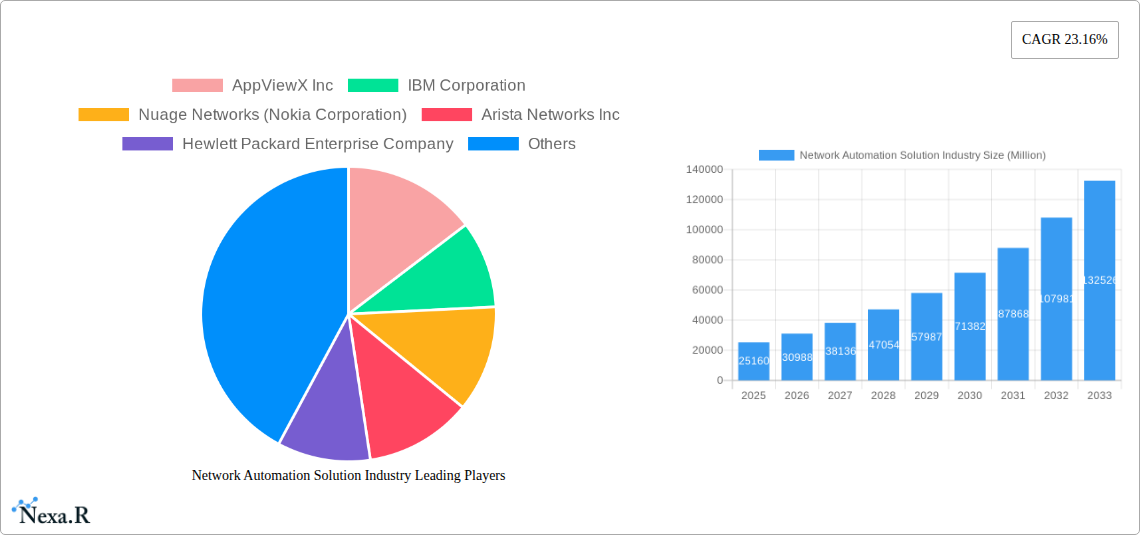
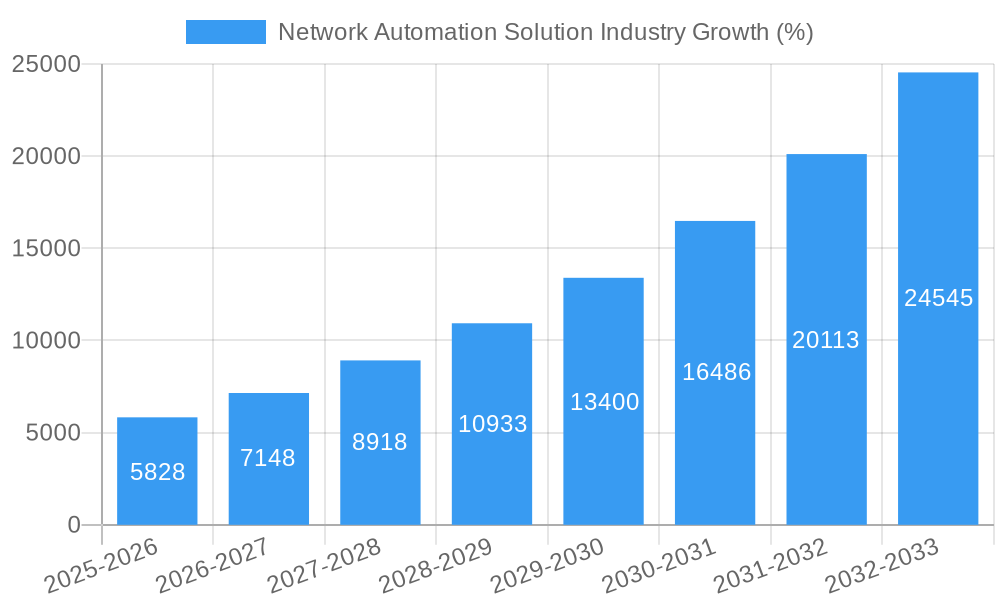
The Network Automation Solution market is experiencing robust growth, projected to reach \$25.16 billion in 2025 and exhibiting a Compound Annual Growth Rate (CAGR) of 23.16% from 2025 to 2033. This expansion is fueled by several key drivers. The increasing complexity of network infrastructure, coupled with the rise of cloud computing and the adoption of hybrid network models, necessitates automated solutions for efficient management and scalability. Furthermore, the growing demand for enhanced network security, reduced operational costs, and improved network performance are pushing organizations towards network automation. The integration of Artificial Intelligence (AI) and Machine Learning (ML) in network automation tools further contributes to this growth by enabling predictive analytics and proactive problem-solving. Key segments driving this growth include cloud-based deployment models, which offer scalability and cost-effectiveness, and the IT and Telecom sector, which is at the forefront of adopting automation technologies. Competition is fierce, with major players like Cisco, IBM, and Juniper Networks vying for market share alongside innovative startups. However, the market also faces challenges such as the high initial investment costs associated with implementing automation solutions and the need for skilled professionals to manage and maintain these systems.
Despite these challenges, the long-term outlook for the Network Automation Solutions market remains exceptionally positive. The continuous evolution of networking technologies, including 5G and edge computing, will further fuel demand for sophisticated automation solutions. The increasing adoption of DevOps methodologies and the need for faster deployment cycles will also contribute significantly to market growth. Geographical expansion is also expected, with regions like Asia-Pacific showing substantial growth potential driven by rapid digital transformation initiatives. The market will likely see further consolidation as established players acquire smaller companies to expand their product portfolios and enhance their market presence. Ultimately, network automation is becoming a critical component of modern IT infrastructure, ensuring agility, reliability, and cost efficiency in the face of growing network complexity.
This comprehensive report provides a detailed analysis of the Network Automation Solution industry, encompassing market size, growth trends, competitive landscape, and future outlook. The study period covers 2019-2033, with 2025 as the base year and a forecast period of 2025-2033. The report segments the market by component, deployment, end-user industry, and network type, offering granular insights into various sub-markets. Key players like Arista Networks, Cisco, and Nokia are profiled, highlighting their contributions to industry innovation.
Network Automation Solution Industry Market Dynamics & Structure
The Network Automation Solution market is experiencing robust growth driven by the increasing complexity of network infrastructure and the need for efficient management. Market concentration is moderate, with several major players holding significant shares, but a dynamic competitive landscape with numerous niche players and startups. The market is characterized by rapid technological innovation, particularly in areas like AI-powered automation and intent-based networking. Regulatory frameworks, while not overly restrictive, are evolving to address security and data privacy concerns. Competitive product substitutes exist in the form of manual network management practices, but automation offers significant advantages in terms of efficiency and scalability.
- Market Size (2024): $xx Million
- Market Concentration: Moderate (Top 5 players hold approximately 40% market share)
- Key Innovation Drivers: AI/ML, Cloud Computing, SDN/NFV
- Regulatory Landscape: Evolving, focusing on security and data privacy.
- M&A Activity (2019-2024): xx deals, primarily focused on technology acquisition and market expansion.
- End-User Demographics: IT and Telecom sector is the largest adopter, followed by BFSI and Manufacturing.
Network Automation Solution Industry Growth Trends & Insights
The Network Automation Solution market is projected to exhibit a Compound Annual Growth Rate (CAGR) of xx% during the forecast period (2025-2033), driven by increasing adoption of cloud computing, the rise of 5G networks, and the growing demand for improved network visibility and security. Market penetration is currently at xx%, with significant room for growth in emerging markets and across various end-user industries. The shift towards software-defined networking (SDN) and network function virtualization (NFV) is significantly impacting the market, leading to increased demand for automated solutions. Consumer behavior is shifting towards a preference for solutions that offer enhanced security and simplified management, driving the adoption of AI and ML-powered automation tools. The overall growth is fuelled by the need to improve network agility, reduce operational costs, and ensure business continuity.
- Market Size (2025): $xx Million
- Market Size (2033): $xx Million
- CAGR (2025-2033): xx%
- Market Penetration (2024): xx%
- Key Growth Drivers: Cloud Adoption, 5G Deployment, Demand for Enhanced Security.
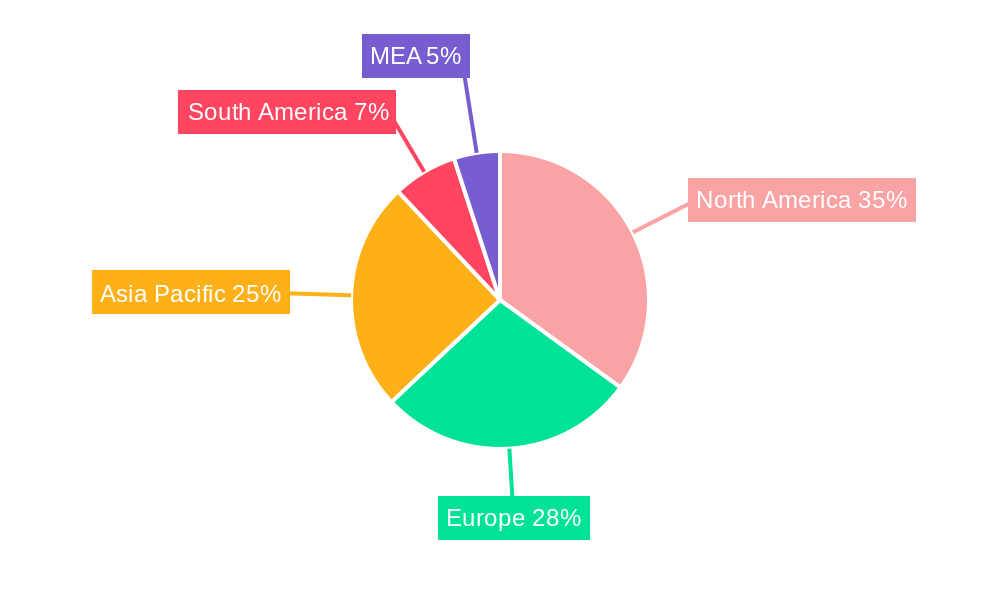
Dominant Regions, Countries, or Segments in Network Automation Solution Industry
North America currently holds the largest market share in the Network Automation Solution industry, followed by Europe and Asia Pacific. Within segments, the Cloud deployment model is experiencing the fastest growth, driven by its scalability and cost-effectiveness. In terms of end-user industries, the IT and Telecom sector dominates due to its high reliance on complex network infrastructure. The intent-based networking service type is gaining significant traction, as it offers simplified network management and improved operational efficiency.
- Leading Region: North America (Market share: xx%)
- Fastest-Growing Segment: Cloud Deployment (CAGR: xx%)
- Largest End-User Industry: IT and Telecom (Market share: xx%)
- High-Growth Service Type: Intent-based Networking (CAGR: xx%)
- Key Drivers: Growing data volumes, need for improved network performance and security.
Network Automation Solution Industry Product Landscape
The Network Automation Solution market encompasses a wide range of products, including network management software, automation platforms, and security tools. Recent innovations focus on AI-powered analytics, increased integration with other IT systems, and enhanced user experience. Key selling propositions include reduced operational costs, improved network agility, and enhanced security posture. Technological advancements are driving the development of more sophisticated and user-friendly solutions, including self-learning algorithms and predictive analytics capabilities.
Key Drivers, Barriers & Challenges in Network Automation Solution Industry
Key Drivers:
- The increasing complexity of network infrastructure
- The need for efficient network management
- The demand for improved network security
- The rise of cloud computing and 5G networks
Key Challenges & Restraints:
- High initial investment costs
- Lack of skilled professionals
- Integration complexities with existing systems
- Security concerns associated with automated systems
Emerging Opportunities in Network Automation Solution Industry
Emerging opportunities include:
- Expanding into untapped markets like small and medium-sized enterprises (SMEs)
- Development of AI-powered solutions for network optimization and security
- Integration with emerging technologies like IoT and edge computing
- Expansion into new service areas like network slicing and edge orchestration
Growth Accelerators in the Network Automation Solution Industry Industry
Long-term growth will be driven by continued technological advancements, strategic partnerships between technology providers and service providers, and aggressive market expansion strategies in emerging economies. Focus on developing user-friendly interfaces and offering robust security features will be crucial.
Key Players Shaping the Network Automation Solution Market
- AppViewX Inc
- IBM Corporation
- Nuage Networks (Nokia Corporation)
- Arista Networks Inc
- Hewlett Packard Enterprise Company
- Cisco Systems Inc
- Broadcom Inc
- Fujitsu Limited
- Juniper Networks Inc
- BMC Software Inc
- Extreme Networks Inc
- NetBrain Technologies Inc
- Forward Networks Inc
- Solarwinds Corporation
- Open Text Corporation
- Fortra LLC
Notable Milestones in Network Automation Solution Industry Sector
- March 2024: Arista announced CloudVision Universal Network Observability (CV UNOTM), enhancing network automation and visibility.
- March 2024: Nokia enhanced its WaveSuite optical network automation platform, improving bandwidth, reliability, and latency.
In-Depth Network Automation Solution Industry Market Outlook
The Network Automation Solution market is poised for significant growth over the next decade, driven by the increasing adoption of cloud-based solutions, the expansion of 5G networks, and a growing demand for improved network security and performance. Strategic partnerships and investments in research and development will be crucial for players to maintain a competitive edge in this rapidly evolving market. The focus on AI and ML will further drive innovation and automation capabilities.
Network Automation Solution Industry Segmentation
-
1. Network Type
- 1.1. Physical
- 1.2. Virtual
- 1.3. Hybrid
-
2. Component
-
2.1. Solution Type
- 2.1.1. Network Automation Tools
- 2.1.2. SD-WAN and Network Virtualization
- 2.1.3. Intent-based Networking
-
2.2. Service Type
- 2.2.1. Managed Service
- 2.2.2. Professional Service
-
2.1. Solution Type
-
3. Deployment
- 3.1. Cloud
- 3.2. On-premise
- 3.3. Hybrid
-
4. End-user Industry
- 4.1. IT and Telecom
- 4.2. Manufacturing
- 4.3. Energy and Utility
- 4.4. Banking and Financial Services
- 4.5. Education
- 4.6. Other End-user Industries
Network Automation Solution Industry Segmentation By Geography
- 1. North America
- 2. Europe
- 3. Asia
- 4. Australia and New Zealand
- 5. Latin America
- 6. Middle East and Africa
Network Automation Solution Industry REPORT HIGHLIGHTS
| Aspects | Details |
|---|---|
| Study Period | 2019-2033 |
| Base Year | 2024 |
| Estimated Year | 2025 |
| Forecast Period | 2025-2033 |
| Historical Period | 2019-2024 |
| Growth Rate | CAGR of 23.16% from 2019-2033 |
| Segmentation |
|
Table of Contents
- 1. Introduction
- 1.1. Research Scope
- 1.2. Market Segmentation
- 1.3. Research Methodology
- 1.4. Definitions and Assumptions
- 2. Executive Summary
- 2.1. Introduction
- 3. Market Dynamics
- 3.1. Introduction
- 3.2. Market Drivers
- 3.2.1. Increasing Demand for Data Center Network; Rising Trend of Connected Devices
- 3.3. Market Restrains
- 3.3.1. Lack of Skilled Professional Across Industries
- 3.4. Market Trends
- 3.4.1. IT and Telecom End-user Industry is Expected to Hold Significant Market Share
- 4. Market Factor Analysis
- 4.1. Porters Five Forces
- 4.2. Supply/Value Chain
- 4.3. PESTEL analysis
- 4.4. Market Entropy
- 4.5. Patent/Trademark Analysis
- 5. Global Network Automation Solution Industry Analysis, Insights and Forecast, 2019-2031
- 5.1. Market Analysis, Insights and Forecast - by Network Type
- 5.1.1. Physical
- 5.1.2. Virtual
- 5.1.3. Hybrid
- 5.2. Market Analysis, Insights and Forecast - by Component
- 5.2.1. Solution Type
- 5.2.1.1. Network Automation Tools
- 5.2.1.2. SD-WAN and Network Virtualization
- 5.2.1.3. Intent-based Networking
- 5.2.2. Service Type
- 5.2.2.1. Managed Service
- 5.2.2.2. Professional Service
- 5.2.1. Solution Type
- 5.3. Market Analysis, Insights and Forecast - by Deployment
- 5.3.1. Cloud
- 5.3.2. On-premise
- 5.3.3. Hybrid
- 5.4. Market Analysis, Insights and Forecast - by End-user Industry
- 5.4.1. IT and Telecom
- 5.4.2. Manufacturing
- 5.4.3. Energy and Utility
- 5.4.4. Banking and Financial Services
- 5.4.5. Education
- 5.4.6. Other End-user Industries
- 5.5. Market Analysis, Insights and Forecast - by Region
- 5.5.1. North America
- 5.5.2. Europe
- 5.5.3. Asia
- 5.5.4. Australia and New Zealand
- 5.5.5. Latin America
- 5.5.6. Middle East and Africa
- 5.1. Market Analysis, Insights and Forecast - by Network Type
- 6. North America Network Automation Solution Industry Analysis, Insights and Forecast, 2019-2031
- 6.1. Market Analysis, Insights and Forecast - by Network Type
- 6.1.1. Physical
- 6.1.2. Virtual
- 6.1.3. Hybrid
- 6.2. Market Analysis, Insights and Forecast - by Component
- 6.2.1. Solution Type
- 6.2.1.1. Network Automation Tools
- 6.2.1.2. SD-WAN and Network Virtualization
- 6.2.1.3. Intent-based Networking
- 6.2.2. Service Type
- 6.2.2.1. Managed Service
- 6.2.2.2. Professional Service
- 6.2.1. Solution Type
- 6.3. Market Analysis, Insights and Forecast - by Deployment
- 6.3.1. Cloud
- 6.3.2. On-premise
- 6.3.3. Hybrid
- 6.4. Market Analysis, Insights and Forecast - by End-user Industry
- 6.4.1. IT and Telecom
- 6.4.2. Manufacturing
- 6.4.3. Energy and Utility
- 6.4.4. Banking and Financial Services
- 6.4.5. Education
- 6.4.6. Other End-user Industries
- 6.1. Market Analysis, Insights and Forecast - by Network Type
- 7. Europe Network Automation Solution Industry Analysis, Insights and Forecast, 2019-2031
- 7.1. Market Analysis, Insights and Forecast - by Network Type
- 7.1.1. Physical
- 7.1.2. Virtual
- 7.1.3. Hybrid
- 7.2. Market Analysis, Insights and Forecast - by Component
- 7.2.1. Solution Type
- 7.2.1.1. Network Automation Tools
- 7.2.1.2. SD-WAN and Network Virtualization
- 7.2.1.3. Intent-based Networking
- 7.2.2. Service Type
- 7.2.2.1. Managed Service
- 7.2.2.2. Professional Service
- 7.2.1. Solution Type
- 7.3. Market Analysis, Insights and Forecast - by Deployment
- 7.3.1. Cloud
- 7.3.2. On-premise
- 7.3.3. Hybrid
- 7.4. Market Analysis, Insights and Forecast - by End-user Industry
- 7.4.1. IT and Telecom
- 7.4.2. Manufacturing
- 7.4.3. Energy and Utility
- 7.4.4. Banking and Financial Services
- 7.4.5. Education
- 7.4.6. Other End-user Industries
- 7.1. Market Analysis, Insights and Forecast - by Network Type
- 8. Asia Network Automation Solution Industry Analysis, Insights and Forecast, 2019-2031
- 8.1. Market Analysis, Insights and Forecast - by Network Type
- 8.1.1. Physical
- 8.1.2. Virtual
- 8.1.3. Hybrid
- 8.2. Market Analysis, Insights and Forecast - by Component
- 8.2.1. Solution Type
- 8.2.1.1. Network Automation Tools
- 8.2.1.2. SD-WAN and Network Virtualization
- 8.2.1.3. Intent-based Networking
- 8.2.2. Service Type
- 8.2.2.1. Managed Service
- 8.2.2.2. Professional Service
- 8.2.1. Solution Type
- 8.3. Market Analysis, Insights and Forecast - by Deployment
- 8.3.1. Cloud
- 8.3.2. On-premise
- 8.3.3. Hybrid
- 8.4. Market Analysis, Insights and Forecast - by End-user Industry
- 8.4.1. IT and Telecom
- 8.4.2. Manufacturing
- 8.4.3. Energy and Utility
- 8.4.4. Banking and Financial Services
- 8.4.5. Education
- 8.4.6. Other End-user Industries
- 8.1. Market Analysis, Insights and Forecast - by Network Type
- 9. Australia and New Zealand Network Automation Solution Industry Analysis, Insights and Forecast, 2019-2031
- 9.1. Market Analysis, Insights and Forecast - by Network Type
- 9.1.1. Physical
- 9.1.2. Virtual
- 9.1.3. Hybrid
- 9.2. Market Analysis, Insights and Forecast - by Component
- 9.2.1. Solution Type
- 9.2.1.1. Network Automation Tools
- 9.2.1.2. SD-WAN and Network Virtualization
- 9.2.1.3. Intent-based Networking
- 9.2.2. Service Type
- 9.2.2.1. Managed Service
- 9.2.2.2. Professional Service
- 9.2.1. Solution Type
- 9.3. Market Analysis, Insights and Forecast - by Deployment
- 9.3.1. Cloud
- 9.3.2. On-premise
- 9.3.3. Hybrid
- 9.4. Market Analysis, Insights and Forecast - by End-user Industry
- 9.4.1. IT and Telecom
- 9.4.2. Manufacturing
- 9.4.3. Energy and Utility
- 9.4.4. Banking and Financial Services
- 9.4.5. Education
- 9.4.6. Other End-user Industries
- 9.1. Market Analysis, Insights and Forecast - by Network Type
- 10. Latin America Network Automation Solution Industry Analysis, Insights and Forecast, 2019-2031
- 10.1. Market Analysis, Insights and Forecast - by Network Type
- 10.1.1. Physical
- 10.1.2. Virtual
- 10.1.3. Hybrid
- 10.2. Market Analysis, Insights and Forecast - by Component
- 10.2.1. Solution Type
- 10.2.1.1. Network Automation Tools
- 10.2.1.2. SD-WAN and Network Virtualization
- 10.2.1.3. Intent-based Networking
- 10.2.2. Service Type
- 10.2.2.1. Managed Service
- 10.2.2.2. Professional Service
- 10.2.1. Solution Type
- 10.3. Market Analysis, Insights and Forecast - by Deployment
- 10.3.1. Cloud
- 10.3.2. On-premise
- 10.3.3. Hybrid
- 10.4. Market Analysis, Insights and Forecast - by End-user Industry
- 10.4.1. IT and Telecom
- 10.4.2. Manufacturing
- 10.4.3. Energy and Utility
- 10.4.4. Banking and Financial Services
- 10.4.5. Education
- 10.4.6. Other End-user Industries
- 10.1. Market Analysis, Insights and Forecast - by Network Type
- 11. Middle East and Africa Network Automation Solution Industry Analysis, Insights and Forecast, 2019-2031
- 11.1. Market Analysis, Insights and Forecast - by Network Type
- 11.1.1. Physical
- 11.1.2. Virtual
- 11.1.3. Hybrid
- 11.2. Market Analysis, Insights and Forecast - by Component
- 11.2.1. Solution Type
- 11.2.1.1. Network Automation Tools
- 11.2.1.2. SD-WAN and Network Virtualization
- 11.2.1.3. Intent-based Networking
- 11.2.2. Service Type
- 11.2.2.1. Managed Service
- 11.2.2.2. Professional Service
- 11.2.1. Solution Type
- 11.3. Market Analysis, Insights and Forecast - by Deployment
- 11.3.1. Cloud
- 11.3.2. On-premise
- 11.3.3. Hybrid
- 11.4. Market Analysis, Insights and Forecast - by End-user Industry
- 11.4.1. IT and Telecom
- 11.4.2. Manufacturing
- 11.4.3. Energy and Utility
- 11.4.4. Banking and Financial Services
- 11.4.5. Education
- 11.4.6. Other End-user Industries
- 11.1. Market Analysis, Insights and Forecast - by Network Type
- 12. North America Network Automation Solution Industry Analysis, Insights and Forecast, 2019-2031
- 12.1. Market Analysis, Insights and Forecast - By Country/Sub-region
- 12.1.1 United States
- 12.1.2 Canada
- 12.1.3 Mexico
- 13. Europe Network Automation Solution Industry Analysis, Insights and Forecast, 2019-2031
- 13.1. Market Analysis, Insights and Forecast - By Country/Sub-region
- 13.1.1 Germany
- 13.1.2 United Kingdom
- 13.1.3 France
- 13.1.4 Spain
- 13.1.5 Italy
- 13.1.6 Spain
- 13.1.7 Belgium
- 13.1.8 Netherland
- 13.1.9 Nordics
- 13.1.10 Rest of Europe
- 14. Asia Pacific Network Automation Solution Industry Analysis, Insights and Forecast, 2019-2031
- 14.1. Market Analysis, Insights and Forecast - By Country/Sub-region
- 14.1.1 China
- 14.1.2 Japan
- 14.1.3 India
- 14.1.4 South Korea
- 14.1.5 Southeast Asia
- 14.1.6 Australia
- 14.1.7 Indonesia
- 14.1.8 Phillipes
- 14.1.9 Singapore
- 14.1.10 Thailandc
- 14.1.11 Rest of Asia Pacific
- 15. South America Network Automation Solution Industry Analysis, Insights and Forecast, 2019-2031
- 15.1. Market Analysis, Insights and Forecast - By Country/Sub-region
- 15.1.1 Brazil
- 15.1.2 Argentina
- 15.1.3 Peru
- 15.1.4 Chile
- 15.1.5 Colombia
- 15.1.6 Ecuador
- 15.1.7 Venezuela
- 15.1.8 Rest of South America
- 16. North America Network Automation Solution Industry Analysis, Insights and Forecast, 2019-2031
- 16.1. Market Analysis, Insights and Forecast - By Country/Sub-region
- 16.1.1 United States
- 16.1.2 Canada
- 16.1.3 Mexico
- 17. MEA Network Automation Solution Industry Analysis, Insights and Forecast, 2019-2031
- 17.1. Market Analysis, Insights and Forecast - By Country/Sub-region
- 17.1.1 United Arab Emirates
- 17.1.2 Saudi Arabia
- 17.1.3 South Africa
- 17.1.4 Rest of Middle East and Africa
- 18. Competitive Analysis
- 18.1. Global Market Share Analysis 2024
- 18.2. Company Profiles
- 18.2.1 AppViewX Inc
- 18.2.1.1. Overview
- 18.2.1.2. Products
- 18.2.1.3. SWOT Analysis
- 18.2.1.4. Recent Developments
- 18.2.1.5. Financials (Based on Availability)
- 18.2.2 IBM Corporation
- 18.2.2.1. Overview
- 18.2.2.2. Products
- 18.2.2.3. SWOT Analysis
- 18.2.2.4. Recent Developments
- 18.2.2.5. Financials (Based on Availability)
- 18.2.3 Nuage Networks (Nokia Corporation)
- 18.2.3.1. Overview
- 18.2.3.2. Products
- 18.2.3.3. SWOT Analysis
- 18.2.3.4. Recent Developments
- 18.2.3.5. Financials (Based on Availability)
- 18.2.4 Arista Networks Inc
- 18.2.4.1. Overview
- 18.2.4.2. Products
- 18.2.4.3. SWOT Analysis
- 18.2.4.4. Recent Developments
- 18.2.4.5. Financials (Based on Availability)
- 18.2.5 Hewlett Packard Enterprise Company
- 18.2.5.1. Overview
- 18.2.5.2. Products
- 18.2.5.3. SWOT Analysis
- 18.2.5.4. Recent Developments
- 18.2.5.5. Financials (Based on Availability)
- 18.2.6 Cisco Systems Inc
- 18.2.6.1. Overview
- 18.2.6.2. Products
- 18.2.6.3. SWOT Analysis
- 18.2.6.4. Recent Developments
- 18.2.6.5. Financials (Based on Availability)
- 18.2.7 Broadcom Inc
- 18.2.7.1. Overview
- 18.2.7.2. Products
- 18.2.7.3. SWOT Analysis
- 18.2.7.4. Recent Developments
- 18.2.7.5. Financials (Based on Availability)
- 18.2.8 Fujitsu Limited
- 18.2.8.1. Overview
- 18.2.8.2. Products
- 18.2.8.3. SWOT Analysis
- 18.2.8.4. Recent Developments
- 18.2.8.5. Financials (Based on Availability)
- 18.2.9 Juniper Networks Inc
- 18.2.9.1. Overview
- 18.2.9.2. Products
- 18.2.9.3. SWOT Analysis
- 18.2.9.4. Recent Developments
- 18.2.9.5. Financials (Based on Availability)
- 18.2.10 BMC Software Inc
- 18.2.10.1. Overview
- 18.2.10.2. Products
- 18.2.10.3. SWOT Analysis
- 18.2.10.4. Recent Developments
- 18.2.10.5. Financials (Based on Availability)
- 18.2.11 Extreme Networks Inc
- 18.2.11.1. Overview
- 18.2.11.2. Products
- 18.2.11.3. SWOT Analysis
- 18.2.11.4. Recent Developments
- 18.2.11.5. Financials (Based on Availability)
- 18.2.12 NetBrain Technologies Inc
- 18.2.12.1. Overview
- 18.2.12.2. Products
- 18.2.12.3. SWOT Analysis
- 18.2.12.4. Recent Developments
- 18.2.12.5. Financials (Based on Availability)
- 18.2.13 Forward Networks Inc
- 18.2.13.1. Overview
- 18.2.13.2. Products
- 18.2.13.3. SWOT Analysis
- 18.2.13.4. Recent Developments
- 18.2.13.5. Financials (Based on Availability)
- 18.2.14 Solarwinds Corporation
- 18.2.14.1. Overview
- 18.2.14.2. Products
- 18.2.14.3. SWOT Analysis
- 18.2.14.4. Recent Developments
- 18.2.14.5. Financials (Based on Availability)
- 18.2.15 Open Text Corporation
- 18.2.15.1. Overview
- 18.2.15.2. Products
- 18.2.15.3. SWOT Analysis
- 18.2.15.4. Recent Developments
- 18.2.15.5. Financials (Based on Availability)
- 18.2.16 Fortra LLC
- 18.2.16.1. Overview
- 18.2.16.2. Products
- 18.2.16.3. SWOT Analysis
- 18.2.16.4. Recent Developments
- 18.2.16.5. Financials (Based on Availability)
- 18.2.1 AppViewX Inc
List of Figures
- Figure 1: Global Network Automation Solution Industry Revenue Breakdown (Million, %) by Region 2024 & 2032
- Figure 2: North America Network Automation Solution Industry Revenue (Million), by Country 2024 & 2032
- Figure 3: North America Network Automation Solution Industry Revenue Share (%), by Country 2024 & 2032
- Figure 4: Europe Network Automation Solution Industry Revenue (Million), by Country 2024 & 2032
- Figure 5: Europe Network Automation Solution Industry Revenue Share (%), by Country 2024 & 2032
- Figure 6: Asia Pacific Network Automation Solution Industry Revenue (Million), by Country 2024 & 2032
- Figure 7: Asia Pacific Network Automation Solution Industry Revenue Share (%), by Country 2024 & 2032
- Figure 8: South America Network Automation Solution Industry Revenue (Million), by Country 2024 & 2032
- Figure 9: South America Network Automation Solution Industry Revenue Share (%), by Country 2024 & 2032
- Figure 10: North America Network Automation Solution Industry Revenue (Million), by Country 2024 & 2032
- Figure 11: North America Network Automation Solution Industry Revenue Share (%), by Country 2024 & 2032
- Figure 12: MEA Network Automation Solution Industry Revenue (Million), by Country 2024 & 2032
- Figure 13: MEA Network Automation Solution Industry Revenue Share (%), by Country 2024 & 2032
- Figure 14: North America Network Automation Solution Industry Revenue (Million), by Network Type 2024 & 2032
- Figure 15: North America Network Automation Solution Industry Revenue Share (%), by Network Type 2024 & 2032
- Figure 16: North America Network Automation Solution Industry Revenue (Million), by Component 2024 & 2032
- Figure 17: North America Network Automation Solution Industry Revenue Share (%), by Component 2024 & 2032
- Figure 18: North America Network Automation Solution Industry Revenue (Million), by Deployment 2024 & 2032
- Figure 19: North America Network Automation Solution Industry Revenue Share (%), by Deployment 2024 & 2032
- Figure 20: North America Network Automation Solution Industry Revenue (Million), by End-user Industry 2024 & 2032
- Figure 21: North America Network Automation Solution Industry Revenue Share (%), by End-user Industry 2024 & 2032
- Figure 22: North America Network Automation Solution Industry Revenue (Million), by Country 2024 & 2032
- Figure 23: North America Network Automation Solution Industry Revenue Share (%), by Country 2024 & 2032
- Figure 24: Europe Network Automation Solution Industry Revenue (Million), by Network Type 2024 & 2032
- Figure 25: Europe Network Automation Solution Industry Revenue Share (%), by Network Type 2024 & 2032
- Figure 26: Europe Network Automation Solution Industry Revenue (Million), by Component 2024 & 2032
- Figure 27: Europe Network Automation Solution Industry Revenue Share (%), by Component 2024 & 2032
- Figure 28: Europe Network Automation Solution Industry Revenue (Million), by Deployment 2024 & 2032
- Figure 29: Europe Network Automation Solution Industry Revenue Share (%), by Deployment 2024 & 2032
- Figure 30: Europe Network Automation Solution Industry Revenue (Million), by End-user Industry 2024 & 2032
- Figure 31: Europe Network Automation Solution Industry Revenue Share (%), by End-user Industry 2024 & 2032
- Figure 32: Europe Network Automation Solution Industry Revenue (Million), by Country 2024 & 2032
- Figure 33: Europe Network Automation Solution Industry Revenue Share (%), by Country 2024 & 2032
- Figure 34: Asia Network Automation Solution Industry Revenue (Million), by Network Type 2024 & 2032
- Figure 35: Asia Network Automation Solution Industry Revenue Share (%), by Network Type 2024 & 2032
- Figure 36: Asia Network Automation Solution Industry Revenue (Million), by Component 2024 & 2032
- Figure 37: Asia Network Automation Solution Industry Revenue Share (%), by Component 2024 & 2032
- Figure 38: Asia Network Automation Solution Industry Revenue (Million), by Deployment 2024 & 2032
- Figure 39: Asia Network Automation Solution Industry Revenue Share (%), by Deployment 2024 & 2032
- Figure 40: Asia Network Automation Solution Industry Revenue (Million), by End-user Industry 2024 & 2032
- Figure 41: Asia Network Automation Solution Industry Revenue Share (%), by End-user Industry 2024 & 2032
- Figure 42: Asia Network Automation Solution Industry Revenue (Million), by Country 2024 & 2032
- Figure 43: Asia Network Automation Solution Industry Revenue Share (%), by Country 2024 & 2032
- Figure 44: Australia and New Zealand Network Automation Solution Industry Revenue (Million), by Network Type 2024 & 2032
- Figure 45: Australia and New Zealand Network Automation Solution Industry Revenue Share (%), by Network Type 2024 & 2032
- Figure 46: Australia and New Zealand Network Automation Solution Industry Revenue (Million), by Component 2024 & 2032
- Figure 47: Australia and New Zealand Network Automation Solution Industry Revenue Share (%), by Component 2024 & 2032
- Figure 48: Australia and New Zealand Network Automation Solution Industry Revenue (Million), by Deployment 2024 & 2032
- Figure 49: Australia and New Zealand Network Automation Solution Industry Revenue Share (%), by Deployment 2024 & 2032
- Figure 50: Australia and New Zealand Network Automation Solution Industry Revenue (Million), by End-user Industry 2024 & 2032
- Figure 51: Australia and New Zealand Network Automation Solution Industry Revenue Share (%), by End-user Industry 2024 & 2032
- Figure 52: Australia and New Zealand Network Automation Solution Industry Revenue (Million), by Country 2024 & 2032
- Figure 53: Australia and New Zealand Network Automation Solution Industry Revenue Share (%), by Country 2024 & 2032
- Figure 54: Latin America Network Automation Solution Industry Revenue (Million), by Network Type 2024 & 2032
- Figure 55: Latin America Network Automation Solution Industry Revenue Share (%), by Network Type 2024 & 2032
- Figure 56: Latin America Network Automation Solution Industry Revenue (Million), by Component 2024 & 2032
- Figure 57: Latin America Network Automation Solution Industry Revenue Share (%), by Component 2024 & 2032
- Figure 58: Latin America Network Automation Solution Industry Revenue (Million), by Deployment 2024 & 2032
- Figure 59: Latin America Network Automation Solution Industry Revenue Share (%), by Deployment 2024 & 2032
- Figure 60: Latin America Network Automation Solution Industry Revenue (Million), by End-user Industry 2024 & 2032
- Figure 61: Latin America Network Automation Solution Industry Revenue Share (%), by End-user Industry 2024 & 2032
- Figure 62: Latin America Network Automation Solution Industry Revenue (Million), by Country 2024 & 2032
- Figure 63: Latin America Network Automation Solution Industry Revenue Share (%), by Country 2024 & 2032
- Figure 64: Middle East and Africa Network Automation Solution Industry Revenue (Million), by Network Type 2024 & 2032
- Figure 65: Middle East and Africa Network Automation Solution Industry Revenue Share (%), by Network Type 2024 & 2032
- Figure 66: Middle East and Africa Network Automation Solution Industry Revenue (Million), by Component 2024 & 2032
- Figure 67: Middle East and Africa Network Automation Solution Industry Revenue Share (%), by Component 2024 & 2032
- Figure 68: Middle East and Africa Network Automation Solution Industry Revenue (Million), by Deployment 2024 & 2032
- Figure 69: Middle East and Africa Network Automation Solution Industry Revenue Share (%), by Deployment 2024 & 2032
- Figure 70: Middle East and Africa Network Automation Solution Industry Revenue (Million), by End-user Industry 2024 & 2032
- Figure 71: Middle East and Africa Network Automation Solution Industry Revenue Share (%), by End-user Industry 2024 & 2032
- Figure 72: Middle East and Africa Network Automation Solution Industry Revenue (Million), by Country 2024 & 2032
- Figure 73: Middle East and Africa Network Automation Solution Industry Revenue Share (%), by Country 2024 & 2032
List of Tables
- Table 1: Global Network Automation Solution Industry Revenue Million Forecast, by Region 2019 & 2032
- Table 2: Global Network Automation Solution Industry Revenue Million Forecast, by Network Type 2019 & 2032
- Table 3: Global Network Automation Solution Industry Revenue Million Forecast, by Component 2019 & 2032
- Table 4: Global Network Automation Solution Industry Revenue Million Forecast, by Deployment 2019 & 2032
- Table 5: Global Network Automation Solution Industry Revenue Million Forecast, by End-user Industry 2019 & 2032
- Table 6: Global Network Automation Solution Industry Revenue Million Forecast, by Region 2019 & 2032
- Table 7: Global Network Automation Solution Industry Revenue Million Forecast, by Country 2019 & 2032
- Table 8: United States Network Automation Solution Industry Revenue (Million) Forecast, by Application 2019 & 2032
- Table 9: Canada Network Automation Solution Industry Revenue (Million) Forecast, by Application 2019 & 2032
- Table 10: Mexico Network Automation Solution Industry Revenue (Million) Forecast, by Application 2019 & 2032
- Table 11: Global Network Automation Solution Industry Revenue Million Forecast, by Country 2019 & 2032
- Table 12: Germany Network Automation Solution Industry Revenue (Million) Forecast, by Application 2019 & 2032
- Table 13: United Kingdom Network Automation Solution Industry Revenue (Million) Forecast, by Application 2019 & 2032
- Table 14: France Network Automation Solution Industry Revenue (Million) Forecast, by Application 2019 & 2032
- Table 15: Spain Network Automation Solution Industry Revenue (Million) Forecast, by Application 2019 & 2032
- Table 16: Italy Network Automation Solution Industry Revenue (Million) Forecast, by Application 2019 & 2032
- Table 17: Spain Network Automation Solution Industry Revenue (Million) Forecast, by Application 2019 & 2032
- Table 18: Belgium Network Automation Solution Industry Revenue (Million) Forecast, by Application 2019 & 2032
- Table 19: Netherland Network Automation Solution Industry Revenue (Million) Forecast, by Application 2019 & 2032
- Table 20: Nordics Network Automation Solution Industry Revenue (Million) Forecast, by Application 2019 & 2032
- Table 21: Rest of Europe Network Automation Solution Industry Revenue (Million) Forecast, by Application 2019 & 2032
- Table 22: Global Network Automation Solution Industry Revenue Million Forecast, by Country 2019 & 2032
- Table 23: China Network Automation Solution Industry Revenue (Million) Forecast, by Application 2019 & 2032
- Table 24: Japan Network Automation Solution Industry Revenue (Million) Forecast, by Application 2019 & 2032
- Table 25: India Network Automation Solution Industry Revenue (Million) Forecast, by Application 2019 & 2032
- Table 26: South Korea Network Automation Solution Industry Revenue (Million) Forecast, by Application 2019 & 2032
- Table 27: Southeast Asia Network Automation Solution Industry Revenue (Million) Forecast, by Application 2019 & 2032
- Table 28: Australia Network Automation Solution Industry Revenue (Million) Forecast, by Application 2019 & 2032
- Table 29: Indonesia Network Automation Solution Industry Revenue (Million) Forecast, by Application 2019 & 2032
- Table 30: Phillipes Network Automation Solution Industry Revenue (Million) Forecast, by Application 2019 & 2032
- Table 31: Singapore Network Automation Solution Industry Revenue (Million) Forecast, by Application 2019 & 2032
- Table 32: Thailandc Network Automation Solution Industry Revenue (Million) Forecast, by Application 2019 & 2032
- Table 33: Rest of Asia Pacific Network Automation Solution Industry Revenue (Million) Forecast, by Application 2019 & 2032
- Table 34: Global Network Automation Solution Industry Revenue Million Forecast, by Country 2019 & 2032
- Table 35: Brazil Network Automation Solution Industry Revenue (Million) Forecast, by Application 2019 & 2032
- Table 36: Argentina Network Automation Solution Industry Revenue (Million) Forecast, by Application 2019 & 2032
- Table 37: Peru Network Automation Solution Industry Revenue (Million) Forecast, by Application 2019 & 2032
- Table 38: Chile Network Automation Solution Industry Revenue (Million) Forecast, by Application 2019 & 2032
- Table 39: Colombia Network Automation Solution Industry Revenue (Million) Forecast, by Application 2019 & 2032
- Table 40: Ecuador Network Automation Solution Industry Revenue (Million) Forecast, by Application 2019 & 2032
- Table 41: Venezuela Network Automation Solution Industry Revenue (Million) Forecast, by Application 2019 & 2032
- Table 42: Rest of South America Network Automation Solution Industry Revenue (Million) Forecast, by Application 2019 & 2032
- Table 43: Global Network Automation Solution Industry Revenue Million Forecast, by Country 2019 & 2032
- Table 44: United States Network Automation Solution Industry Revenue (Million) Forecast, by Application 2019 & 2032
- Table 45: Canada Network Automation Solution Industry Revenue (Million) Forecast, by Application 2019 & 2032
- Table 46: Mexico Network Automation Solution Industry Revenue (Million) Forecast, by Application 2019 & 2032
- Table 47: Global Network Automation Solution Industry Revenue Million Forecast, by Country 2019 & 2032
- Table 48: United Arab Emirates Network Automation Solution Industry Revenue (Million) Forecast, by Application 2019 & 2032
- Table 49: Saudi Arabia Network Automation Solution Industry Revenue (Million) Forecast, by Application 2019 & 2032
- Table 50: South Africa Network Automation Solution Industry Revenue (Million) Forecast, by Application 2019 & 2032
- Table 51: Rest of Middle East and Africa Network Automation Solution Industry Revenue (Million) Forecast, by Application 2019 & 2032
- Table 52: Global Network Automation Solution Industry Revenue Million Forecast, by Network Type 2019 & 2032
- Table 53: Global Network Automation Solution Industry Revenue Million Forecast, by Component 2019 & 2032
- Table 54: Global Network Automation Solution Industry Revenue Million Forecast, by Deployment 2019 & 2032
- Table 55: Global Network Automation Solution Industry Revenue Million Forecast, by End-user Industry 2019 & 2032
- Table 56: Global Network Automation Solution Industry Revenue Million Forecast, by Country 2019 & 2032
- Table 57: Global Network Automation Solution Industry Revenue Million Forecast, by Network Type 2019 & 2032
- Table 58: Global Network Automation Solution Industry Revenue Million Forecast, by Component 2019 & 2032
- Table 59: Global Network Automation Solution Industry Revenue Million Forecast, by Deployment 2019 & 2032
- Table 60: Global Network Automation Solution Industry Revenue Million Forecast, by End-user Industry 2019 & 2032
- Table 61: Global Network Automation Solution Industry Revenue Million Forecast, by Country 2019 & 2032
- Table 62: Global Network Automation Solution Industry Revenue Million Forecast, by Network Type 2019 & 2032
- Table 63: Global Network Automation Solution Industry Revenue Million Forecast, by Component 2019 & 2032
- Table 64: Global Network Automation Solution Industry Revenue Million Forecast, by Deployment 2019 & 2032
- Table 65: Global Network Automation Solution Industry Revenue Million Forecast, by End-user Industry 2019 & 2032
- Table 66: Global Network Automation Solution Industry Revenue Million Forecast, by Country 2019 & 2032
- Table 67: Global Network Automation Solution Industry Revenue Million Forecast, by Network Type 2019 & 2032
- Table 68: Global Network Automation Solution Industry Revenue Million Forecast, by Component 2019 & 2032
- Table 69: Global Network Automation Solution Industry Revenue Million Forecast, by Deployment 2019 & 2032
- Table 70: Global Network Automation Solution Industry Revenue Million Forecast, by End-user Industry 2019 & 2032
- Table 71: Global Network Automation Solution Industry Revenue Million Forecast, by Country 2019 & 2032
- Table 72: Global Network Automation Solution Industry Revenue Million Forecast, by Network Type 2019 & 2032
- Table 73: Global Network Automation Solution Industry Revenue Million Forecast, by Component 2019 & 2032
- Table 74: Global Network Automation Solution Industry Revenue Million Forecast, by Deployment 2019 & 2032
- Table 75: Global Network Automation Solution Industry Revenue Million Forecast, by End-user Industry 2019 & 2032
- Table 76: Global Network Automation Solution Industry Revenue Million Forecast, by Country 2019 & 2032
- Table 77: Global Network Automation Solution Industry Revenue Million Forecast, by Network Type 2019 & 2032
- Table 78: Global Network Automation Solution Industry Revenue Million Forecast, by Component 2019 & 2032
- Table 79: Global Network Automation Solution Industry Revenue Million Forecast, by Deployment 2019 & 2032
- Table 80: Global Network Automation Solution Industry Revenue Million Forecast, by End-user Industry 2019 & 2032
- Table 81: Global Network Automation Solution Industry Revenue Million Forecast, by Country 2019 & 2032
Frequently Asked Questions
1. What is the projected Compound Annual Growth Rate (CAGR) of the Network Automation Solution Industry?
The projected CAGR is approximately 23.16%.
2. Which companies are prominent players in the Network Automation Solution Industry?
Key companies in the market include AppViewX Inc, IBM Corporation, Nuage Networks (Nokia Corporation), Arista Networks Inc, Hewlett Packard Enterprise Company, Cisco Systems Inc, Broadcom Inc, Fujitsu Limited, Juniper Networks Inc, BMC Software Inc, Extreme Networks Inc, NetBrain Technologies Inc, Forward Networks Inc, Solarwinds Corporation, Open Text Corporation, Fortra LLC.
3. What are the main segments of the Network Automation Solution Industry?
The market segments include Network Type, Component, Deployment, End-user Industry.
4. Can you provide details about the market size?
The market size is estimated to be USD 25.16 Million as of 2022.
5. What are some drivers contributing to market growth?
Increasing Demand for Data Center Network; Rising Trend of Connected Devices.
6. What are the notable trends driving market growth?
IT and Telecom End-user Industry is Expected to Hold Significant Market Share.
7. Are there any restraints impacting market growth?
Lack of Skilled Professional Across Industries.
8. Can you provide examples of recent developments in the market?
March 2024: Arista announced a new network observability software. This offering integrates data from network infrastructure performance with insights from compute and server systems to provide comprehensive insights into application and workload performance across data centers, campuses, and wide-area networks. Arista’s CloudVision Universal Network ObservabilityTM (CV UNOTM) system, available as a premium feature on Arista CloudVision, facilitates network automation, systems, and application visibility.
9. What pricing options are available for accessing the report?
Pricing options include single-user, multi-user, and enterprise licenses priced at USD 4750, USD 5250, and USD 8750 respectively.
10. Is the market size provided in terms of value or volume?
The market size is provided in terms of value, measured in Million.
11. Are there any specific market keywords associated with the report?
Yes, the market keyword associated with the report is "Network Automation Solution Industry," which aids in identifying and referencing the specific market segment covered.
12. How do I determine which pricing option suits my needs best?
The pricing options vary based on user requirements and access needs. Individual users may opt for single-user licenses, while businesses requiring broader access may choose multi-user or enterprise licenses for cost-effective access to the report.
13. Are there any additional resources or data provided in the Network Automation Solution Industry report?
While the report offers comprehensive insights, it's advisable to review the specific contents or supplementary materials provided to ascertain if additional resources or data are available.
14. How can I stay updated on further developments or reports in the Network Automation Solution Industry?
To stay informed about further developments, trends, and reports in the Network Automation Solution Industry, consider subscribing to industry newsletters, following relevant companies and organizations, or regularly checking reputable industry news sources and publications.
Methodology
Step 1 - Identification of Relevant Samples Size from Population Database


Step 2 - Approaches for Defining Global Market Size (Value, Volume* & Price*)

Note*: In applicable scenarios
Step 3 - Data Sources
Primary Research
- Web Analytics
- Survey Reports
- Research Institute
- Latest Research Reports
- Opinion Leaders
Secondary Research
- Annual Reports
- White Paper
- Latest Press Release
- Industry Association
- Paid Database
- Investor Presentations

Step 4 - Data Triangulation
Involves using different sources of information in order to increase the validity of a study
These sources are likely to be stakeholders in a program - participants, other researchers, program staff, other community members, and so on.
Then we put all data in single framework & apply various statistical tools to find out the dynamic on the market.
During the analysis stage, feedback from the stakeholder groups would be compared to determine areas of agreement as well as areas of divergence
