

Key Insights
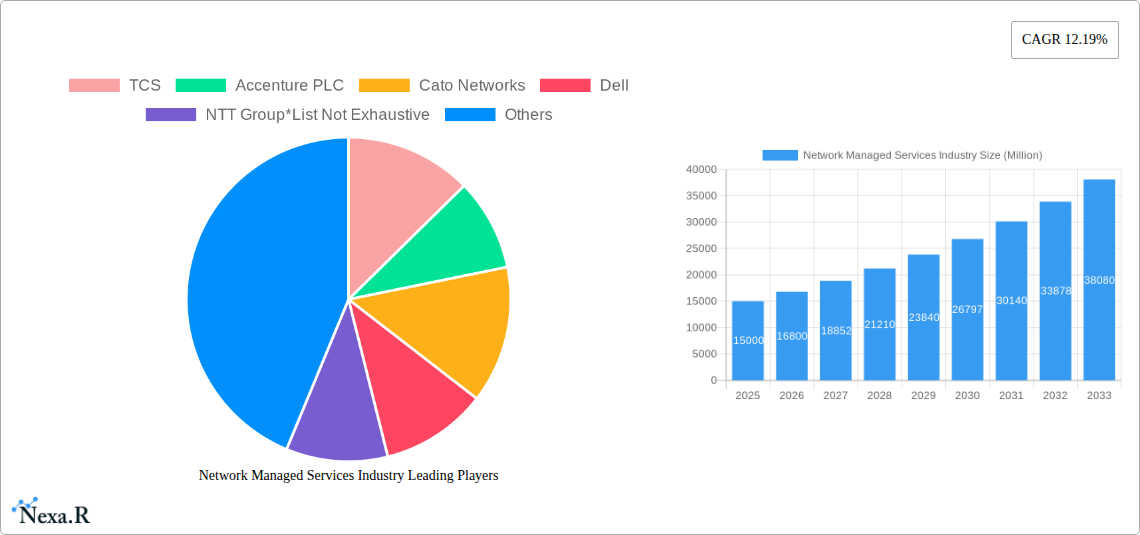
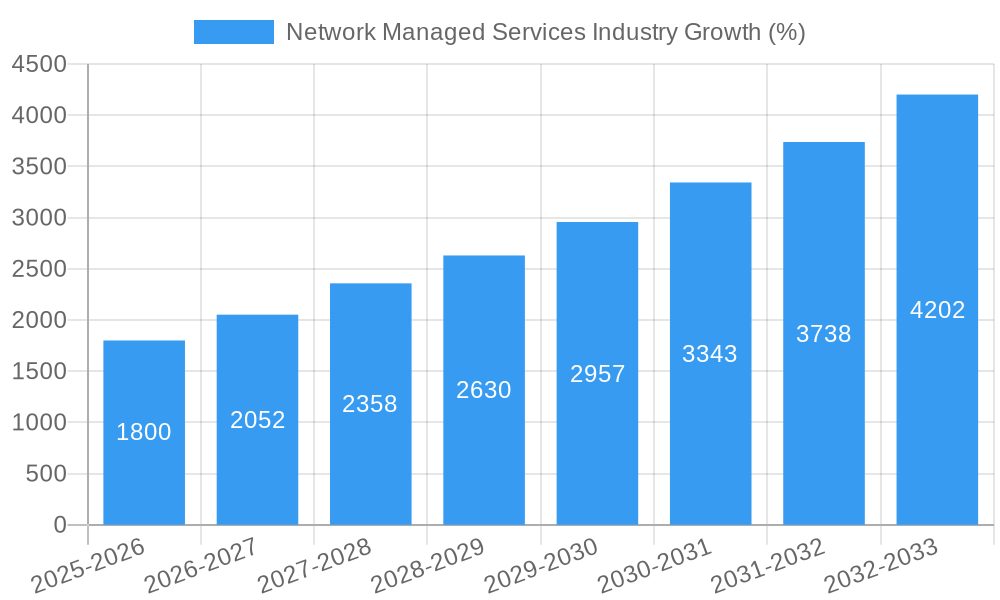
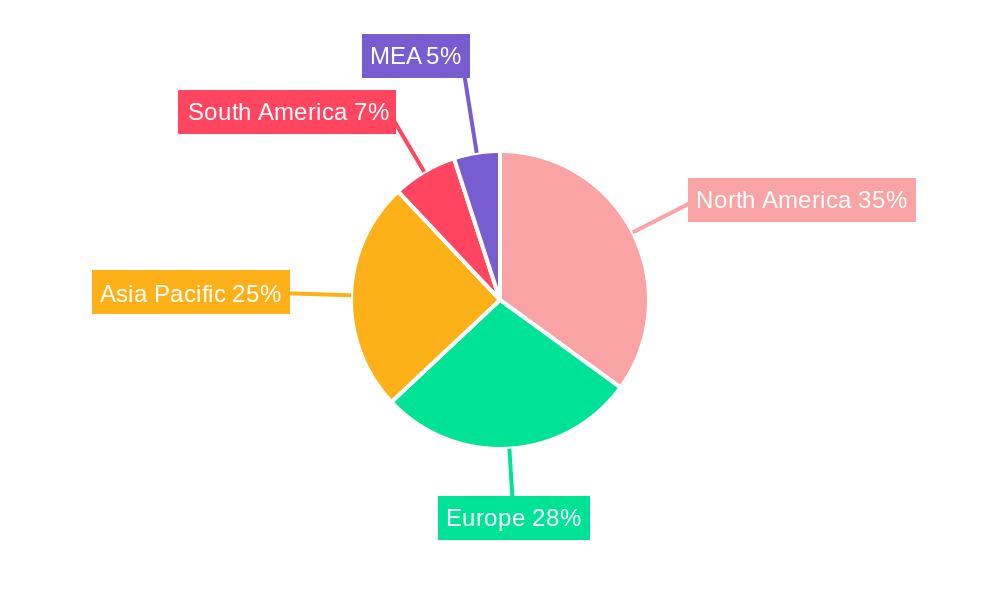
The global Network Managed Services market is experiencing robust growth, projected to reach a substantial size and maintain a Compound Annual Growth Rate (CAGR) of 12.19% from 2025 to 2033. This expansion is fueled by several key drivers. The increasing adoption of cloud computing and digital transformation initiatives across various sectors, including BFSI, IT & Telecom, and Healthcare, necessitates sophisticated network management solutions. Businesses are increasingly outsourcing network management to focus on core competencies, driving demand for managed services. Furthermore, the rising prevalence of cyber threats and the need for enhanced network security are significantly bolstering market growth. The market is segmented by organization size (SMEs and large enterprises), end-user industry (BFSI, IT & Telecom, Healthcare, Retail, Manufacturing, Education, and others), and service type (Managed LAN, WAN, Wi-Fi, Network Security, and others). Large enterprises are currently the dominant segment, owing to their higher IT budgets and complex network infrastructures. However, the SME segment is expected to exhibit faster growth due to increasing adoption of cloud-based solutions and a growing need for cost-effective network management. Geographical analysis reveals strong market presence in North America and Europe, driven by early adoption of advanced technologies and robust IT infrastructure. However, the Asia-Pacific region is poised for significant growth in the coming years, fueled by rapid digitalization and expanding IT spending in countries like India, China, and Southeast Asia.
Growth within the Network Managed Services market is not without its challenges. One key restraint is the high initial investment required for implementing managed services, potentially deterring smaller organizations. Competition among established players and new entrants is also intense. Furthermore, the market faces the continuous challenge of adapting to evolving technologies and cybersecurity threats, necessitating ongoing investment in research and development. Successfully navigating these challenges requires providers to offer comprehensive, secure, and cost-effective solutions tailored to the specific needs of diverse industries and organization sizes. Future market trends suggest a move towards AI-powered network management, automation, and increased focus on offering integrated solutions encompassing network security, performance monitoring, and other related services. The market will also see a rise in the adoption of SD-WAN (Software-Defined Wide Area Network) technologies as they offer increased agility and cost-effectiveness.
Network Managed Services Market Report: 2019-2033
This comprehensive report provides a detailed analysis of the Network Managed Services (NMS) industry, encompassing market dynamics, growth trends, regional segmentation, and competitive landscape. With a study period spanning 2019-2033, a base year of 2025, and a forecast period of 2025-2033, this report offers invaluable insights for industry professionals, investors, and strategic decision-makers. The report covers key segments including Managed LAN, Managed WAN, Managed Wi-Fi, and Managed Network Security, across various end-user industries like BFSI, IT & Telecom, and Healthcare. The market is valued at xx Million in 2025 and is projected to reach xx Million by 2033.
Network Managed Services Industry Market Dynamics & Structure
The Network Managed Services market is characterized by moderate concentration, with several large players like TCS, Accenture PLC, Cato Networks, Dell, and the NTT Group holding significant market share. However, the market also accommodates numerous smaller, specialized providers. Technological innovation, particularly in areas like SD-WAN, 5G, and AI-driven security, is a key driver of growth. Regulatory frameworks, including data privacy regulations, influence market practices and investment decisions. Competitive substitutes, such as in-house IT teams, present challenges but also drive the demand for more sophisticated and cost-effective managed services. The market also witnesses continuous M&A activities; we estimate approximately xx M&A deals occurred between 2019-2024, with a xx% increase in deal value year-on-year during this period.
- Market Concentration: Moderately concentrated, with top 5 players holding approximately xx% market share in 2024.
- Technological Innovation: SD-WAN, 5G, AI-driven security, and automation are key innovation drivers.
- Regulatory Landscape: Data privacy (GDPR, CCPA) and cybersecurity regulations shape market practices.
- Competitive Substitutes: In-house IT teams and DIY solutions pose competitive pressure.
- M&A Activity: Significant M&A activity observed, with a focus on expanding service offerings and geographical reach.
Network Managed Services Industry Growth Trends & Insights
The Network Managed Services market has experienced robust growth over the historical period (2019-2024), with a CAGR of xx%. This growth is fueled by increasing adoption of cloud computing, the rise of remote work, and the growing need for robust cybersecurity solutions. The market is expected to continue its expansion during the forecast period (2025-2033), driven by factors such as digital transformation initiatives across various industries, the increasing complexity of network infrastructure, and the growing demand for scalable and cost-effective IT solutions. Technological disruptions, such as the widespread adoption of 5G and the emergence of edge computing, will continue to reshape the market landscape. Consumer behavior shifts, including the preference for managed services over in-house IT teams, are further contributing to market growth. Market penetration currently stands at xx% and is anticipated to reach xx% by 2033.
Dominant Regions, Countries, or Segments in Network Managed Services Industry
North America currently holds the largest market share, driven by high adoption rates among large enterprises and significant investments in IT infrastructure. However, the Asia-Pacific region is expected to witness the fastest growth due to rising digitalization initiatives and a growing number of SMEs. Within segments, large enterprises dominate the market due to their higher spending capacity and complex network requirements. The BFSI and IT & Telecom sectors are the leading end-users, owing to their critical reliance on robust and secure network infrastructure. Managed WAN and Managed Network Security are the fastest-growing service types, driven by the need for secure and reliable connectivity across geographically dispersed locations.
- Key Drivers (North America): High IT spending, mature IT infrastructure, strong presence of major service providers.
- Key Drivers (Asia-Pacific): Rapid digitalization, increasing adoption of cloud technologies, government initiatives.
- Dominant Segment (By Organization Size): Large Enterprises (xx% market share in 2025).
- Dominant Segment (By End User): BFSI and IT & Telecom (combined xx% market share in 2025).
- Dominant Segment (By Type): Managed WAN and Managed Network Security (combined xx% market share in 2025).
Network Managed Services Industry Product Landscape
The NMS product landscape is characterized by a wide range of offerings, including managed LAN, WAN, Wi-Fi, and security services. These services are increasingly integrated and delivered as a comprehensive suite, leveraging technologies like SD-WAN, AI-driven security, and automation to improve performance, reduce costs, and enhance security. Key features include robust service level agreements (SLAs), proactive monitoring, and 24/7 support. Unique selling propositions include tailored solutions for specific industries and customized service levels based on customer requirements.
Key Drivers, Barriers & Challenges in Network Managed Services Industry
Key Drivers: The increasing complexity of IT infrastructure, the growing need for robust cybersecurity, and the rise of remote work are key drivers pushing market growth. Government initiatives promoting digital transformation and the adoption of advanced technologies further fuel demand.
Key Challenges: Competition from both large established players and smaller niche providers is intense. Supply chain disruptions can impact the availability of critical components, while regulatory hurdles, such as data privacy regulations, can increase operational costs.
Emerging Opportunities in Network Managed Services Industry
Emerging opportunities lie in the expansion of managed services to new industries, such as the expanding adoption of 5G, and innovative applications of AI and machine learning in network management. Untapped markets in developing economies also present significant growth potential. The increasing demand for secure access service edge (SASE) solutions presents significant opportunities.
Growth Accelerators in the Network Managed Services Industry
Strategic partnerships between technology providers and managed service providers are crucial for driving long-term growth. Technological breakthroughs, such as AI-driven automation and the adoption of 5G, further enhance service offerings and drive adoption. Market expansion strategies, including geographical expansion and diversification of service offerings, are also key growth accelerators.
Key Players Shaping the Network Managed Services Industry Market
- TCS
- Accenture PLC
- Cato Networks
- Dell
- NTT Group
- Wipro
- Verizon
- HCL Technologies Limited
- IBM
- Lumen Technologies
Notable Milestones in Network Managed Services Industry Sector
- June 2023: Wipro launched a managed private 5G-as-a-service solution in partnership with Cisco.
- May 2023: Cloudflare Inc. partnered with Kyndryl Holdings Inc. to offer managed WAN-as-a-Service and Cloudflare Zero Trust.
In-Depth Network Managed Services Industry Market Outlook
The Network Managed Services market is poised for continued growth, driven by technological advancements, increasing digitalization, and the growing need for secure and reliable network infrastructure. Strategic partnerships, service innovation, and geographical expansion will play a crucial role in shaping the future of the market. The market presents attractive opportunities for both established players and emerging companies to capitalize on the growing demand for managed services.
Network Managed Services Industry Segmentation
-
1. Type
- 1.1. Managed LAN
- 1.2. Managed WAN
- 1.3. Managed Wi-Fi
- 1.4. Managed Network Security
- 1.5. Other Services
-
2. Organization Size
- 2.1. Small and Medium Enterprises (SMEs)
- 2.2. Large Enterprises
-
3. End User
- 3.1. BFSI
- 3.2. IT and Telecom
- 3.3. Healthcare and Pharmaceutical
- 3.4. Retail
- 3.5. Manufacturing
- 3.6. Education
- 3.7. Others (Utilities, Media, Etc.)
Network Managed Services Industry Segmentation By Geography
- 1. North America
- 2. Europe
- 3. Asia Pacific
- 4. Middle East and Africa
- 5. Latin America
Network Managed Services Industry REPORT HIGHLIGHTS
| Aspects | Details |
|---|---|
| Study Period | 2019-2033 |
| Base Year | 2024 |
| Estimated Year | 2025 |
| Forecast Period | 2025-2033 |
| Historical Period | 2019-2024 |
| Growth Rate | CAGR of 12.19% from 2019-2033 |
| Segmentation |
|
Table of Contents
- 1. Introduction
- 1.1. Research Scope
- 1.2. Market Segmentation
- 1.3. Research Methodology
- 1.4. Definitions and Assumptions
- 2. Executive Summary
- 2.1. Introduction
- 3. Market Dynamics
- 3.1. Introduction
- 3.2. Market Drivers
- 3.2.1. Lack of in-house Expertise; Benefit of Extensive Focus on Core Operations; Cost Benefits and ROI Achieved through Managed Services
- 3.3. Market Restrains
- 3.3.1. Reluctance Among Medical Professionals to Adopt Advanced Healthcare Tools
- 3.4. Market Trends
- 3.4.1. IT and Telecom Sector to be the Largest End User
- 4. Market Factor Analysis
- 4.1. Porters Five Forces
- 4.2. Supply/Value Chain
- 4.3. PESTEL analysis
- 4.4. Market Entropy
- 4.5. Patent/Trademark Analysis
- 5. Global Network Managed Services Industry Analysis, Insights and Forecast, 2019-2031
- 5.1. Market Analysis, Insights and Forecast - by Type
- 5.1.1. Managed LAN
- 5.1.2. Managed WAN
- 5.1.3. Managed Wi-Fi
- 5.1.4. Managed Network Security
- 5.1.5. Other Services
- 5.2. Market Analysis, Insights and Forecast - by Organization Size
- 5.2.1. Small and Medium Enterprises (SMEs)
- 5.2.2. Large Enterprises
- 5.3. Market Analysis, Insights and Forecast - by End User
- 5.3.1. BFSI
- 5.3.2. IT and Telecom
- 5.3.3. Healthcare and Pharmaceutical
- 5.3.4. Retail
- 5.3.5. Manufacturing
- 5.3.6. Education
- 5.3.7. Others (Utilities, Media, Etc.)
- 5.4. Market Analysis, Insights and Forecast - by Region
- 5.4.1. North America
- 5.4.2. Europe
- 5.4.3. Asia Pacific
- 5.4.4. Middle East and Africa
- 5.4.5. Latin America
- 5.1. Market Analysis, Insights and Forecast - by Type
- 6. North America Network Managed Services Industry Analysis, Insights and Forecast, 2019-2031
- 6.1. Market Analysis, Insights and Forecast - by Type
- 6.1.1. Managed LAN
- 6.1.2. Managed WAN
- 6.1.3. Managed Wi-Fi
- 6.1.4. Managed Network Security
- 6.1.5. Other Services
- 6.2. Market Analysis, Insights and Forecast - by Organization Size
- 6.2.1. Small and Medium Enterprises (SMEs)
- 6.2.2. Large Enterprises
- 6.3. Market Analysis, Insights and Forecast - by End User
- 6.3.1. BFSI
- 6.3.2. IT and Telecom
- 6.3.3. Healthcare and Pharmaceutical
- 6.3.4. Retail
- 6.3.5. Manufacturing
- 6.3.6. Education
- 6.3.7. Others (Utilities, Media, Etc.)
- 6.1. Market Analysis, Insights and Forecast - by Type
- 7. Europe Network Managed Services Industry Analysis, Insights and Forecast, 2019-2031
- 7.1. Market Analysis, Insights and Forecast - by Type
- 7.1.1. Managed LAN
- 7.1.2. Managed WAN
- 7.1.3. Managed Wi-Fi
- 7.1.4. Managed Network Security
- 7.1.5. Other Services
- 7.2. Market Analysis, Insights and Forecast - by Organization Size
- 7.2.1. Small and Medium Enterprises (SMEs)
- 7.2.2. Large Enterprises
- 7.3. Market Analysis, Insights and Forecast - by End User
- 7.3.1. BFSI
- 7.3.2. IT and Telecom
- 7.3.3. Healthcare and Pharmaceutical
- 7.3.4. Retail
- 7.3.5. Manufacturing
- 7.3.6. Education
- 7.3.7. Others (Utilities, Media, Etc.)
- 7.1. Market Analysis, Insights and Forecast - by Type
- 8. Asia Pacific Network Managed Services Industry Analysis, Insights and Forecast, 2019-2031
- 8.1. Market Analysis, Insights and Forecast - by Type
- 8.1.1. Managed LAN
- 8.1.2. Managed WAN
- 8.1.3. Managed Wi-Fi
- 8.1.4. Managed Network Security
- 8.1.5. Other Services
- 8.2. Market Analysis, Insights and Forecast - by Organization Size
- 8.2.1. Small and Medium Enterprises (SMEs)
- 8.2.2. Large Enterprises
- 8.3. Market Analysis, Insights and Forecast - by End User
- 8.3.1. BFSI
- 8.3.2. IT and Telecom
- 8.3.3. Healthcare and Pharmaceutical
- 8.3.4. Retail
- 8.3.5. Manufacturing
- 8.3.6. Education
- 8.3.7. Others (Utilities, Media, Etc.)
- 8.1. Market Analysis, Insights and Forecast - by Type
- 9. Middle East and Africa Network Managed Services Industry Analysis, Insights and Forecast, 2019-2031
- 9.1. Market Analysis, Insights and Forecast - by Type
- 9.1.1. Managed LAN
- 9.1.2. Managed WAN
- 9.1.3. Managed Wi-Fi
- 9.1.4. Managed Network Security
- 9.1.5. Other Services
- 9.2. Market Analysis, Insights and Forecast - by Organization Size
- 9.2.1. Small and Medium Enterprises (SMEs)
- 9.2.2. Large Enterprises
- 9.3. Market Analysis, Insights and Forecast - by End User
- 9.3.1. BFSI
- 9.3.2. IT and Telecom
- 9.3.3. Healthcare and Pharmaceutical
- 9.3.4. Retail
- 9.3.5. Manufacturing
- 9.3.6. Education
- 9.3.7. Others (Utilities, Media, Etc.)
- 9.1. Market Analysis, Insights and Forecast - by Type
- 10. Latin America Network Managed Services Industry Analysis, Insights and Forecast, 2019-2031
- 10.1. Market Analysis, Insights and Forecast - by Type
- 10.1.1. Managed LAN
- 10.1.2. Managed WAN
- 10.1.3. Managed Wi-Fi
- 10.1.4. Managed Network Security
- 10.1.5. Other Services
- 10.2. Market Analysis, Insights and Forecast - by Organization Size
- 10.2.1. Small and Medium Enterprises (SMEs)
- 10.2.2. Large Enterprises
- 10.3. Market Analysis, Insights and Forecast - by End User
- 10.3.1. BFSI
- 10.3.2. IT and Telecom
- 10.3.3. Healthcare and Pharmaceutical
- 10.3.4. Retail
- 10.3.5. Manufacturing
- 10.3.6. Education
- 10.3.7. Others (Utilities, Media, Etc.)
- 10.1. Market Analysis, Insights and Forecast - by Type
- 11. North America Network Managed Services Industry Analysis, Insights and Forecast, 2019-2031
- 11.1. Market Analysis, Insights and Forecast - By Country/Sub-region
- 11.1.1 United States
- 11.1.2 Canada
- 11.1.3 Mexico
- 12. Europe Network Managed Services Industry Analysis, Insights and Forecast, 2019-2031
- 12.1. Market Analysis, Insights and Forecast - By Country/Sub-region
- 12.1.1 Germany
- 12.1.2 United Kingdom
- 12.1.3 France
- 12.1.4 Spain
- 12.1.5 Italy
- 12.1.6 Spain
- 12.1.7 Belgium
- 12.1.8 Netherland
- 12.1.9 Nordics
- 12.1.10 Rest of Europe
- 13. Asia Pacific Network Managed Services Industry Analysis, Insights and Forecast, 2019-2031
- 13.1. Market Analysis, Insights and Forecast - By Country/Sub-region
- 13.1.1 China
- 13.1.2 Japan
- 13.1.3 India
- 13.1.4 South Korea
- 13.1.5 Southeast Asia
- 13.1.6 Australia
- 13.1.7 Indonesia
- 13.1.8 Phillipes
- 13.1.9 Singapore
- 13.1.10 Thailandc
- 13.1.11 Rest of Asia Pacific
- 14. South America Network Managed Services Industry Analysis, Insights and Forecast, 2019-2031
- 14.1. Market Analysis, Insights and Forecast - By Country/Sub-region
- 14.1.1 Brazil
- 14.1.2 Argentina
- 14.1.3 Peru
- 14.1.4 Chile
- 14.1.5 Colombia
- 14.1.6 Ecuador
- 14.1.7 Venezuela
- 14.1.8 Rest of South America
- 15. North America Network Managed Services Industry Analysis, Insights and Forecast, 2019-2031
- 15.1. Market Analysis, Insights and Forecast - By Country/Sub-region
- 15.1.1 United States
- 15.1.2 Canada
- 15.1.3 Mexico
- 16. MEA Network Managed Services Industry Analysis, Insights and Forecast, 2019-2031
- 16.1. Market Analysis, Insights and Forecast - By Country/Sub-region
- 16.1.1 United Arab Emirates
- 16.1.2 Saudi Arabia
- 16.1.3 South Africa
- 16.1.4 Rest of Middle East and Africa
- 17. Competitive Analysis
- 17.1. Global Market Share Analysis 2024
- 17.2. Company Profiles
- 17.2.1 TCS
- 17.2.1.1. Overview
- 17.2.1.2. Products
- 17.2.1.3. SWOT Analysis
- 17.2.1.4. Recent Developments
- 17.2.1.5. Financials (Based on Availability)
- 17.2.2 Accenture PLC
- 17.2.2.1. Overview
- 17.2.2.2. Products
- 17.2.2.3. SWOT Analysis
- 17.2.2.4. Recent Developments
- 17.2.2.5. Financials (Based on Availability)
- 17.2.3 Cato Networks
- 17.2.3.1. Overview
- 17.2.3.2. Products
- 17.2.3.3. SWOT Analysis
- 17.2.3.4. Recent Developments
- 17.2.3.5. Financials (Based on Availability)
- 17.2.4 Dell
- 17.2.4.1. Overview
- 17.2.4.2. Products
- 17.2.4.3. SWOT Analysis
- 17.2.4.4. Recent Developments
- 17.2.4.5. Financials (Based on Availability)
- 17.2.5 NTT Group*List Not Exhaustive
- 17.2.5.1. Overview
- 17.2.5.2. Products
- 17.2.5.3. SWOT Analysis
- 17.2.5.4. Recent Developments
- 17.2.5.5. Financials (Based on Availability)
- 17.2.6 Wipro
- 17.2.6.1. Overview
- 17.2.6.2. Products
- 17.2.6.3. SWOT Analysis
- 17.2.6.4. Recent Developments
- 17.2.6.5. Financials (Based on Availability)
- 17.2.7 Verizon
- 17.2.7.1. Overview
- 17.2.7.2. Products
- 17.2.7.3. SWOT Analysis
- 17.2.7.4. Recent Developments
- 17.2.7.5. Financials (Based on Availability)
- 17.2.8 HCL Technologies Limited
- 17.2.8.1. Overview
- 17.2.8.2. Products
- 17.2.8.3. SWOT Analysis
- 17.2.8.4. Recent Developments
- 17.2.8.5. Financials (Based on Availability)
- 17.2.9 IBM
- 17.2.9.1. Overview
- 17.2.9.2. Products
- 17.2.9.3. SWOT Analysis
- 17.2.9.4. Recent Developments
- 17.2.9.5. Financials (Based on Availability)
- 17.2.10 Lumen Technologies
- 17.2.10.1. Overview
- 17.2.10.2. Products
- 17.2.10.3. SWOT Analysis
- 17.2.10.4. Recent Developments
- 17.2.10.5. Financials (Based on Availability)
- 17.2.1 TCS
List of Figures
- Figure 1: Global Network Managed Services Industry Revenue Breakdown (Million, %) by Region 2024 & 2032
- Figure 2: North America Network Managed Services Industry Revenue (Million), by Country 2024 & 2032
- Figure 3: North America Network Managed Services Industry Revenue Share (%), by Country 2024 & 2032
- Figure 4: Europe Network Managed Services Industry Revenue (Million), by Country 2024 & 2032
- Figure 5: Europe Network Managed Services Industry Revenue Share (%), by Country 2024 & 2032
- Figure 6: Asia Pacific Network Managed Services Industry Revenue (Million), by Country 2024 & 2032
- Figure 7: Asia Pacific Network Managed Services Industry Revenue Share (%), by Country 2024 & 2032
- Figure 8: South America Network Managed Services Industry Revenue (Million), by Country 2024 & 2032
- Figure 9: South America Network Managed Services Industry Revenue Share (%), by Country 2024 & 2032
- Figure 10: North America Network Managed Services Industry Revenue (Million), by Country 2024 & 2032
- Figure 11: North America Network Managed Services Industry Revenue Share (%), by Country 2024 & 2032
- Figure 12: MEA Network Managed Services Industry Revenue (Million), by Country 2024 & 2032
- Figure 13: MEA Network Managed Services Industry Revenue Share (%), by Country 2024 & 2032
- Figure 14: North America Network Managed Services Industry Revenue (Million), by Type 2024 & 2032
- Figure 15: North America Network Managed Services Industry Revenue Share (%), by Type 2024 & 2032
- Figure 16: North America Network Managed Services Industry Revenue (Million), by Organization Size 2024 & 2032
- Figure 17: North America Network Managed Services Industry Revenue Share (%), by Organization Size 2024 & 2032
- Figure 18: North America Network Managed Services Industry Revenue (Million), by End User 2024 & 2032
- Figure 19: North America Network Managed Services Industry Revenue Share (%), by End User 2024 & 2032
- Figure 20: North America Network Managed Services Industry Revenue (Million), by Country 2024 & 2032
- Figure 21: North America Network Managed Services Industry Revenue Share (%), by Country 2024 & 2032
- Figure 22: Europe Network Managed Services Industry Revenue (Million), by Type 2024 & 2032
- Figure 23: Europe Network Managed Services Industry Revenue Share (%), by Type 2024 & 2032
- Figure 24: Europe Network Managed Services Industry Revenue (Million), by Organization Size 2024 & 2032
- Figure 25: Europe Network Managed Services Industry Revenue Share (%), by Organization Size 2024 & 2032
- Figure 26: Europe Network Managed Services Industry Revenue (Million), by End User 2024 & 2032
- Figure 27: Europe Network Managed Services Industry Revenue Share (%), by End User 2024 & 2032
- Figure 28: Europe Network Managed Services Industry Revenue (Million), by Country 2024 & 2032
- Figure 29: Europe Network Managed Services Industry Revenue Share (%), by Country 2024 & 2032
- Figure 30: Asia Pacific Network Managed Services Industry Revenue (Million), by Type 2024 & 2032
- Figure 31: Asia Pacific Network Managed Services Industry Revenue Share (%), by Type 2024 & 2032
- Figure 32: Asia Pacific Network Managed Services Industry Revenue (Million), by Organization Size 2024 & 2032
- Figure 33: Asia Pacific Network Managed Services Industry Revenue Share (%), by Organization Size 2024 & 2032
- Figure 34: Asia Pacific Network Managed Services Industry Revenue (Million), by End User 2024 & 2032
- Figure 35: Asia Pacific Network Managed Services Industry Revenue Share (%), by End User 2024 & 2032
- Figure 36: Asia Pacific Network Managed Services Industry Revenue (Million), by Country 2024 & 2032
- Figure 37: Asia Pacific Network Managed Services Industry Revenue Share (%), by Country 2024 & 2032
- Figure 38: Middle East and Africa Network Managed Services Industry Revenue (Million), by Type 2024 & 2032
- Figure 39: Middle East and Africa Network Managed Services Industry Revenue Share (%), by Type 2024 & 2032
- Figure 40: Middle East and Africa Network Managed Services Industry Revenue (Million), by Organization Size 2024 & 2032
- Figure 41: Middle East and Africa Network Managed Services Industry Revenue Share (%), by Organization Size 2024 & 2032
- Figure 42: Middle East and Africa Network Managed Services Industry Revenue (Million), by End User 2024 & 2032
- Figure 43: Middle East and Africa Network Managed Services Industry Revenue Share (%), by End User 2024 & 2032
- Figure 44: Middle East and Africa Network Managed Services Industry Revenue (Million), by Country 2024 & 2032
- Figure 45: Middle East and Africa Network Managed Services Industry Revenue Share (%), by Country 2024 & 2032
- Figure 46: Latin America Network Managed Services Industry Revenue (Million), by Type 2024 & 2032
- Figure 47: Latin America Network Managed Services Industry Revenue Share (%), by Type 2024 & 2032
- Figure 48: Latin America Network Managed Services Industry Revenue (Million), by Organization Size 2024 & 2032
- Figure 49: Latin America Network Managed Services Industry Revenue Share (%), by Organization Size 2024 & 2032
- Figure 50: Latin America Network Managed Services Industry Revenue (Million), by End User 2024 & 2032
- Figure 51: Latin America Network Managed Services Industry Revenue Share (%), by End User 2024 & 2032
- Figure 52: Latin America Network Managed Services Industry Revenue (Million), by Country 2024 & 2032
- Figure 53: Latin America Network Managed Services Industry Revenue Share (%), by Country 2024 & 2032
List of Tables
- Table 1: Global Network Managed Services Industry Revenue Million Forecast, by Region 2019 & 2032
- Table 2: Global Network Managed Services Industry Revenue Million Forecast, by Type 2019 & 2032
- Table 3: Global Network Managed Services Industry Revenue Million Forecast, by Organization Size 2019 & 2032
- Table 4: Global Network Managed Services Industry Revenue Million Forecast, by End User 2019 & 2032
- Table 5: Global Network Managed Services Industry Revenue Million Forecast, by Region 2019 & 2032
- Table 6: Global Network Managed Services Industry Revenue Million Forecast, by Country 2019 & 2032
- Table 7: United States Network Managed Services Industry Revenue (Million) Forecast, by Application 2019 & 2032
- Table 8: Canada Network Managed Services Industry Revenue (Million) Forecast, by Application 2019 & 2032
- Table 9: Mexico Network Managed Services Industry Revenue (Million) Forecast, by Application 2019 & 2032
- Table 10: Global Network Managed Services Industry Revenue Million Forecast, by Country 2019 & 2032
- Table 11: Germany Network Managed Services Industry Revenue (Million) Forecast, by Application 2019 & 2032
- Table 12: United Kingdom Network Managed Services Industry Revenue (Million) Forecast, by Application 2019 & 2032
- Table 13: France Network Managed Services Industry Revenue (Million) Forecast, by Application 2019 & 2032
- Table 14: Spain Network Managed Services Industry Revenue (Million) Forecast, by Application 2019 & 2032
- Table 15: Italy Network Managed Services Industry Revenue (Million) Forecast, by Application 2019 & 2032
- Table 16: Spain Network Managed Services Industry Revenue (Million) Forecast, by Application 2019 & 2032
- Table 17: Belgium Network Managed Services Industry Revenue (Million) Forecast, by Application 2019 & 2032
- Table 18: Netherland Network Managed Services Industry Revenue (Million) Forecast, by Application 2019 & 2032
- Table 19: Nordics Network Managed Services Industry Revenue (Million) Forecast, by Application 2019 & 2032
- Table 20: Rest of Europe Network Managed Services Industry Revenue (Million) Forecast, by Application 2019 & 2032
- Table 21: Global Network Managed Services Industry Revenue Million Forecast, by Country 2019 & 2032
- Table 22: China Network Managed Services Industry Revenue (Million) Forecast, by Application 2019 & 2032
- Table 23: Japan Network Managed Services Industry Revenue (Million) Forecast, by Application 2019 & 2032
- Table 24: India Network Managed Services Industry Revenue (Million) Forecast, by Application 2019 & 2032
- Table 25: South Korea Network Managed Services Industry Revenue (Million) Forecast, by Application 2019 & 2032
- Table 26: Southeast Asia Network Managed Services Industry Revenue (Million) Forecast, by Application 2019 & 2032
- Table 27: Australia Network Managed Services Industry Revenue (Million) Forecast, by Application 2019 & 2032
- Table 28: Indonesia Network Managed Services Industry Revenue (Million) Forecast, by Application 2019 & 2032
- Table 29: Phillipes Network Managed Services Industry Revenue (Million) Forecast, by Application 2019 & 2032
- Table 30: Singapore Network Managed Services Industry Revenue (Million) Forecast, by Application 2019 & 2032
- Table 31: Thailandc Network Managed Services Industry Revenue (Million) Forecast, by Application 2019 & 2032
- Table 32: Rest of Asia Pacific Network Managed Services Industry Revenue (Million) Forecast, by Application 2019 & 2032
- Table 33: Global Network Managed Services Industry Revenue Million Forecast, by Country 2019 & 2032
- Table 34: Brazil Network Managed Services Industry Revenue (Million) Forecast, by Application 2019 & 2032
- Table 35: Argentina Network Managed Services Industry Revenue (Million) Forecast, by Application 2019 & 2032
- Table 36: Peru Network Managed Services Industry Revenue (Million) Forecast, by Application 2019 & 2032
- Table 37: Chile Network Managed Services Industry Revenue (Million) Forecast, by Application 2019 & 2032
- Table 38: Colombia Network Managed Services Industry Revenue (Million) Forecast, by Application 2019 & 2032
- Table 39: Ecuador Network Managed Services Industry Revenue (Million) Forecast, by Application 2019 & 2032
- Table 40: Venezuela Network Managed Services Industry Revenue (Million) Forecast, by Application 2019 & 2032
- Table 41: Rest of South America Network Managed Services Industry Revenue (Million) Forecast, by Application 2019 & 2032
- Table 42: Global Network Managed Services Industry Revenue Million Forecast, by Country 2019 & 2032
- Table 43: United States Network Managed Services Industry Revenue (Million) Forecast, by Application 2019 & 2032
- Table 44: Canada Network Managed Services Industry Revenue (Million) Forecast, by Application 2019 & 2032
- Table 45: Mexico Network Managed Services Industry Revenue (Million) Forecast, by Application 2019 & 2032
- Table 46: Global Network Managed Services Industry Revenue Million Forecast, by Country 2019 & 2032
- Table 47: United Arab Emirates Network Managed Services Industry Revenue (Million) Forecast, by Application 2019 & 2032
- Table 48: Saudi Arabia Network Managed Services Industry Revenue (Million) Forecast, by Application 2019 & 2032
- Table 49: South Africa Network Managed Services Industry Revenue (Million) Forecast, by Application 2019 & 2032
- Table 50: Rest of Middle East and Africa Network Managed Services Industry Revenue (Million) Forecast, by Application 2019 & 2032
- Table 51: Global Network Managed Services Industry Revenue Million Forecast, by Type 2019 & 2032
- Table 52: Global Network Managed Services Industry Revenue Million Forecast, by Organization Size 2019 & 2032
- Table 53: Global Network Managed Services Industry Revenue Million Forecast, by End User 2019 & 2032
- Table 54: Global Network Managed Services Industry Revenue Million Forecast, by Country 2019 & 2032
- Table 55: Global Network Managed Services Industry Revenue Million Forecast, by Type 2019 & 2032
- Table 56: Global Network Managed Services Industry Revenue Million Forecast, by Organization Size 2019 & 2032
- Table 57: Global Network Managed Services Industry Revenue Million Forecast, by End User 2019 & 2032
- Table 58: Global Network Managed Services Industry Revenue Million Forecast, by Country 2019 & 2032
- Table 59: Global Network Managed Services Industry Revenue Million Forecast, by Type 2019 & 2032
- Table 60: Global Network Managed Services Industry Revenue Million Forecast, by Organization Size 2019 & 2032
- Table 61: Global Network Managed Services Industry Revenue Million Forecast, by End User 2019 & 2032
- Table 62: Global Network Managed Services Industry Revenue Million Forecast, by Country 2019 & 2032
- Table 63: Global Network Managed Services Industry Revenue Million Forecast, by Type 2019 & 2032
- Table 64: Global Network Managed Services Industry Revenue Million Forecast, by Organization Size 2019 & 2032
- Table 65: Global Network Managed Services Industry Revenue Million Forecast, by End User 2019 & 2032
- Table 66: Global Network Managed Services Industry Revenue Million Forecast, by Country 2019 & 2032
- Table 67: Global Network Managed Services Industry Revenue Million Forecast, by Type 2019 & 2032
- Table 68: Global Network Managed Services Industry Revenue Million Forecast, by Organization Size 2019 & 2032
- Table 69: Global Network Managed Services Industry Revenue Million Forecast, by End User 2019 & 2032
- Table 70: Global Network Managed Services Industry Revenue Million Forecast, by Country 2019 & 2032
Frequently Asked Questions
1. What is the projected Compound Annual Growth Rate (CAGR) of the Network Managed Services Industry?
The projected CAGR is approximately 12.19%.
2. Which companies are prominent players in the Network Managed Services Industry?
Key companies in the market include TCS, Accenture PLC, Cato Networks, Dell, NTT Group*List Not Exhaustive, Wipro, Verizon, HCL Technologies Limited, IBM, Lumen Technologies.
3. What are the main segments of the Network Managed Services Industry?
The market segments include Type, Organization Size, End User.
4. Can you provide details about the market size?
The market size is estimated to be USD XX Million as of 2022.
5. What are some drivers contributing to market growth?
Lack of in-house Expertise; Benefit of Extensive Focus on Core Operations; Cost Benefits and ROI Achieved through Managed Services.
6. What are the notable trends driving market growth?
IT and Telecom Sector to be the Largest End User.
7. Are there any restraints impacting market growth?
Reluctance Among Medical Professionals to Adopt Advanced Healthcare Tools.
8. Can you provide examples of recent developments in the market?
June 2023: Wipro launched a managed private 5G-as-a-service solution in partnership with Cisco. Wipro said that the new offering enables enterprise customers to achieve better business outcomes via the integration of private 5G with their existing LAN/WAN/Cloud infrastructure.
9. What pricing options are available for accessing the report?
Pricing options include single-user, multi-user, and enterprise licenses priced at USD 4750, USD 5250, and USD 8750 respectively.
10. Is the market size provided in terms of value or volume?
The market size is provided in terms of value, measured in Million.
11. Are there any specific market keywords associated with the report?
Yes, the market keyword associated with the report is "Network Managed Services Industry," which aids in identifying and referencing the specific market segment covered.
12. How do I determine which pricing option suits my needs best?
The pricing options vary based on user requirements and access needs. Individual users may opt for single-user licenses, while businesses requiring broader access may choose multi-user or enterprise licenses for cost-effective access to the report.
13. Are there any additional resources or data provided in the Network Managed Services Industry report?
While the report offers comprehensive insights, it's advisable to review the specific contents or supplementary materials provided to ascertain if additional resources or data are available.
14. How can I stay updated on further developments or reports in the Network Managed Services Industry?
To stay informed about further developments, trends, and reports in the Network Managed Services Industry, consider subscribing to industry newsletters, following relevant companies and organizations, or regularly checking reputable industry news sources and publications.
Methodology
Step 1 - Identification of Relevant Samples Size from Population Database


Step 2 - Approaches for Defining Global Market Size (Value, Volume* & Price*)

Note*: In applicable scenarios
Step 3 - Data Sources
Primary Research
- Web Analytics
- Survey Reports
- Research Institute
- Latest Research Reports
- Opinion Leaders
Secondary Research
- Annual Reports
- White Paper
- Latest Press Release
- Industry Association
- Paid Database
- Investor Presentations

Step 4 - Data Triangulation
Involves using different sources of information in order to increase the validity of a study
These sources are likely to be stakeholders in a program - participants, other researchers, program staff, other community members, and so on.
Then we put all data in single framework & apply various statistical tools to find out the dynamic on the market.
During the analysis stage, feedback from the stakeholder groups would be compared to determine areas of agreement as well as areas of divergence
