

Key Insights
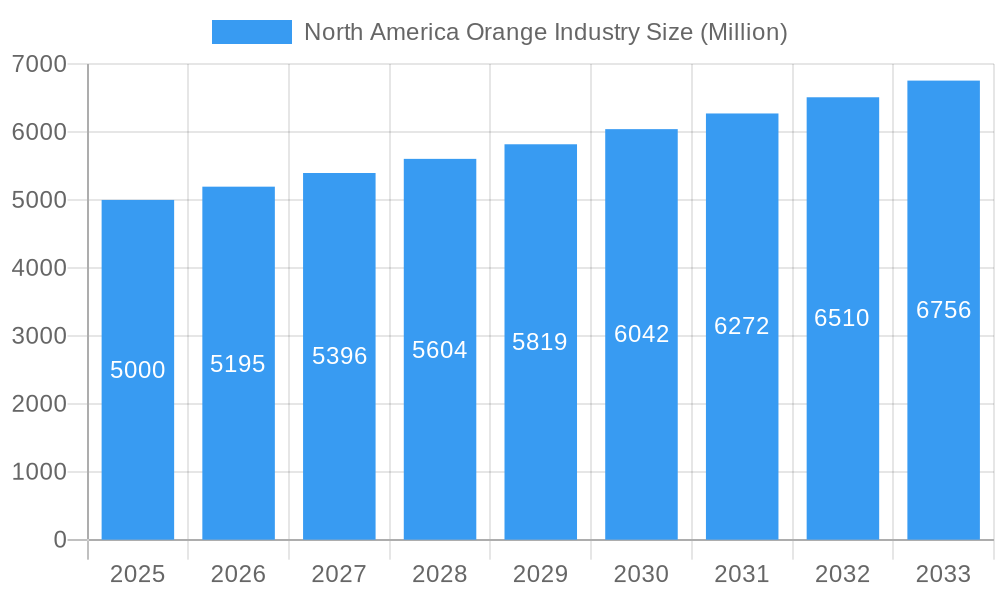
The North American orange industry, encompassing fresh and processed segments, presents a dynamic market landscape projected to experience steady growth. The market, valued at approximately $5 billion in 2025, is driven by increasing consumer demand for healthy and convenient food and beverage options, fueled by rising health consciousness and the versatility of oranges in various culinary applications. The food and beverage industry, particularly juice manufacturers and beverage companies, remains the largest end-user segment, while the retail sector, encompassing both traditional grocery stores and rapidly growing online platforms, shows significant potential for expansion. Premium orange varieties are gaining traction, reflecting a willingness among consumers to pay more for higher quality and taste. However, the market faces challenges such as fluctuating weather patterns impacting crop yields and increasing production costs, potentially leading to price fluctuations. Competition among established players like Sunkist Growers and Tropicana, alongside emerging brands, necessitates innovative product development and efficient supply chain management. Furthermore, sustainability concerns and consumer preference for ethically sourced products are influencing industry practices, driving adoption of environmentally friendly farming techniques.
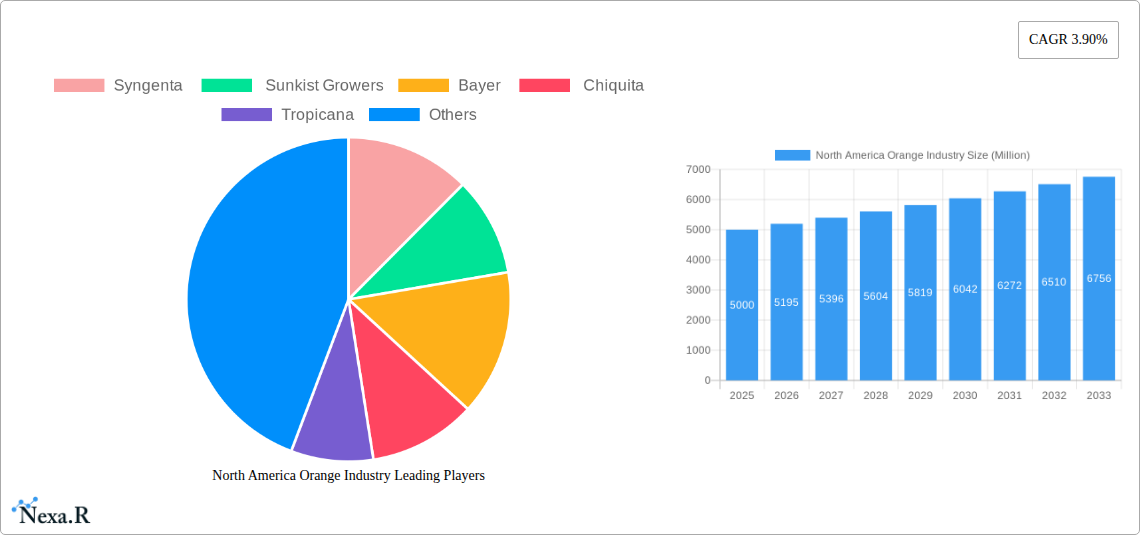
North America Orange Industry Market Size (In Billion)
The forecast period of 2025-2033 indicates a promising outlook for the North American orange industry, with a projected Compound Annual Growth Rate (CAGR) of 3.9%. This growth is anticipated to be driven by factors including the increasing adoption of orange-based functional beverages, the rising popularity of convenient, ready-to-consume orange products, and strategic marketing initiatives by key players. Nevertheless, maintaining consistent growth requires navigating potential challenges such as labor shortages, disease outbreaks, and evolving consumer preferences. Investing in research and development, fostering strong supply chain relationships, and emphasizing sustainability practices will be crucial for industry participants to capitalize on the growth opportunities and ensure long-term success within the competitive North American market. Regional variations within North America (United States, Canada, and Mexico) also present strategic considerations, with specific consumer preferences and market dynamics requiring tailored approaches.
North America Orange Industry Company Market Share
North America Orange Industry: Market Report 2019-2033
This comprehensive report provides an in-depth analysis of the North America orange industry, covering market dynamics, growth trends, key players, and future outlook. With a focus on both fresh and processed oranges, this report is essential for industry professionals, investors, and anyone seeking to understand this dynamic market. The study period spans from 2019-2033, with a base year of 2025 and a forecast period of 2025-2033. Market values are presented in millions of units.
North America Orange Industry Market Dynamics & Structure
The North American orange industry is characterized by a moderately concentrated market structure, with several large players dominating production and processing. Technological innovation, particularly in post-harvest handling and processing, is a key driver, alongside evolving consumer preferences towards premium and organic products. Stringent regulatory frameworks concerning food safety and pesticide use significantly impact operational costs and market dynamics. The industry faces competition from substitute fruits and beverages, requiring continuous product diversification and marketing efforts. Mergers and acquisitions (M&A) activity has been moderate, primarily focused on consolidation within processing and distribution segments.
- Market Concentration: The top five players account for approximately xx% of the total market share in 2025.
- Technological Innovation: Investments in automated harvesting, improved preservation techniques, and advanced processing technologies are driving efficiency gains.
- Regulatory Landscape: Compliance with FDA regulations and other food safety standards represents a significant cost factor.
- Competitive Substitutes: The industry competes with other citrus fruits, tropical fruits, and non-citrus juices.
- M&A Activity: An estimated xx M&A deals occurred between 2019 and 2024.
- End-User Demographics: Growing health consciousness is driving demand for fresh, minimally processed orange products.
North America Orange Industry Growth Trends & Insights
The North American orange industry experienced a fluctuating growth trajectory during the historical period (2019-2024), primarily influenced by weather patterns affecting yields and fluctuating consumer spending. However, the market is projected to witness a CAGR of xx% during the forecast period (2025-2033), driven by increasing demand, particularly from the processed orange segment. Consumer preferences are shifting toward healthier and convenient options, influencing product innovation and marketing strategies. Technological advancements in processing and packaging are enhancing product shelf life and reducing waste.
The market penetration of processed orange products remains high, with juice accounting for a significant share. However, the demand for premium fresh oranges, including organic varieties, is rising steadily. The adoption rate of innovative processing technologies, such as advanced juice extraction methods, is increasing, leading to improved product quality and yield. Changing consumer behaviors, driven by health awareness, are fostering demand for fortified juices and functional beverages.
Dominant Regions, Countries, or Segments in North America Orange Industry
Florida remains the dominant region for orange production in North America, accounting for approximately xx% of the total output in 2025. California also holds a significant share, particularly in the premium orange segment. Within the processed orange segment, orange juice dominates the market, followed by orange pulp and orange oils. The food and beverage industry, including juice manufacturers and beverage companies, constitutes the largest end-user segment.
- Key Drivers (Florida): Favorable climate, established infrastructure, and experienced workforce.
- Key Drivers (California): Premium orange cultivation, focus on organic farming, and proximity to large markets.
- Market Share: Florida: xx%, California: xx%, Other Regions: xx% (2025).
- Growth Potential: Premium orange segment (xx% CAGR), Organic orange segment (xx% CAGR).
North America Orange Industry Product Landscape
The North American orange industry offers a diverse product landscape encompassing fresh oranges (premium and conventional) and processed oranges (juice, pulp, and oils). Product innovations are focusing on enhancing nutritional value, extending shelf life, and offering convenient packaging formats. Technological advancements, such as high-pressure processing (HPP) and aseptic packaging, are improving product quality and safety. Unique selling propositions include organic certification, enhanced flavor profiles, and functional ingredients in processed products.
Key Drivers, Barriers & Challenges in North America Orange Industry
Key Drivers: The North America orange industry is propelled by a confluence of factors. A significant driver is the escalating consumer demand for healthier food and beverage choices, with orange juice being a popular source of Vitamin C and other vital nutrients. The convenience factor also plays a crucial role, as consumers increasingly seek ready-to-drink and easy-to-consume products. Technological advancements in citrus cultivation, processing, and packaging are continuously improving efficiency and product quality. Furthermore, government initiatives aimed at promoting sustainable agricultural practices and supporting the citrus sector provide a supportive ecosystem for growth.
Key Challenges: The industry faces multifaceted challenges that can impede its progress. Adverse weather conditions, including unseasonal frosts, droughts, and hurricanes, can lead to significant crop losses and price volatility. Supply chain disruptions, exacerbated by factors like increased transportation costs (a notable xx% increase in 2024) and logistical hurdles, impact the timely and cost-effective delivery of oranges and their products. Fluctuating orange prices, influenced by supply and demand dynamics and global market forces, create uncertainty for both producers and consumers. Intense competition from a wide array of substitute beverages, including other fruit juices, functional drinks, and water-based beverages, necessitates continuous innovation and effective marketing. Stringent regulatory compliance across various jurisdictions and rising labor costs add to the operational expenses and can affect profitability. The persistent threat of disease outbreaks, most notably citrus greening disease (HLB), poses a severe risk to grove health, reducing yields and potentially decimating entire orchards.
Emerging Opportunities in North America Orange Industry
The North America orange industry is ripe with emerging opportunities, driven by evolving consumer preferences and market dynamics. There's a significant and growing demand for functional and fortified orange juices, incorporating added vitamins, minerals, and other health-promoting ingredients to cater to a more health-conscious consumer base. The market for organic and premium orange products, emphasizing quality, natural ingredients, and ethical sourcing, is expanding rapidly. Furthermore, convenient packaging formats, such as single-serve pouches and ready-to-drink options, are gaining traction, appealing to busy lifestyles. Strategic market expansion into underserved regions and the development of innovative product applications, such as orange-infused functional foods, beverages, and even cosmetic ingredients, offer substantial growth potential. Catering to the growing consumer demand for sustainable and ethically sourced products, including those with traceable supply chains and reduced environmental impact, presents a key avenue for differentiation and market leadership.
Growth Accelerators in the North America Orange Industry Industry
Several key factors are poised to accelerate the growth of the North America orange industry. Continuous technological advancements in post-harvest management, including improved storage, handling, and transportation techniques, are crucial for minimizing spoilage and maintaining product quality throughout the supply chain. The adoption of innovative processing technologies, such as advanced pasteurization methods and novel extraction techniques, can enhance product yield, quality, and shelf-life, while also enabling the development of new product forms. Strategic partnerships and collaborations across the value chain, from growers to processors and retailers, can lead to enhanced supply chain efficiency, cost optimization, and improved market access. Market expansion into new geographical regions, both domestically and internationally, and the targeted engagement of previously untapped consumer segments, such as younger demographics with specific flavor preferences or health interests, are vital for broader market penetration. The ongoing development and adoption of resilient and disease-resistant orange varieties are paramount for ensuring long-term sustainability and mitigating the impact of significant agricultural threats.
Key Players Shaping the North America Orange Industry Market
Notable Milestones in North America Orange Industry Sector
- 2020: Tropicana, a prominent juice brand, successfully launched a range of new functional orange juice varieties, enriched with essential vitamins and minerals to meet growing consumer demand for health-boosting beverages.
- 2022: Syngenta, a global leader in agricultural innovation, introduced a groundbreaking new disease-resistant orange tree variety, offering hope for improved grove resilience against prevalent citrus diseases.
- 2023: Sunkist Growers significantly expanded its commitment to organic farming by increasing its organic orange production capacity, catering to the rising consumer preference for naturally grown produce.
- 2024: The industry witnessed a consolidation trend with several smaller orange juice manufacturers merging to form larger, more efficient processing units, aiming to achieve economies of scale and enhanced market competitiveness.
In-Depth North America Orange Industry Market Outlook
The North America orange industry is on a trajectory for sustained and robust growth. This upward trend will be primarily fueled by continuous innovation in product development and processing, coupled with a strong and evolving consumer demand for premium, convenient, and health-oriented orange products. Significant efforts are being made across the industry to enhance supply chain efficiency, ensuring a more reliable and cost-effective flow from farm to table. The industry's capacity to proactively adapt to the challenges posed by climate change, effectively manage and mitigate the impact of disease outbreaks, and steadfastly implement sustainable and environmentally responsible practices will be absolutely critical for securing its long-term viability and success. The future landscape of this vital sector will be significantly shaped by strategic alliances, substantial investments in cutting-edge technologies, and the continuous exploration of new markets and innovative product applications that align with emerging consumer needs and preferences.
North America Orange Industry Segmentation
- 1. Production Analysis
- 2. Consumption Analysis
- 3. Import Market Analysis (Value & Volume)
- 4. Export Market Analysis (Value & Volume)
- 5. Price Trend Analysis
North America Orange Industry Segmentation By Geography
- 1. United States
- 2. Canada
- 3. Mexico
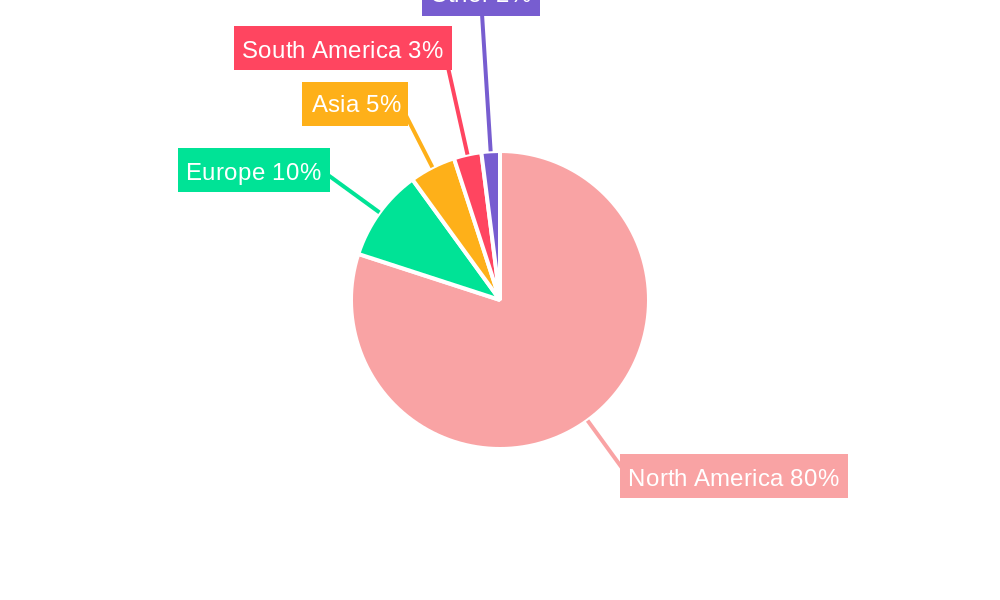
North America Orange Industry Regional Market Share
Geographic Coverage of North America Orange Industry
North America Orange Industry REPORT HIGHLIGHTS
| Aspects | Details |
|---|---|
| Study Period | 2020-2034 |
| Base Year | 2025 |
| Estimated Year | 2026 |
| Forecast Period | 2026-2034 |
| Historical Period | 2020-2025 |
| Growth Rate | CAGR of 3.90% from 2020-2034 |
| Segmentation |
|
Table of Contents
- 1. Introduction
- 1.1. Research Scope
- 1.2. Market Segmentation
- 1.3. Research Objective
- 1.4. Definitions and Assumptions
- 2. Executive Summary
- 2.1. Market Snapshot
- 3. Market Dynamics
- 3.1. Market Drivers
- 3.2. Market Restrains
- 3.3. Market Trends
- 3.4. Market Opportunities
- 4. Market Factor Analysis
- 4.1. Porters Five Forces
- 4.1.1. Bargaining Power of Suppliers
- 4.1.2. Bargaining Power of Buyers
- 4.1.3. Threat of New Entrants
- 4.1.4. Threat of Substitutes
- 4.1.5. Competitive Rivalry
- 4.2. PESTEL analysis
- 4.3. BCG Analysis
- 4.3.1. Stars (High Growth, High Market Share)
- 4.3.2. Cash Cows (Low Growth, High Market Share)
- 4.3.3. Question Mark (High Growth, Low Market Share)
- 4.3.4. Dogs (Low Growth, Low Market Share)
- 4.4. Ansoff Matrix Analysis
- 4.5. Supply Chain Analysis
- 4.6. Regulatory Landscape
- 4.7. Current Market Potential and Opportunity Assessment (TAM–SAM–SOM Framework)
- 4.8. NRP Analyst Note
- 4.1. Porters Five Forces
- 5. Market Analysis, Insights and Forecast 2021-2033
- 5.1. Market Analysis, Insights and Forecast - by Production Analysis
- 5.2. Market Analysis, Insights and Forecast - by Consumption Analysis
- 5.3. Market Analysis, Insights and Forecast - by Import Market Analysis (Value & Volume)
- 5.4. Market Analysis, Insights and Forecast - by Export Market Analysis (Value & Volume)
- 5.5. Market Analysis, Insights and Forecast - by Price Trend Analysis
- 5.6. Market Analysis, Insights and Forecast - by Region
- 5.6.1. United States
- 5.6.2. Canada
- 5.6.3. Mexico
- 6. North America Orange Industry Analysis, Insights and Forecast, 2021-2033
- 6.1. Market Analysis, Insights and Forecast - by Production Analysis
- 6.2. Market Analysis, Insights and Forecast - by Consumption Analysis
- 6.3. Market Analysis, Insights and Forecast - by Import Market Analysis (Value & Volume)
- 6.4. Market Analysis, Insights and Forecast - by Export Market Analysis (Value & Volume)
- 6.5. Market Analysis, Insights and Forecast - by Price Trend Analysis
- 7. United States North America Orange Industry Analysis, Insights and Forecast, 2020-2032
- 7.1. Market Analysis, Insights and Forecast - by Production Analysis
- 7.2. Market Analysis, Insights and Forecast - by Consumption Analysis
- 7.3. Market Analysis, Insights and Forecast - by Import Market Analysis (Value & Volume)
- 7.4. Market Analysis, Insights and Forecast - by Export Market Analysis (Value & Volume)
- 7.5. Market Analysis, Insights and Forecast - by Price Trend Analysis
- 8. Canada North America Orange Industry Analysis, Insights and Forecast, 2020-2032
- 8.1. Market Analysis, Insights and Forecast - by Production Analysis
- 8.2. Market Analysis, Insights and Forecast - by Consumption Analysis
- 8.3. Market Analysis, Insights and Forecast - by Import Market Analysis (Value & Volume)
- 8.4. Market Analysis, Insights and Forecast - by Export Market Analysis (Value & Volume)
- 8.5. Market Analysis, Insights and Forecast - by Price Trend Analysis
- 9. Mexico North America Orange Industry Analysis, Insights and Forecast, 2020-2032
- 9.1. Market Analysis, Insights and Forecast - by Production Analysis
- 9.2. Market Analysis, Insights and Forecast - by Consumption Analysis
- 9.3. Market Analysis, Insights and Forecast - by Import Market Analysis (Value & Volume)
- 9.4. Market Analysis, Insights and Forecast - by Export Market Analysis (Value & Volume)
- 9.5. Market Analysis, Insights and Forecast - by Price Trend Analysis
- 10. Competitive Analysis
- 10.1. Company Profiles
- 10.1.1 Syngenta
- 10.1.1.1. Company Overview
- 10.1.1.2. Products
- 10.1.1.3. Company Financials
- 10.1.1.4. SWOT Analysis
- 10.1.2 Sunkist Growers
- 10.1.2.1. Company Overview
- 10.1.2.2. Products
- 10.1.2.3. Company Financials
- 10.1.2.4. SWOT Analysis
- 10.1.3 Bayer
- 10.1.3.1. Company Overview
- 10.1.3.2. Products
- 10.1.3.3. Company Financials
- 10.1.3.4. SWOT Analysis
- 10.1.4 Chiquita
- 10.1.4.1. Company Overview
- 10.1.4.2. Products
- 10.1.4.3. Company Financials
- 10.1.4.4. SWOT Analysis
- 10.1.5 Tropicana
- 10.1.5.1. Company Overview
- 10.1.5.2. Products
- 10.1.5.3. Company Financials
- 10.1.5.4. SWOT Analysis
- 10.1.1 Syngenta
- 10.2. Market Entropy
- 10.2.1 Company's Key Areas Served
- 10.2.2 Recent Developments
- 10.3. Company Market Share Analysis 2025
- 10.3.1 Top 5 Companies Market Share Analysis
- 10.3.2 Top 3 Companies Market Share Analysis
- 10.4. List of Potential Customers
- 11. Research Methodology
List of Figures
- Figure 1: North America Orange Industry Revenue Breakdown (Million, %) by Product 2025 & 2033
- Figure 2: North America Orange Industry Share (%) by Company 2025
List of Tables
- Table 1: North America Orange Industry Revenue Million Forecast, by Production Analysis 2020 & 2033
- Table 2: North America Orange Industry Volume Kiloton Forecast, by Production Analysis 2020 & 2033
- Table 3: North America Orange Industry Revenue Million Forecast, by Consumption Analysis 2020 & 2033
- Table 4: North America Orange Industry Volume Kiloton Forecast, by Consumption Analysis 2020 & 2033
- Table 5: North America Orange Industry Revenue Million Forecast, by Import Market Analysis (Value & Volume) 2020 & 2033
- Table 6: North America Orange Industry Volume Kiloton Forecast, by Import Market Analysis (Value & Volume) 2020 & 2033
- Table 7: North America Orange Industry Revenue Million Forecast, by Export Market Analysis (Value & Volume) 2020 & 2033
- Table 8: North America Orange Industry Volume Kiloton Forecast, by Export Market Analysis (Value & Volume) 2020 & 2033
- Table 9: North America Orange Industry Revenue Million Forecast, by Price Trend Analysis 2020 & 2033
- Table 10: North America Orange Industry Volume Kiloton Forecast, by Price Trend Analysis 2020 & 2033
- Table 11: North America Orange Industry Revenue Million Forecast, by Region 2020 & 2033
- Table 12: North America Orange Industry Volume Kiloton Forecast, by Region 2020 & 2033
- Table 13: North America Orange Industry Revenue Million Forecast, by Production Analysis 2020 & 2033
- Table 14: North America Orange Industry Volume Kiloton Forecast, by Production Analysis 2020 & 2033
- Table 15: North America Orange Industry Revenue Million Forecast, by Consumption Analysis 2020 & 2033
- Table 16: North America Orange Industry Volume Kiloton Forecast, by Consumption Analysis 2020 & 2033
- Table 17: North America Orange Industry Revenue Million Forecast, by Import Market Analysis (Value & Volume) 2020 & 2033
- Table 18: North America Orange Industry Volume Kiloton Forecast, by Import Market Analysis (Value & Volume) 2020 & 2033
- Table 19: North America Orange Industry Revenue Million Forecast, by Export Market Analysis (Value & Volume) 2020 & 2033
- Table 20: North America Orange Industry Volume Kiloton Forecast, by Export Market Analysis (Value & Volume) 2020 & 2033
- Table 21: North America Orange Industry Revenue Million Forecast, by Price Trend Analysis 2020 & 2033
- Table 22: North America Orange Industry Volume Kiloton Forecast, by Price Trend Analysis 2020 & 2033
- Table 23: North America Orange Industry Revenue Million Forecast, by Country 2020 & 2033
- Table 24: North America Orange Industry Volume Kiloton Forecast, by Country 2020 & 2033
- Table 25: North America Orange Industry Revenue Million Forecast, by Production Analysis 2020 & 2033
- Table 26: North America Orange Industry Volume Kiloton Forecast, by Production Analysis 2020 & 2033
- Table 27: North America Orange Industry Revenue Million Forecast, by Consumption Analysis 2020 & 2033
- Table 28: North America Orange Industry Volume Kiloton Forecast, by Consumption Analysis 2020 & 2033
- Table 29: North America Orange Industry Revenue Million Forecast, by Import Market Analysis (Value & Volume) 2020 & 2033
- Table 30: North America Orange Industry Volume Kiloton Forecast, by Import Market Analysis (Value & Volume) 2020 & 2033
- Table 31: North America Orange Industry Revenue Million Forecast, by Export Market Analysis (Value & Volume) 2020 & 2033
- Table 32: North America Orange Industry Volume Kiloton Forecast, by Export Market Analysis (Value & Volume) 2020 & 2033
- Table 33: North America Orange Industry Revenue Million Forecast, by Price Trend Analysis 2020 & 2033
- Table 34: North America Orange Industry Volume Kiloton Forecast, by Price Trend Analysis 2020 & 2033
- Table 35: North America Orange Industry Revenue Million Forecast, by Country 2020 & 2033
- Table 36: North America Orange Industry Volume Kiloton Forecast, by Country 2020 & 2033
- Table 37: North America Orange Industry Revenue Million Forecast, by Production Analysis 2020 & 2033
- Table 38: North America Orange Industry Volume Kiloton Forecast, by Production Analysis 2020 & 2033
- Table 39: North America Orange Industry Revenue Million Forecast, by Consumption Analysis 2020 & 2033
- Table 40: North America Orange Industry Volume Kiloton Forecast, by Consumption Analysis 2020 & 2033
- Table 41: North America Orange Industry Revenue Million Forecast, by Import Market Analysis (Value & Volume) 2020 & 2033
- Table 42: North America Orange Industry Volume Kiloton Forecast, by Import Market Analysis (Value & Volume) 2020 & 2033
- Table 43: North America Orange Industry Revenue Million Forecast, by Export Market Analysis (Value & Volume) 2020 & 2033
- Table 44: North America Orange Industry Volume Kiloton Forecast, by Export Market Analysis (Value & Volume) 2020 & 2033
- Table 45: North America Orange Industry Revenue Million Forecast, by Price Trend Analysis 2020 & 2033
- Table 46: North America Orange Industry Volume Kiloton Forecast, by Price Trend Analysis 2020 & 2033
- Table 47: North America Orange Industry Revenue Million Forecast, by Country 2020 & 2033
- Table 48: North America Orange Industry Volume Kiloton Forecast, by Country 2020 & 2033
Frequently Asked Questions
1. What is the projected Compound Annual Growth Rate (CAGR) of the North America Orange Industry?
The projected CAGR is approximately 3.90%.
2. Which companies are prominent players in the North America Orange Industry?
Key companies in the market include Syngenta , Sunkist Growers, Bayer , Chiquita, Tropicana.
3. What are the main segments of the North America Orange Industry?
The market segments include Production Analysis, Consumption Analysis, Import Market Analysis (Value & Volume), Export Market Analysis (Value & Volume), Price Trend Analysis.
4. Can you provide details about the market size?
The market size is estimated to be USD XXX Million as of 2022.
5. What are some drivers contributing to market growth?
Rising Consumption of Cashew Nuts in the Country; Favorable Government Initiatives.
6. What are the notable trends driving market growth?
Continuous Increase in Production of Oranges in Mexico.
7. Are there any restraints impacting market growth?
Hazardous Climatic Condition Hinders Cashew Production; Stringent Regulations Related to Food Quality Standards.
8. Can you provide examples of recent developments in the market?
N/A
9. What pricing options are available for accessing the report?
Pricing options include single-user, multi-user, and enterprise licenses priced at USD 4750, USD 5250, and USD 8750 respectively.
10. Is the market size provided in terms of value or volume?
The market size is provided in terms of value, measured in Million and volume, measured in Kiloton.
11. Are there any specific market keywords associated with the report?
Yes, the market keyword associated with the report is "North America Orange Industry," which aids in identifying and referencing the specific market segment covered.
12. How do I determine which pricing option suits my needs best?
The pricing options vary based on user requirements and access needs. Individual users may opt for single-user licenses, while businesses requiring broader access may choose multi-user or enterprise licenses for cost-effective access to the report.
13. Are there any additional resources or data provided in the North America Orange Industry report?
While the report offers comprehensive insights, it's advisable to review the specific contents or supplementary materials provided to ascertain if additional resources or data are available.
14. How can I stay updated on further developments or reports in the North America Orange Industry?
To stay informed about further developments, trends, and reports in the North America Orange Industry, consider subscribing to industry newsletters, following relevant companies and organizations, or regularly checking reputable industry news sources and publications.
Methodology
Step 1 - Identification of Relevant Samples Size from Population Database


Step 2 - Approaches for Defining Global Market Size (Value, Volume* & Price*)

Note*: In applicable scenarios
Step 3 - Data Sources
Primary Research
- Web Analytics
- Survey Reports
- Research Institute
- Latest Research Reports
- Opinion Leaders
Secondary Research
- Annual Reports
- White Paper
- Latest Press Release
- Industry Association
- Paid Database
- Investor Presentations

Step 4 - Data Triangulation
Involves using different sources of information in order to increase the validity of a study
These sources are likely to be stakeholders in a program - participants, other researchers, program staff, other community members, and so on.
Then we put all data in single framework & apply various statistical tools to find out the dynamic on the market.
During the analysis stage, feedback from the stakeholder groups would be compared to determine areas of agreement as well as areas of divergence