

Key Insights
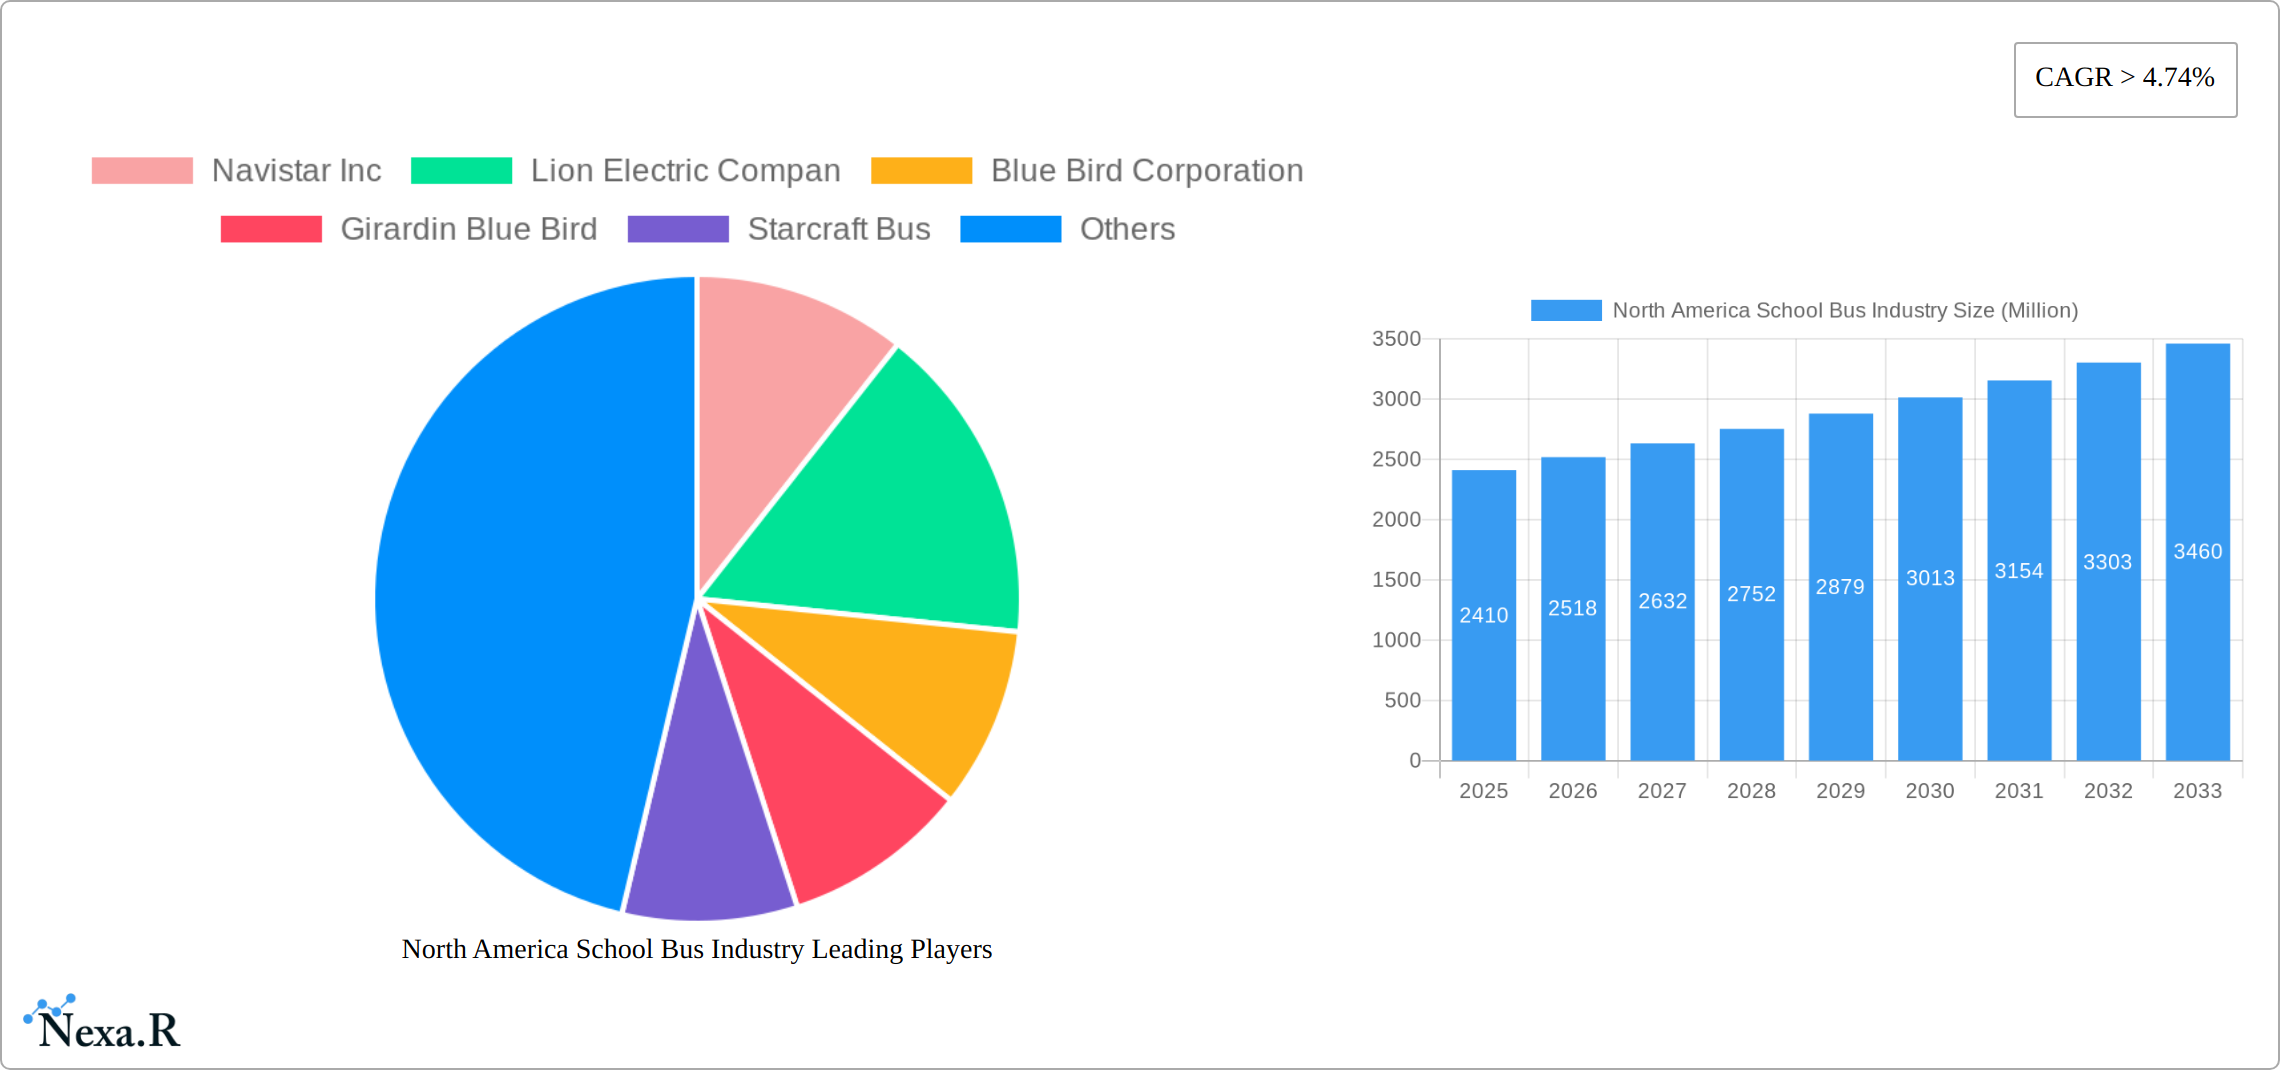
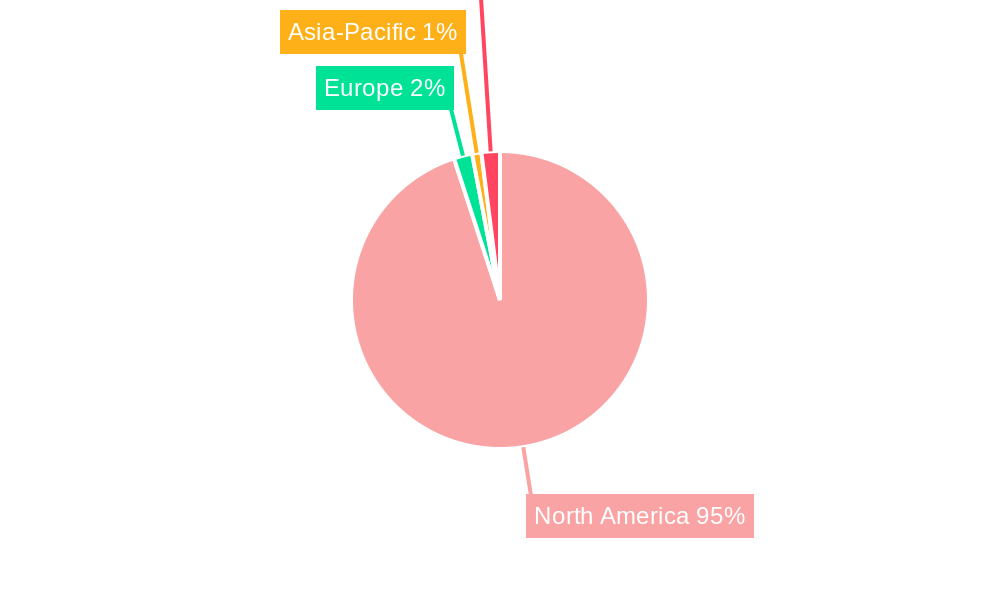
The North American school bus industry, valued at $2.41 billion in 2025, is projected to experience robust growth, driven by increasing student enrollment, government initiatives promoting school safety and modernization, and a rising focus on sustainable transportation solutions. The market's Compound Annual Growth Rate (CAGR) exceeding 4.74% from 2025 to 2033 indicates significant expansion. Key market drivers include the replacement of aging fleets, stricter emission regulations necessitating the adoption of cleaner technologies like electric buses, and evolving safety standards. The shift towards electric powertrains is a significant trend, gradually replacing traditional internal combustion engine (ICE) buses, albeit at a pace influenced by factors like infrastructure development and battery technology advancements. However, the high initial cost of electric buses and limited charging infrastructure pose restraints to immediate widespread adoption. The market is segmented by powertrain (ICE and electric) and bus type (Type C, Type D, and others), with Type C and D buses dominating the market due to their capacity to accommodate a larger number of students. Major players like Navistar Inc., Lion Electric Co., Blue Bird Corporation, and Daimler AG (Thomas Built Buses) are actively competing, investing in technological advancements and expanding their market presence. Regional analysis shows the United States as the largest market within North America, followed by Canada and Mexico. The industry’s future growth trajectory is heavily dependent on successful integration of electric vehicle infrastructure and continued governmental support for sustainable transportation initiatives.
The continued growth will be fueled by several factors: Government funding programs aimed at improving school transportation infrastructure will continue to stimulate demand for new buses, particularly electric models. Furthermore, increasing concerns about air quality and greenhouse gas emissions are incentivizing school districts to adopt environmentally friendly electric buses. The industry's long-term success hinges on addressing the challenges associated with high initial costs of electric vehicles, the expansion of charging infrastructure, and the ongoing need for robust, reliable, and safe transportation for students. The successful navigation of these factors will determine the speed and scale of market expansion in the coming years.
North America School Bus Industry: A Comprehensive Market Report (2019-2033)
This in-depth report provides a comprehensive analysis of the North America school bus industry, covering market dynamics, growth trends, key players, and future outlook. With a focus on both the parent market (commercial vehicle manufacturing) and the child market (school transportation), this report offers invaluable insights for industry professionals, investors, and strategic decision-makers. The study period spans from 2019 to 2033, with 2025 as the base and estimated year.
Keywords: School bus market, North America school bus industry, electric school buses, school bus manufacturers, Type C school bus, Type D school bus, school transportation, IC engine school buses, Navistar, Lion Electric, Blue Bird, Thomas Built Buses, market size, market share, growth forecast, industry trends, regulatory landscape, competitive analysis.
North America School Bus Industry Market Dynamics & Structure
The North American school bus market is a dynamic landscape shaped by technological advancements, stringent regulations, and evolving consumer preferences. Market concentration is moderate, with several major players and numerous smaller regional operators. The market is witnessing a significant shift towards electric school buses, driven by environmental concerns and government incentives. However, high initial investment costs and limited charging infrastructure remain significant barriers to widespread adoption. Mergers and acquisitions (M&A) activity has been steadily increasing, reflecting consolidation trends and strategic partnerships aimed at expanding market reach and technological capabilities.
- Market Concentration: Moderately concentrated, with top five players holding approximately xx% market share in 2025.
- Technological Innovation Drivers: Electrification, automation, advanced safety features (e.g., cameras, sensors).
- Regulatory Frameworks: Increasingly stringent emission standards and safety regulations, driving the adoption of electric and technologically advanced vehicles.
- Competitive Product Substitutes: Limited direct substitutes; however, alternative transportation solutions (e.g., ride-sharing services) are indirectly competitive.
- End-User Demographics: Primarily school districts, with varying budgets and technological adoption rates across different regions.
- M&A Trends: Increasing M&A activity, particularly among manufacturers of electric school buses and companies offering related services (e.g., charging infrastructure). xx M&A deals were recorded between 2019 and 2024.
North America School Bus Industry Growth Trends & Insights
The North America school bus market experienced a CAGR of xx% during the historical period (2019-2024) and is projected to grow at a CAGR of xx% during the forecast period (2025-2033). Market size reached approximately xx million units in 2024 and is estimated to reach xx million units in 2025. The transition towards electric school buses is a major growth driver, alongside increasing government funding and initiatives for fleet modernization. However, economic factors and supply chain disruptions may influence growth trajectories in the coming years. Consumer behavior is shifting towards prioritizing safety, sustainability, and technological advancements in school buses. Market penetration of electric school buses is increasing steadily, although it remains a small percentage of the overall market.

Dominant Regions, Countries, or Segments in North America School Bus Industry
The Californian and Northeastern regions of the United States are currently leading the market in terms of electric school bus adoption due to stringent emission regulations and supportive government policies. Within bus types, Type C school buses hold the largest market share, followed by Type D buses. The shift towards electric powertrains is a significant trend across all regions and bus types.
- Key Drivers:
- California: Stringent emission regulations, substantial government funding for electric vehicle adoption, and proactive school district policies.
- Northeastern US: Strong environmental consciousness, supportive government incentives, and increasing focus on sustainable transportation solutions.
- Electric Powertrain Segment: Driven by environmental concerns, government incentives, and technological advancements reducing the total cost of ownership.
- Dominance Factors:
- California: High adoption rates of electric buses, significant investments in charging infrastructure, and strong advocacy for electric vehicles.
- Northeastern US: High population density, strong emphasis on environmental sustainability, and proactive engagement from school districts and government bodies.
- Electric Powertrain: Technological advancements, decreasing battery costs, government subsidies and incentives, and growing environmental awareness.
North America School Bus Industry Product Landscape
The school bus market features a diverse range of products, including Type C, Type D, and other specialized buses, each powered by either internal combustion engines (ICE) or electric powertrains. Product innovation focuses on enhancing safety, fuel efficiency, and environmental sustainability. Key features include advanced driver-assistance systems, improved passenger comfort, and enhanced durability. Electric school buses are increasingly incorporating advanced battery technologies and efficient charging systems to maximize operational efficiency and reduce environmental impact. Key selling propositions include reduced emissions, lower operating costs (for electric models), increased safety features, and improved passenger comfort.
Key Drivers, Barriers & Challenges in North America School Bus Industry
Key Drivers:
- Increasing government funding and incentives for electric school buses.
- Growing environmental concerns and focus on reducing emissions.
- Technological advancements improving the performance and affordability of electric buses.
- Improved safety features in new school bus models.
Key Challenges and Restraints:
- High upfront costs associated with purchasing electric school buses.
- Limited availability of charging infrastructure in some regions.
- Supply chain disruptions impacting the production and availability of components.
- Long lead times for electric school bus orders.
- xx% increase in raw material costs impacted the overall bus production cost.
Emerging Opportunities in North America School Bus Industry
- Expansion into rural markets with limited access to traditional transportation.
- Development of innovative financing models to reduce upfront costs for school districts.
- Integration of smart technologies (e.g., telematics, predictive maintenance) for improved fleet management.
- Exploration of alternative fuel sources (e.g., hydrogen fuel cells) for school buses.
- Growing demand for customized school bus solutions catering to diverse requirements.
Growth Accelerators in the North America School Bus Industry
Long-term growth will be fueled by continued technological advancements in electric bus technology, leading to lower costs and improved performance. Strategic partnerships between manufacturers, charging infrastructure providers, and school districts will also accelerate adoption. Expansion into underserved markets, coupled with innovative financing options, will further stimulate market growth. Government policies encouraging sustainable transportation will play a crucial role in shaping future market dynamics.
Key Players Shaping the North America School Bus Industry Market
- Navistar Inc
- Lion Electric Co.
- Blue Bird Corporation
- Girardin Blue Bird
- Starcraft Bus
- Trans Tech
- Collins Bus Corporation
- Daimler AG (Thomas Built Buses)
Notable Milestones in North America School Bus Industry Sector
- October 2023: Blue Bird delivers its 1,500th electric school bus and inaugurates its EV Build-up Center in Georgia.
- November 2023: Lion Electric secures a provisional order for 50 LionC all-electric school buses from Highland Electric Fleets.
- November 2022: Lion Electric produces its first zero-emission LionC school bus in Joliet, Illinois.
- October 2022: Thomas Built Buses delivers its 200th Proterra Powered Saf-T-Liner C2 Jouley electric school bus.
- March 2022: Thomas Built Buses and Highland Electric Fleets expand their partnership to accelerate electric bus adoption.
In-Depth North America School Bus Industry Market Outlook
The future of the North American school bus industry is bright, driven by the accelerating shift towards electric vehicles and technological innovations. Significant growth potential lies in expanding electric bus adoption across diverse regions and school districts. Strategic collaborations and innovative financing solutions will unlock new market opportunities. The industry is poised for significant transformation, with sustainability and technological advancements defining its future trajectory. The market is expected to experience substantial growth in the coming years, driven by factors mentioned above and further enhanced by the adoption of autonomous driving technologies.
North America School Bus Industry Segmentation
-
1. Powertrain
- 1.1. IC Engine
- 1.2. Electric
-
2. Bus Type
- 2.1. Type C
- 2.2. Type D
- 2.3. Other Types
-
3. Geography
- 3.1. United States
- 3.2. Canada
- 3.3. Rest of North America
North America School Bus Industry Segmentation By Geography
- 1. United States
- 2. Canada
- 3. Rest of North America
North America School Bus Industry REPORT HIGHLIGHTS
| Aspects | Details |
|---|---|
| Study Period | 2019-2033 |
| Base Year | 2024 |
| Estimated Year | 2025 |
| Forecast Period | 2025-2033 |
| Historical Period | 2019-2024 |
| Growth Rate | CAGR of > 4.74% from 2019-2033 |
| Segmentation |
|
Table of Contents
- 1. Introduction
- 1.1. Research Scope
- 1.2. Market Segmentation
- 1.3. Research Methodology
- 1.4. Definitions and Assumptions
- 2. Executive Summary
- 2.1. Introduction
- 3. Market Dynamics
- 3.1. Introduction
- 3.2. Market Drivers
- 3.2.1. Increasing Demand For Electric School Buses
- 3.3. Market Restrains
- 3.3.1. Uncertainty of The Global Pandemic
- 3.4. Market Trends
- 3.4.1. The Industry’s Shift Toward the Adoption of Electric School Buses
- 4. Market Factor Analysis
- 4.1. Porters Five Forces
- 4.2. Supply/Value Chain
- 4.3. PESTEL analysis
- 4.4. Market Entropy
- 4.5. Patent/Trademark Analysis
- 5. North America School Bus Industry Analysis, Insights and Forecast, 2019-2031
- 5.1. Market Analysis, Insights and Forecast - by Powertrain
- 5.1.1. IC Engine
- 5.1.2. Electric
- 5.2. Market Analysis, Insights and Forecast - by Bus Type
- 5.2.1. Type C
- 5.2.2. Type D
- 5.2.3. Other Types
- 5.3. Market Analysis, Insights and Forecast - by Geography
- 5.3.1. United States
- 5.3.2. Canada
- 5.3.3. Rest of North America
- 5.4. Market Analysis, Insights and Forecast - by Region
- 5.4.1. United States
- 5.4.2. Canada
- 5.4.3. Rest of North America
- 5.1. Market Analysis, Insights and Forecast - by Powertrain
- 6. United States North America School Bus Industry Analysis, Insights and Forecast, 2019-2031
- 6.1. Market Analysis, Insights and Forecast - by Powertrain
- 6.1.1. IC Engine
- 6.1.2. Electric
- 6.2. Market Analysis, Insights and Forecast - by Bus Type
- 6.2.1. Type C
- 6.2.2. Type D
- 6.2.3. Other Types
- 6.3. Market Analysis, Insights and Forecast - by Geography
- 6.3.1. United States
- 6.3.2. Canada
- 6.3.3. Rest of North America
- 6.1. Market Analysis, Insights and Forecast - by Powertrain
- 7. Canada North America School Bus Industry Analysis, Insights and Forecast, 2019-2031
- 7.1. Market Analysis, Insights and Forecast - by Powertrain
- 7.1.1. IC Engine
- 7.1.2. Electric
- 7.2. Market Analysis, Insights and Forecast - by Bus Type
- 7.2.1. Type C
- 7.2.2. Type D
- 7.2.3. Other Types
- 7.3. Market Analysis, Insights and Forecast - by Geography
- 7.3.1. United States
- 7.3.2. Canada
- 7.3.3. Rest of North America
- 7.1. Market Analysis, Insights and Forecast - by Powertrain
- 8. Rest of North America North America School Bus Industry Analysis, Insights and Forecast, 2019-2031
- 8.1. Market Analysis, Insights and Forecast - by Powertrain
- 8.1.1. IC Engine
- 8.1.2. Electric
- 8.2. Market Analysis, Insights and Forecast - by Bus Type
- 8.2.1. Type C
- 8.2.2. Type D
- 8.2.3. Other Types
- 8.3. Market Analysis, Insights and Forecast - by Geography
- 8.3.1. United States
- 8.3.2. Canada
- 8.3.3. Rest of North America
- 8.1. Market Analysis, Insights and Forecast - by Powertrain
- 9. United States North America School Bus Industry Analysis, Insights and Forecast, 2019-2031
- 10. Canada North America School Bus Industry Analysis, Insights and Forecast, 2019-2031
- 11. Mexico North America School Bus Industry Analysis, Insights and Forecast, 2019-2031
- 12. Rest of North America North America School Bus Industry Analysis, Insights and Forecast, 2019-2031
- 13. Competitive Analysis
- 13.1. Market Share Analysis 2024
- 13.2. Company Profiles
- 13.2.1 Navistar Inc
- 13.2.1.1. Overview
- 13.2.1.2. Products
- 13.2.1.3. SWOT Analysis
- 13.2.1.4. Recent Developments
- 13.2.1.5. Financials (Based on Availability)
- 13.2.2 Lion Electric Compan
- 13.2.2.1. Overview
- 13.2.2.2. Products
- 13.2.2.3. SWOT Analysis
- 13.2.2.4. Recent Developments
- 13.2.2.5. Financials (Based on Availability)
- 13.2.3 Blue Bird Corporation
- 13.2.3.1. Overview
- 13.2.3.2. Products
- 13.2.3.3. SWOT Analysis
- 13.2.3.4. Recent Developments
- 13.2.3.5. Financials (Based on Availability)
- 13.2.4 Girardin Blue Bird
- 13.2.4.1. Overview
- 13.2.4.2. Products
- 13.2.4.3. SWOT Analysis
- 13.2.4.4. Recent Developments
- 13.2.4.5. Financials (Based on Availability)
- 13.2.5 Starcraft Bus
- 13.2.5.1. Overview
- 13.2.5.2. Products
- 13.2.5.3. SWOT Analysis
- 13.2.5.4. Recent Developments
- 13.2.5.5. Financials (Based on Availability)
- 13.2.6 Trans Tech
- 13.2.6.1. Overview
- 13.2.6.2. Products
- 13.2.6.3. SWOT Analysis
- 13.2.6.4. Recent Developments
- 13.2.6.5. Financials (Based on Availability)
- 13.2.7 Collins Bus Corporation
- 13.2.7.1. Overview
- 13.2.7.2. Products
- 13.2.7.3. SWOT Analysis
- 13.2.7.4. Recent Developments
- 13.2.7.5. Financials (Based on Availability)
- 13.2.8 Daimler AG (Thomas Built Buses)
- 13.2.8.1. Overview
- 13.2.8.2. Products
- 13.2.8.3. SWOT Analysis
- 13.2.8.4. Recent Developments
- 13.2.8.5. Financials (Based on Availability)
- 13.2.1 Navistar Inc
List of Figures
- Figure 1: North America School Bus Industry Revenue Breakdown (Million, %) by Product 2024 & 2032
- Figure 2: North America School Bus Industry Share (%) by Company 2024
List of Tables
- Table 1: North America School Bus Industry Revenue Million Forecast, by Region 2019 & 2032
- Table 2: North America School Bus Industry Revenue Million Forecast, by Powertrain 2019 & 2032
- Table 3: North America School Bus Industry Revenue Million Forecast, by Bus Type 2019 & 2032
- Table 4: North America School Bus Industry Revenue Million Forecast, by Geography 2019 & 2032
- Table 5: North America School Bus Industry Revenue Million Forecast, by Region 2019 & 2032
- Table 6: North America School Bus Industry Revenue Million Forecast, by Country 2019 & 2032
- Table 7: United States North America School Bus Industry Revenue (Million) Forecast, by Application 2019 & 2032
- Table 8: Canada North America School Bus Industry Revenue (Million) Forecast, by Application 2019 & 2032
- Table 9: Mexico North America School Bus Industry Revenue (Million) Forecast, by Application 2019 & 2032
- Table 10: Rest of North America North America School Bus Industry Revenue (Million) Forecast, by Application 2019 & 2032
- Table 11: North America School Bus Industry Revenue Million Forecast, by Powertrain 2019 & 2032
- Table 12: North America School Bus Industry Revenue Million Forecast, by Bus Type 2019 & 2032
- Table 13: North America School Bus Industry Revenue Million Forecast, by Geography 2019 & 2032
- Table 14: North America School Bus Industry Revenue Million Forecast, by Country 2019 & 2032
- Table 15: North America School Bus Industry Revenue Million Forecast, by Powertrain 2019 & 2032
- Table 16: North America School Bus Industry Revenue Million Forecast, by Bus Type 2019 & 2032
- Table 17: North America School Bus Industry Revenue Million Forecast, by Geography 2019 & 2032
- Table 18: North America School Bus Industry Revenue Million Forecast, by Country 2019 & 2032
- Table 19: North America School Bus Industry Revenue Million Forecast, by Powertrain 2019 & 2032
- Table 20: North America School Bus Industry Revenue Million Forecast, by Bus Type 2019 & 2032
- Table 21: North America School Bus Industry Revenue Million Forecast, by Geography 2019 & 2032
- Table 22: North America School Bus Industry Revenue Million Forecast, by Country 2019 & 2032
Frequently Asked Questions
1. What is the projected Compound Annual Growth Rate (CAGR) of the North America School Bus Industry?
The projected CAGR is approximately > 4.74%.
2. Which companies are prominent players in the North America School Bus Industry?
Key companies in the market include Navistar Inc, Lion Electric Compan, Blue Bird Corporation, Girardin Blue Bird, Starcraft Bus, Trans Tech, Collins Bus Corporation, Daimler AG (Thomas Built Buses).
3. What are the main segments of the North America School Bus Industry?
The market segments include Powertrain, Bus Type, Geography.
4. Can you provide details about the market size?
The market size is estimated to be USD 2.41 Million as of 2022.
5. What are some drivers contributing to market growth?
Increasing Demand For Electric School Buses.
6. What are the notable trends driving market growth?
The Industry’s Shift Toward the Adoption of Electric School Buses.
7. Are there any restraints impacting market growth?
Uncertainty of The Global Pandemic.
8. Can you provide examples of recent developments in the market?
October 2023: Blue Bird achieved a milestone by delivering its 1,500th electric, zero-emission school bus to Modesto City Schools in California. Recently, the company marked the inauguration of its Electric Vehicle (EV) Build-up Center in Georgia, aiming to boost its long-term production capacity to 5,000 electric school buses annually. This expansion underscores Blue Bird's commitment to advancing zero-emission school buses.
9. What pricing options are available for accessing the report?
Pricing options include single-user, multi-user, and enterprise licenses priced at USD 4750, USD 5250, and USD 8750 respectively.
10. Is the market size provided in terms of value or volume?
The market size is provided in terms of value, measured in Million.
11. Are there any specific market keywords associated with the report?
Yes, the market keyword associated with the report is "North America School Bus Industry," which aids in identifying and referencing the specific market segment covered.
12. How do I determine which pricing option suits my needs best?
The pricing options vary based on user requirements and access needs. Individual users may opt for single-user licenses, while businesses requiring broader access may choose multi-user or enterprise licenses for cost-effective access to the report.
13. Are there any additional resources or data provided in the North America School Bus Industry report?
While the report offers comprehensive insights, it's advisable to review the specific contents or supplementary materials provided to ascertain if additional resources or data are available.
14. How can I stay updated on further developments or reports in the North America School Bus Industry?
To stay informed about further developments, trends, and reports in the North America School Bus Industry, consider subscribing to industry newsletters, following relevant companies and organizations, or regularly checking reputable industry news sources and publications.
Methodology
Step 1 - Identification of Relevant Samples Size from Population Database


Step 2 - Approaches for Defining Global Market Size (Value, Volume* & Price*)

Note*: In applicable scenarios
Step 3 - Data Sources
Primary Research
- Web Analytics
- Survey Reports
- Research Institute
- Latest Research Reports
- Opinion Leaders
Secondary Research
- Annual Reports
- White Paper
- Latest Press Release
- Industry Association
- Paid Database
- Investor Presentations

Step 4 - Data Triangulation
Involves using different sources of information in order to increase the validity of a study
These sources are likely to be stakeholders in a program - participants, other researchers, program staff, other community members, and so on.
Then we put all data in single framework & apply various statistical tools to find out the dynamic on the market.
During the analysis stage, feedback from the stakeholder groups would be compared to determine areas of agreement as well as areas of divergence
