

Key Insights
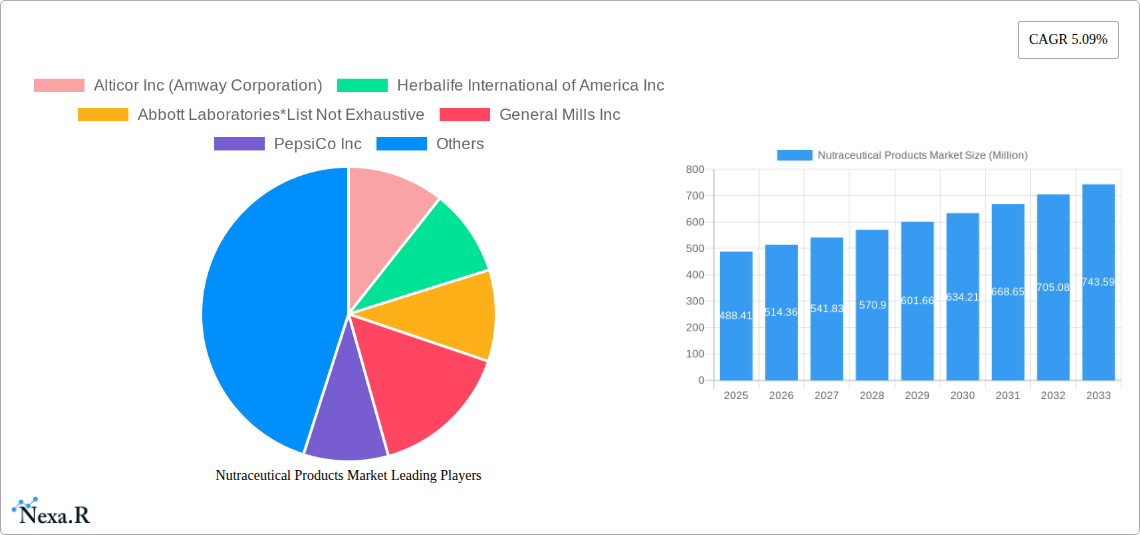
The global nutraceutical products market, valued at $488.41 million in 2025, is projected to experience robust growth, driven by increasing health consciousness among consumers and a rising prevalence of chronic diseases. This expanding market is segmented by product type (functional foods, functional beverages, dietary supplements) and distribution channels (specialty stores, supermarkets/hypermarkets, convenience stores, drug stores/pharmacies, online retail stores). The significant growth is fueled by the rising demand for convenient and effective health solutions, coupled with increased consumer spending on preventative healthcare. Key players like Abbott Laboratories, Nestle, PepsiCo, and Herbalife International are capitalizing on these trends, investing in research and development, and expanding their product portfolios to cater to diverse consumer needs and preferences across various regions. The market’s growth is further propelled by rising disposable incomes, particularly in emerging economies like India and China, leading to increased purchasing power and higher consumption of nutraceuticals. However, challenges remain, including stringent regulations regarding product labeling and safety concerns, which may slightly restrain growth. The competitive landscape is intense, with both established players and emerging brands vying for market share through product innovation, strategic partnerships, and aggressive marketing strategies.
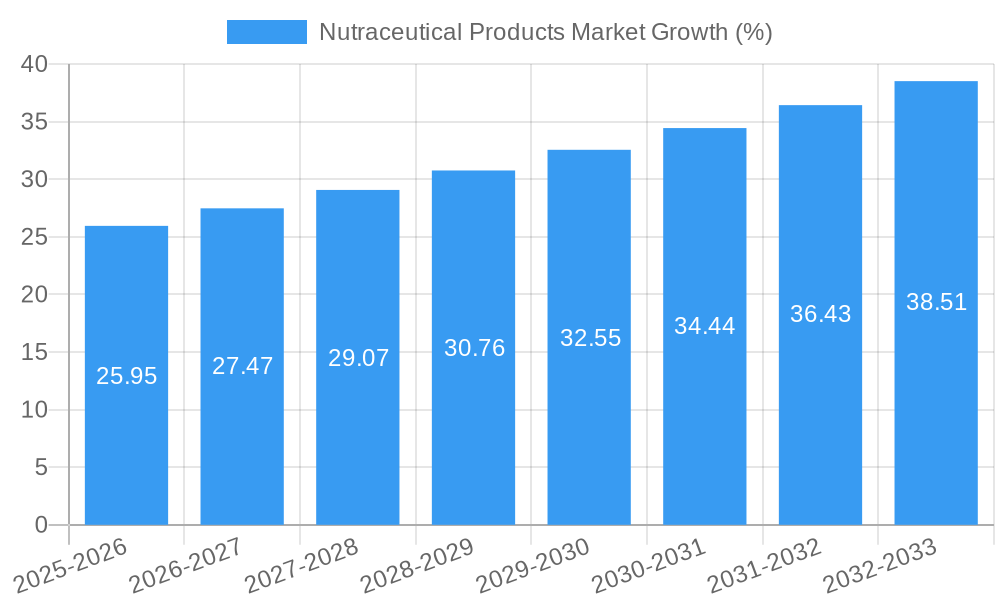
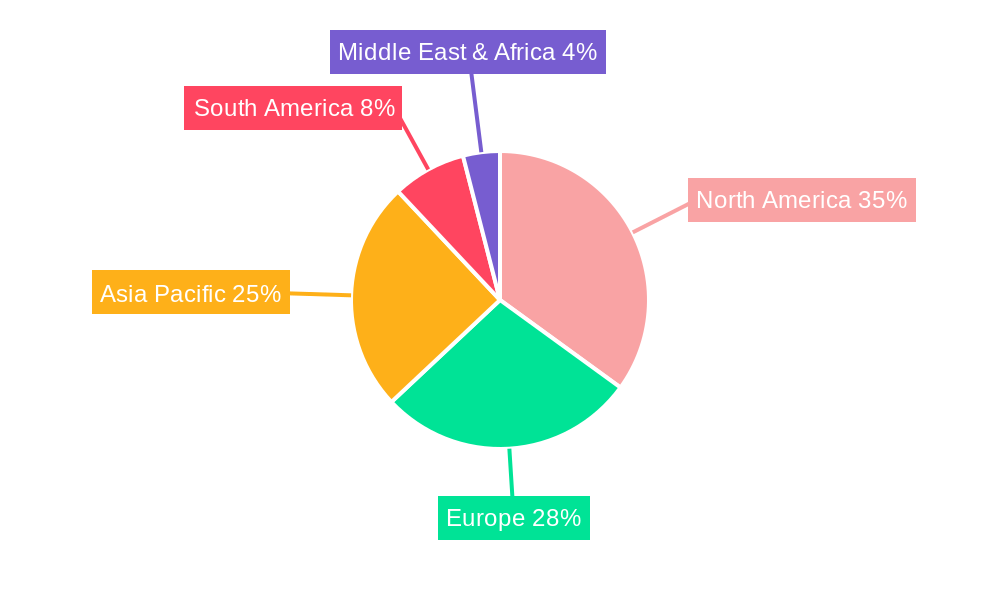
The North American market currently holds a significant share, largely driven by high consumer awareness and readily available distribution channels. However, the Asia-Pacific region is expected to witness the most rapid growth in the forecast period (2025-2033), fueled by increasing disposable incomes and growing health concerns in developing countries within the region. Europe also presents a substantial market opportunity, with a strong focus on preventative healthcare and a well-established nutraceutical industry. The market's future growth trajectory will depend on factors such as technological advancements in product formulation, increasing scientific evidence supporting the efficacy of nutraceuticals, and sustained investment in research and development by major players to enhance product quality and expand into newer markets. Government regulations and public health campaigns promoting healthy lifestyles will also play a significant role in shaping the market's future. Projected growth, considering the CAGR of 5.09%, indicates substantial expansion in the coming years.
Nutraceutical Products Market: A Comprehensive Market Report (2019-2033)
This comprehensive report provides an in-depth analysis of the Nutraceutical Products market, encompassing its dynamics, growth trends, regional dominance, product landscape, challenges, opportunities, and key players. The study period covers 2019-2033, with 2025 as the base and estimated year. The report forecasts market trends from 2025-2033, analyzing historical data from 2019-2024. The market is segmented by product type (Functional Food, Functional Beverage, Dietary Supplements) and distribution channel (Specialty Stores, Supermarkets/Hypermarkets, Convenience Stores, Drug Stores/Pharmacies, Online Retail Stores, Other Distribution Channels). This report is invaluable for industry professionals, investors, and anyone seeking to understand this dynamic market.
Nutraceutical Products Market Market Dynamics & Structure
The nutraceutical market is characterized by moderate concentration, with several large players and numerous smaller niche companies. Technological innovation, particularly in formulation and delivery systems, is a key driver. Regulatory frameworks vary significantly across geographies, impacting market access and product development. Competitive substitutes include conventional foods and pharmaceuticals. The end-user demographic is broad, spanning across age groups and health concerns. M&A activity is significant, with larger players acquiring smaller companies to expand their product portfolios and market reach.
- Market Concentration: Moderately concentrated, with top 5 players holding approximately xx% market share in 2024.
- Technological Innovation: Focus on personalized nutrition, advanced delivery systems (e.g., liposomes, nanotechnology), and functional ingredients.
- Regulatory Landscape: Varies significantly across regions; impacting product approvals and labeling requirements.
- Competitive Substitutes: Conventional foods, pharmaceuticals, and over-the-counter medications.
- End-User Demographics: Diverse, ranging from health-conscious individuals to those with specific dietary needs or medical conditions.
- M&A Activity: Significant in recent years, with approximately xx deals valued at xx Million USD in 2024.
Nutraceutical Products Market Growth Trends & Insights
The global nutraceutical products market is experiencing robust growth, driven by increasing health awareness, rising disposable incomes, and changing consumer lifestyles. The market size reached xx Million units in 2024 and is projected to reach xx Million units by 2033, exhibiting a CAGR of xx% during the forecast period (2025-2033). Technological advancements, such as personalized nutrition and innovative delivery systems, are further accelerating market growth. Consumer behavior is shifting toward preventative healthcare, fueling demand for nutraceuticals. Market penetration is highest in developed regions, but emerging economies are showing significant growth potential.
Dominant Regions, Countries, or Segments in Nutraceutical Products Market
North America currently holds the largest market share within the nutraceutical sector, followed by Europe and Asia-Pacific. Within product types, dietary supplements dominate the market, followed by functional foods and functional beverages. The leading distribution channel is supermarkets/hypermarkets, offering convenience and wide reach to consumers.
- Key Drivers (North America): High health awareness, strong regulatory framework, and substantial consumer spending on health and wellness products.
- Key Drivers (Europe): Growing demand for natural and organic products, coupled with government initiatives promoting healthy lifestyles.
- Key Drivers (Asia-Pacific): Rising disposable incomes, increasing prevalence of chronic diseases, and expanding distribution networks.
- Product Type Dominance: Dietary supplements account for xx% of market share due to their targeted health benefits.
- Distribution Channel Dominance: Supermarkets/hypermarkets offer broad reach and established infrastructure, leading to highest market share.
Nutraceutical Products Market Product Landscape
The nutraceutical product landscape is constantly evolving, with new product innovations and improved formulations catering to diverse consumer needs. Recent trends focus on personalized nutrition, clean label ingredients, and enhanced bioavailability. Specific product innovations include targeted supplements for specific health issues, functional foods integrated into daily meals, and enhanced delivery systems for improved absorption. The focus is shifting towards delivering scientifically proven health benefits with superior taste and convenience.
Key Drivers, Barriers & Challenges in Nutraceutical Products Market
Key Drivers:
- Increasing health consciousness and preventative healthcare trends.
- Growing prevalence of chronic diseases.
- Rising disposable incomes in developing economies.
- Technological advancements in formulation and delivery systems.
Challenges & Restraints:
- Stringent regulatory requirements and varying standards across different regions.
- Concerns about product safety, efficacy, and quality control.
- Intense competition among established and emerging players.
- Supply chain complexities and price fluctuations of raw materials.
Emerging Opportunities in Nutraceutical Products Market
- Growing demand for personalized nutrition and customized supplements.
- Expanding markets for sports nutrition and weight management products.
- Development of novel delivery systems for enhanced bioavailability.
- Increasing focus on natural and organic ingredients.
- Rise in the popularity of functional foods and beverages.
Growth Accelerators in the Nutraceutical Products Market Industry
Strategic partnerships between nutraceutical companies and healthcare providers can create new distribution channels and expand market reach. Technological advancements like personalized nutrition and innovative delivery systems are driving product innovation and differentiation. Market expansion into emerging economies, especially in Asia-Pacific and Latin America, offers significant growth potential.
Key Players Shaping the Nutraceutical Products Market Market
- Alticor Inc (Amway Corporation)
- Herbalife International of America Inc
- Abbott Laboratories
- General Mills Inc
- PepsiCo Inc
- Red Bull GmbH
- Danone S A
- Now Health Group Inc (NOW Foods)
- Kellogg Company
- Nestlé S A
Notable Milestones in Nutraceutical Products Market Sector
- June 2022: Kellogg's Special K launched new protein snack bars, expanding its presence in the convenient, on-the-go snack market.
- February 2022: PepsiCo's Rockstar Energy introduced a hemp-infused drink, tapping into growing consumer interest in functional and low-sugar beverages.
- April 2021: Nestlé NIDO 3+ reformulated its product to address specific micronutrient deficiencies in children, showcasing a commitment to tailored nutrition solutions.
In-Depth Nutraceutical Products Market Market Outlook
The nutraceutical market is poised for continued growth, driven by evolving consumer preferences, technological innovations, and increasing health awareness. Strategic partnerships, expansion into new markets, and personalized nutrition will be key drivers. Companies focused on product innovation, strong R&D, and effective distribution strategies are well-positioned for success in this dynamic market. The market holds significant potential for further expansion, particularly in developing countries and through advancements in personalized nutrition solutions.
Nutraceutical Products Market Segmentation
-
1. Product Type
-
1.1. Functional Food
- 1.1.1. Cereal
- 1.1.2. Bakery and Confectionary
- 1.1.3. Dairy
- 1.1.4. Snack
- 1.1.5. Other Functional Foods
-
1.2. Functional Beverage
- 1.2.1. Energy Drink
- 1.2.2. Sports Drink
- 1.2.3. Fortified Juice
- 1.2.4. Dairy and Dairy Alternative Beverage
- 1.2.5. Other Functional Beverages
-
1.3. Dietary Supplements
- 1.3.1. Vitamins
- 1.3.2. Minerals
- 1.3.3. Botanicals
- 1.3.4. Enzyme
- 1.3.5. Fatty Acids
- 1.3.6. Proteins
- 1.3.7. Other Dietary Supplements
-
1.1. Functional Food
-
2. Distribution Channel
- 2.1. Specialty Stores
- 2.2. Supermarkets/Hypermarkets
- 2.3. Convenience Stores
- 2.4. Drug Stores/Pharmacies
- 2.5. Online Retail Stores
- 2.6. Other Distribution Channels
Nutraceutical Products Market Segmentation By Geography
-
1. North America
- 1.1. United States
- 1.2. Canada
- 1.3. Mexico
- 1.4. Rest of North America
-
2. Europe
- 2.1. Germany
- 2.2. United Kingdom
- 2.3. France
- 2.4. Sweden
- 2.5. Spain
- 2.6. Italy
- 2.7. Russia
- 2.8. Rest of Europe
-
3. Asia Pacific
- 3.1. China
- 3.2. Japan
- 3.3. India
- 3.4. Australia
- 3.5. Rest of Asia Pacific
-
4. South America
- 4.1. Brazil
- 4.2. Argentina
- 4.3. Rest of South America
- 5. Middle East
-
6. South Africa
- 6.1. United Arab Emirates
- 6.2. Rest of Middle East
Nutraceutical Products Market REPORT HIGHLIGHTS
| Aspects | Details |
|---|---|
| Study Period | 2019-2033 |
| Base Year | 2024 |
| Estimated Year | 2025 |
| Forecast Period | 2025-2033 |
| Historical Period | 2019-2024 |
| Growth Rate | CAGR of 5.09% from 2019-2033 |
| Segmentation |
|
Table of Contents
- 1. Introduction
- 1.1. Research Scope
- 1.2. Market Segmentation
- 1.3. Research Methodology
- 1.4. Definitions and Assumptions
- 2. Executive Summary
- 2.1. Introduction
- 3. Market Dynamics
- 3.1. Introduction
- 3.2. Market Drivers
- 3.2.1. Popularity of On-the-Go Snacking Options; Trend Of Clean Label and Plant-Based Bars
- 3.3. Market Restrains
- 3.3.1. Availability of Counterfeit Products
- 3.4. Market Trends
- 3.4.1. Increased Demand From Healthy & Functional Foods
- 4. Market Factor Analysis
- 4.1. Porters Five Forces
- 4.2. Supply/Value Chain
- 4.3. PESTEL analysis
- 4.4. Market Entropy
- 4.5. Patent/Trademark Analysis
- 5. Global Nutraceutical Products Market Analysis, Insights and Forecast, 2019-2031
- 5.1. Market Analysis, Insights and Forecast - by Product Type
- 5.1.1. Functional Food
- 5.1.1.1. Cereal
- 5.1.1.2. Bakery and Confectionary
- 5.1.1.3. Dairy
- 5.1.1.4. Snack
- 5.1.1.5. Other Functional Foods
- 5.1.2. Functional Beverage
- 5.1.2.1. Energy Drink
- 5.1.2.2. Sports Drink
- 5.1.2.3. Fortified Juice
- 5.1.2.4. Dairy and Dairy Alternative Beverage
- 5.1.2.5. Other Functional Beverages
- 5.1.3. Dietary Supplements
- 5.1.3.1. Vitamins
- 5.1.3.2. Minerals
- 5.1.3.3. Botanicals
- 5.1.3.4. Enzyme
- 5.1.3.5. Fatty Acids
- 5.1.3.6. Proteins
- 5.1.3.7. Other Dietary Supplements
- 5.1.1. Functional Food
- 5.2. Market Analysis, Insights and Forecast - by Distribution Channel
- 5.2.1. Specialty Stores
- 5.2.2. Supermarkets/Hypermarkets
- 5.2.3. Convenience Stores
- 5.2.4. Drug Stores/Pharmacies
- 5.2.5. Online Retail Stores
- 5.2.6. Other Distribution Channels
- 5.3. Market Analysis, Insights and Forecast - by Region
- 5.3.1. North America
- 5.3.2. Europe
- 5.3.3. Asia Pacific
- 5.3.4. South America
- 5.3.5. Middle East
- 5.3.6. South Africa
- 5.1. Market Analysis, Insights and Forecast - by Product Type
- 6. North America Nutraceutical Products Market Analysis, Insights and Forecast, 2019-2031
- 6.1. Market Analysis, Insights and Forecast - by Product Type
- 6.1.1. Functional Food
- 6.1.1.1. Cereal
- 6.1.1.2. Bakery and Confectionary
- 6.1.1.3. Dairy
- 6.1.1.4. Snack
- 6.1.1.5. Other Functional Foods
- 6.1.2. Functional Beverage
- 6.1.2.1. Energy Drink
- 6.1.2.2. Sports Drink
- 6.1.2.3. Fortified Juice
- 6.1.2.4. Dairy and Dairy Alternative Beverage
- 6.1.2.5. Other Functional Beverages
- 6.1.3. Dietary Supplements
- 6.1.3.1. Vitamins
- 6.1.3.2. Minerals
- 6.1.3.3. Botanicals
- 6.1.3.4. Enzyme
- 6.1.3.5. Fatty Acids
- 6.1.3.6. Proteins
- 6.1.3.7. Other Dietary Supplements
- 6.1.1. Functional Food
- 6.2. Market Analysis, Insights and Forecast - by Distribution Channel
- 6.2.1. Specialty Stores
- 6.2.2. Supermarkets/Hypermarkets
- 6.2.3. Convenience Stores
- 6.2.4. Drug Stores/Pharmacies
- 6.2.5. Online Retail Stores
- 6.2.6. Other Distribution Channels
- 6.1. Market Analysis, Insights and Forecast - by Product Type
- 7. Europe Nutraceutical Products Market Analysis, Insights and Forecast, 2019-2031
- 7.1. Market Analysis, Insights and Forecast - by Product Type
- 7.1.1. Functional Food
- 7.1.1.1. Cereal
- 7.1.1.2. Bakery and Confectionary
- 7.1.1.3. Dairy
- 7.1.1.4. Snack
- 7.1.1.5. Other Functional Foods
- 7.1.2. Functional Beverage
- 7.1.2.1. Energy Drink
- 7.1.2.2. Sports Drink
- 7.1.2.3. Fortified Juice
- 7.1.2.4. Dairy and Dairy Alternative Beverage
- 7.1.2.5. Other Functional Beverages
- 7.1.3. Dietary Supplements
- 7.1.3.1. Vitamins
- 7.1.3.2. Minerals
- 7.1.3.3. Botanicals
- 7.1.3.4. Enzyme
- 7.1.3.5. Fatty Acids
- 7.1.3.6. Proteins
- 7.1.3.7. Other Dietary Supplements
- 7.1.1. Functional Food
- 7.2. Market Analysis, Insights and Forecast - by Distribution Channel
- 7.2.1. Specialty Stores
- 7.2.2. Supermarkets/Hypermarkets
- 7.2.3. Convenience Stores
- 7.2.4. Drug Stores/Pharmacies
- 7.2.5. Online Retail Stores
- 7.2.6. Other Distribution Channels
- 7.1. Market Analysis, Insights and Forecast - by Product Type
- 8. Asia Pacific Nutraceutical Products Market Analysis, Insights and Forecast, 2019-2031
- 8.1. Market Analysis, Insights and Forecast - by Product Type
- 8.1.1. Functional Food
- 8.1.1.1. Cereal
- 8.1.1.2. Bakery and Confectionary
- 8.1.1.3. Dairy
- 8.1.1.4. Snack
- 8.1.1.5. Other Functional Foods
- 8.1.2. Functional Beverage
- 8.1.2.1. Energy Drink
- 8.1.2.2. Sports Drink
- 8.1.2.3. Fortified Juice
- 8.1.2.4. Dairy and Dairy Alternative Beverage
- 8.1.2.5. Other Functional Beverages
- 8.1.3. Dietary Supplements
- 8.1.3.1. Vitamins
- 8.1.3.2. Minerals
- 8.1.3.3. Botanicals
- 8.1.3.4. Enzyme
- 8.1.3.5. Fatty Acids
- 8.1.3.6. Proteins
- 8.1.3.7. Other Dietary Supplements
- 8.1.1. Functional Food
- 8.2. Market Analysis, Insights and Forecast - by Distribution Channel
- 8.2.1. Specialty Stores
- 8.2.2. Supermarkets/Hypermarkets
- 8.2.3. Convenience Stores
- 8.2.4. Drug Stores/Pharmacies
- 8.2.5. Online Retail Stores
- 8.2.6. Other Distribution Channels
- 8.1. Market Analysis, Insights and Forecast - by Product Type
- 9. South America Nutraceutical Products Market Analysis, Insights and Forecast, 2019-2031
- 9.1. Market Analysis, Insights and Forecast - by Product Type
- 9.1.1. Functional Food
- 9.1.1.1. Cereal
- 9.1.1.2. Bakery and Confectionary
- 9.1.1.3. Dairy
- 9.1.1.4. Snack
- 9.1.1.5. Other Functional Foods
- 9.1.2. Functional Beverage
- 9.1.2.1. Energy Drink
- 9.1.2.2. Sports Drink
- 9.1.2.3. Fortified Juice
- 9.1.2.4. Dairy and Dairy Alternative Beverage
- 9.1.2.5. Other Functional Beverages
- 9.1.3. Dietary Supplements
- 9.1.3.1. Vitamins
- 9.1.3.2. Minerals
- 9.1.3.3. Botanicals
- 9.1.3.4. Enzyme
- 9.1.3.5. Fatty Acids
- 9.1.3.6. Proteins
- 9.1.3.7. Other Dietary Supplements
- 9.1.1. Functional Food
- 9.2. Market Analysis, Insights and Forecast - by Distribution Channel
- 9.2.1. Specialty Stores
- 9.2.2. Supermarkets/Hypermarkets
- 9.2.3. Convenience Stores
- 9.2.4. Drug Stores/Pharmacies
- 9.2.5. Online Retail Stores
- 9.2.6. Other Distribution Channels
- 9.1. Market Analysis, Insights and Forecast - by Product Type
- 10. Middle East Nutraceutical Products Market Analysis, Insights and Forecast, 2019-2031
- 10.1. Market Analysis, Insights and Forecast - by Product Type
- 10.1.1. Functional Food
- 10.1.1.1. Cereal
- 10.1.1.2. Bakery and Confectionary
- 10.1.1.3. Dairy
- 10.1.1.4. Snack
- 10.1.1.5. Other Functional Foods
- 10.1.2. Functional Beverage
- 10.1.2.1. Energy Drink
- 10.1.2.2. Sports Drink
- 10.1.2.3. Fortified Juice
- 10.1.2.4. Dairy and Dairy Alternative Beverage
- 10.1.2.5. Other Functional Beverages
- 10.1.3. Dietary Supplements
- 10.1.3.1. Vitamins
- 10.1.3.2. Minerals
- 10.1.3.3. Botanicals
- 10.1.3.4. Enzyme
- 10.1.3.5. Fatty Acids
- 10.1.3.6. Proteins
- 10.1.3.7. Other Dietary Supplements
- 10.1.1. Functional Food
- 10.2. Market Analysis, Insights and Forecast - by Distribution Channel
- 10.2.1. Specialty Stores
- 10.2.2. Supermarkets/Hypermarkets
- 10.2.3. Convenience Stores
- 10.2.4. Drug Stores/Pharmacies
- 10.2.5. Online Retail Stores
- 10.2.6. Other Distribution Channels
- 10.1. Market Analysis, Insights and Forecast - by Product Type
- 11. South Africa Nutraceutical Products Market Analysis, Insights and Forecast, 2019-2031
- 11.1. Market Analysis, Insights and Forecast - by Product Type
- 11.1.1. Functional Food
- 11.1.1.1. Cereal
- 11.1.1.2. Bakery and Confectionary
- 11.1.1.3. Dairy
- 11.1.1.4. Snack
- 11.1.1.5. Other Functional Foods
- 11.1.2. Functional Beverage
- 11.1.2.1. Energy Drink
- 11.1.2.2. Sports Drink
- 11.1.2.3. Fortified Juice
- 11.1.2.4. Dairy and Dairy Alternative Beverage
- 11.1.2.5. Other Functional Beverages
- 11.1.3. Dietary Supplements
- 11.1.3.1. Vitamins
- 11.1.3.2. Minerals
- 11.1.3.3. Botanicals
- 11.1.3.4. Enzyme
- 11.1.3.5. Fatty Acids
- 11.1.3.6. Proteins
- 11.1.3.7. Other Dietary Supplements
- 11.1.1. Functional Food
- 11.2. Market Analysis, Insights and Forecast - by Distribution Channel
- 11.2.1. Specialty Stores
- 11.2.2. Supermarkets/Hypermarkets
- 11.2.3. Convenience Stores
- 11.2.4. Drug Stores/Pharmacies
- 11.2.5. Online Retail Stores
- 11.2.6. Other Distribution Channels
- 11.1. Market Analysis, Insights and Forecast - by Product Type
- 12. North America Nutraceutical Products Market Analysis, Insights and Forecast, 2019-2031
- 12.1. Market Analysis, Insights and Forecast - By Country/Sub-region
- 12.1.1 United States
- 12.1.2 Canada
- 12.1.3 Mexico
- 12.1.4 Rest of North America
- 13. Europe Nutraceutical Products Market Analysis, Insights and Forecast, 2019-2031
- 13.1. Market Analysis, Insights and Forecast - By Country/Sub-region
- 13.1.1 Germany
- 13.1.2 United Kingdom
- 13.1.3 France
- 13.1.4 Sweden
- 13.1.5 Spain
- 13.1.6 Italy
- 13.1.7 Russia
- 13.1.8 Rest of Europe
- 14. Asia Pacific Nutraceutical Products Market Analysis, Insights and Forecast, 2019-2031
- 14.1. Market Analysis, Insights and Forecast - By Country/Sub-region
- 14.1.1 China
- 14.1.2 Japan
- 14.1.3 India
- 14.1.4 Australia
- 14.1.5 Rest of Asia Pacific
- 15. South America Nutraceutical Products Market Analysis, Insights and Forecast, 2019-2031
- 15.1. Market Analysis, Insights and Forecast - By Country/Sub-region
- 15.1.1 Brazil
- 15.1.2 Argentina
- 15.1.3 Rest of South America
- 16. Middle East Nutraceutical Products Market Analysis, Insights and Forecast, 2019-2031
- 16.1. Market Analysis, Insights and Forecast - By Country/Sub-region
- 16.1.1.
- 17. South Africa Nutraceutical Products Market Analysis, Insights and Forecast, 2019-2031
- 17.1. Market Analysis, Insights and Forecast - By Country/Sub-region
- 17.1.1 United Arab Emirates
- 17.1.2 Rest of Middle East
- 18. Competitive Analysis
- 18.1. Global Market Share Analysis 2024
- 18.2. Company Profiles
- 18.2.1 Alticor Inc (Amway Corporation)
- 18.2.1.1. Overview
- 18.2.1.2. Products
- 18.2.1.3. SWOT Analysis
- 18.2.1.4. Recent Developments
- 18.2.1.5. Financials (Based on Availability)
- 18.2.2 Herbalife International of America Inc
- 18.2.2.1. Overview
- 18.2.2.2. Products
- 18.2.2.3. SWOT Analysis
- 18.2.2.4. Recent Developments
- 18.2.2.5. Financials (Based on Availability)
- 18.2.3 Abbott Laboratories*List Not Exhaustive
- 18.2.3.1. Overview
- 18.2.3.2. Products
- 18.2.3.3. SWOT Analysis
- 18.2.3.4. Recent Developments
- 18.2.3.5. Financials (Based on Availability)
- 18.2.4 General Mills Inc
- 18.2.4.1. Overview
- 18.2.4.2. Products
- 18.2.4.3. SWOT Analysis
- 18.2.4.4. Recent Developments
- 18.2.4.5. Financials (Based on Availability)
- 18.2.5 PepsiCo Inc
- 18.2.5.1. Overview
- 18.2.5.2. Products
- 18.2.5.3. SWOT Analysis
- 18.2.5.4. Recent Developments
- 18.2.5.5. Financials (Based on Availability)
- 18.2.6 Red Bull GmbH
- 18.2.6.1. Overview
- 18.2.6.2. Products
- 18.2.6.3. SWOT Analysis
- 18.2.6.4. Recent Developments
- 18.2.6.5. Financials (Based on Availability)
- 18.2.7 Danone S A
- 18.2.7.1. Overview
- 18.2.7.2. Products
- 18.2.7.3. SWOT Analysis
- 18.2.7.4. Recent Developments
- 18.2.7.5. Financials (Based on Availability)
- 18.2.8 Now Health Group Inc (NOW Foods)
- 18.2.8.1. Overview
- 18.2.8.2. Products
- 18.2.8.3. SWOT Analysis
- 18.2.8.4. Recent Developments
- 18.2.8.5. Financials (Based on Availability)
- 18.2.9 Kellogg Company
- 18.2.9.1. Overview
- 18.2.9.2. Products
- 18.2.9.3. SWOT Analysis
- 18.2.9.4. Recent Developments
- 18.2.9.5. Financials (Based on Availability)
- 18.2.10 Nestlé S A
- 18.2.10.1. Overview
- 18.2.10.2. Products
- 18.2.10.3. SWOT Analysis
- 18.2.10.4. Recent Developments
- 18.2.10.5. Financials (Based on Availability)
- 18.2.1 Alticor Inc (Amway Corporation)
List of Figures
- Figure 1: Global Nutraceutical Products Market Revenue Breakdown (Million, %) by Region 2024 & 2032
- Figure 2: North America Nutraceutical Products Market Revenue (Million), by Country 2024 & 2032
- Figure 3: North America Nutraceutical Products Market Revenue Share (%), by Country 2024 & 2032
- Figure 4: Europe Nutraceutical Products Market Revenue (Million), by Country 2024 & 2032
- Figure 5: Europe Nutraceutical Products Market Revenue Share (%), by Country 2024 & 2032
- Figure 6: Asia Pacific Nutraceutical Products Market Revenue (Million), by Country 2024 & 2032
- Figure 7: Asia Pacific Nutraceutical Products Market Revenue Share (%), by Country 2024 & 2032
- Figure 8: South America Nutraceutical Products Market Revenue (Million), by Country 2024 & 2032
- Figure 9: South America Nutraceutical Products Market Revenue Share (%), by Country 2024 & 2032
- Figure 10: Middle East Nutraceutical Products Market Revenue (Million), by Country 2024 & 2032
- Figure 11: Middle East Nutraceutical Products Market Revenue Share (%), by Country 2024 & 2032
- Figure 12: South Africa Nutraceutical Products Market Revenue (Million), by Country 2024 & 2032
- Figure 13: South Africa Nutraceutical Products Market Revenue Share (%), by Country 2024 & 2032
- Figure 14: North America Nutraceutical Products Market Revenue (Million), by Product Type 2024 & 2032
- Figure 15: North America Nutraceutical Products Market Revenue Share (%), by Product Type 2024 & 2032
- Figure 16: North America Nutraceutical Products Market Revenue (Million), by Distribution Channel 2024 & 2032
- Figure 17: North America Nutraceutical Products Market Revenue Share (%), by Distribution Channel 2024 & 2032
- Figure 18: North America Nutraceutical Products Market Revenue (Million), by Country 2024 & 2032
- Figure 19: North America Nutraceutical Products Market Revenue Share (%), by Country 2024 & 2032
- Figure 20: Europe Nutraceutical Products Market Revenue (Million), by Product Type 2024 & 2032
- Figure 21: Europe Nutraceutical Products Market Revenue Share (%), by Product Type 2024 & 2032
- Figure 22: Europe Nutraceutical Products Market Revenue (Million), by Distribution Channel 2024 & 2032
- Figure 23: Europe Nutraceutical Products Market Revenue Share (%), by Distribution Channel 2024 & 2032
- Figure 24: Europe Nutraceutical Products Market Revenue (Million), by Country 2024 & 2032
- Figure 25: Europe Nutraceutical Products Market Revenue Share (%), by Country 2024 & 2032
- Figure 26: Asia Pacific Nutraceutical Products Market Revenue (Million), by Product Type 2024 & 2032
- Figure 27: Asia Pacific Nutraceutical Products Market Revenue Share (%), by Product Type 2024 & 2032
- Figure 28: Asia Pacific Nutraceutical Products Market Revenue (Million), by Distribution Channel 2024 & 2032
- Figure 29: Asia Pacific Nutraceutical Products Market Revenue Share (%), by Distribution Channel 2024 & 2032
- Figure 30: Asia Pacific Nutraceutical Products Market Revenue (Million), by Country 2024 & 2032
- Figure 31: Asia Pacific Nutraceutical Products Market Revenue Share (%), by Country 2024 & 2032
- Figure 32: South America Nutraceutical Products Market Revenue (Million), by Product Type 2024 & 2032
- Figure 33: South America Nutraceutical Products Market Revenue Share (%), by Product Type 2024 & 2032
- Figure 34: South America Nutraceutical Products Market Revenue (Million), by Distribution Channel 2024 & 2032
- Figure 35: South America Nutraceutical Products Market Revenue Share (%), by Distribution Channel 2024 & 2032
- Figure 36: South America Nutraceutical Products Market Revenue (Million), by Country 2024 & 2032
- Figure 37: South America Nutraceutical Products Market Revenue Share (%), by Country 2024 & 2032
- Figure 38: Middle East Nutraceutical Products Market Revenue (Million), by Product Type 2024 & 2032
- Figure 39: Middle East Nutraceutical Products Market Revenue Share (%), by Product Type 2024 & 2032
- Figure 40: Middle East Nutraceutical Products Market Revenue (Million), by Distribution Channel 2024 & 2032
- Figure 41: Middle East Nutraceutical Products Market Revenue Share (%), by Distribution Channel 2024 & 2032
- Figure 42: Middle East Nutraceutical Products Market Revenue (Million), by Country 2024 & 2032
- Figure 43: Middle East Nutraceutical Products Market Revenue Share (%), by Country 2024 & 2032
- Figure 44: South Africa Nutraceutical Products Market Revenue (Million), by Product Type 2024 & 2032
- Figure 45: South Africa Nutraceutical Products Market Revenue Share (%), by Product Type 2024 & 2032
- Figure 46: South Africa Nutraceutical Products Market Revenue (Million), by Distribution Channel 2024 & 2032
- Figure 47: South Africa Nutraceutical Products Market Revenue Share (%), by Distribution Channel 2024 & 2032
- Figure 48: South Africa Nutraceutical Products Market Revenue (Million), by Country 2024 & 2032
- Figure 49: South Africa Nutraceutical Products Market Revenue Share (%), by Country 2024 & 2032
List of Tables
- Table 1: Global Nutraceutical Products Market Revenue Million Forecast, by Region 2019 & 2032
- Table 2: Global Nutraceutical Products Market Revenue Million Forecast, by Product Type 2019 & 2032
- Table 3: Global Nutraceutical Products Market Revenue Million Forecast, by Distribution Channel 2019 & 2032
- Table 4: Global Nutraceutical Products Market Revenue Million Forecast, by Region 2019 & 2032
- Table 5: Global Nutraceutical Products Market Revenue Million Forecast, by Country 2019 & 2032
- Table 6: United States Nutraceutical Products Market Revenue (Million) Forecast, by Application 2019 & 2032
- Table 7: Canada Nutraceutical Products Market Revenue (Million) Forecast, by Application 2019 & 2032
- Table 8: Mexico Nutraceutical Products Market Revenue (Million) Forecast, by Application 2019 & 2032
- Table 9: Rest of North America Nutraceutical Products Market Revenue (Million) Forecast, by Application 2019 & 2032
- Table 10: Global Nutraceutical Products Market Revenue Million Forecast, by Country 2019 & 2032
- Table 11: Germany Nutraceutical Products Market Revenue (Million) Forecast, by Application 2019 & 2032
- Table 12: United Kingdom Nutraceutical Products Market Revenue (Million) Forecast, by Application 2019 & 2032
- Table 13: France Nutraceutical Products Market Revenue (Million) Forecast, by Application 2019 & 2032
- Table 14: Sweden Nutraceutical Products Market Revenue (Million) Forecast, by Application 2019 & 2032
- Table 15: Spain Nutraceutical Products Market Revenue (Million) Forecast, by Application 2019 & 2032
- Table 16: Italy Nutraceutical Products Market Revenue (Million) Forecast, by Application 2019 & 2032
- Table 17: Russia Nutraceutical Products Market Revenue (Million) Forecast, by Application 2019 & 2032
- Table 18: Rest of Europe Nutraceutical Products Market Revenue (Million) Forecast, by Application 2019 & 2032
- Table 19: Global Nutraceutical Products Market Revenue Million Forecast, by Country 2019 & 2032
- Table 20: China Nutraceutical Products Market Revenue (Million) Forecast, by Application 2019 & 2032
- Table 21: Japan Nutraceutical Products Market Revenue (Million) Forecast, by Application 2019 & 2032
- Table 22: India Nutraceutical Products Market Revenue (Million) Forecast, by Application 2019 & 2032
- Table 23: Australia Nutraceutical Products Market Revenue (Million) Forecast, by Application 2019 & 2032
- Table 24: Rest of Asia Pacific Nutraceutical Products Market Revenue (Million) Forecast, by Application 2019 & 2032
- Table 25: Global Nutraceutical Products Market Revenue Million Forecast, by Country 2019 & 2032
- Table 26: Brazil Nutraceutical Products Market Revenue (Million) Forecast, by Application 2019 & 2032
- Table 27: Argentina Nutraceutical Products Market Revenue (Million) Forecast, by Application 2019 & 2032
- Table 28: Rest of South America Nutraceutical Products Market Revenue (Million) Forecast, by Application 2019 & 2032
- Table 29: Global Nutraceutical Products Market Revenue Million Forecast, by Country 2019 & 2032
- Table 30: Nutraceutical Products Market Revenue (Million) Forecast, by Application 2019 & 2032
- Table 31: Global Nutraceutical Products Market Revenue Million Forecast, by Country 2019 & 2032
- Table 32: United Arab Emirates Nutraceutical Products Market Revenue (Million) Forecast, by Application 2019 & 2032
- Table 33: Rest of Middle East Nutraceutical Products Market Revenue (Million) Forecast, by Application 2019 & 2032
- Table 34: Global Nutraceutical Products Market Revenue Million Forecast, by Product Type 2019 & 2032
- Table 35: Global Nutraceutical Products Market Revenue Million Forecast, by Distribution Channel 2019 & 2032
- Table 36: Global Nutraceutical Products Market Revenue Million Forecast, by Country 2019 & 2032
- Table 37: United States Nutraceutical Products Market Revenue (Million) Forecast, by Application 2019 & 2032
- Table 38: Canada Nutraceutical Products Market Revenue (Million) Forecast, by Application 2019 & 2032
- Table 39: Mexico Nutraceutical Products Market Revenue (Million) Forecast, by Application 2019 & 2032
- Table 40: Rest of North America Nutraceutical Products Market Revenue (Million) Forecast, by Application 2019 & 2032
- Table 41: Global Nutraceutical Products Market Revenue Million Forecast, by Product Type 2019 & 2032
- Table 42: Global Nutraceutical Products Market Revenue Million Forecast, by Distribution Channel 2019 & 2032
- Table 43: Global Nutraceutical Products Market Revenue Million Forecast, by Country 2019 & 2032
- Table 44: Germany Nutraceutical Products Market Revenue (Million) Forecast, by Application 2019 & 2032
- Table 45: United Kingdom Nutraceutical Products Market Revenue (Million) Forecast, by Application 2019 & 2032
- Table 46: France Nutraceutical Products Market Revenue (Million) Forecast, by Application 2019 & 2032
- Table 47: Sweden Nutraceutical Products Market Revenue (Million) Forecast, by Application 2019 & 2032
- Table 48: Spain Nutraceutical Products Market Revenue (Million) Forecast, by Application 2019 & 2032
- Table 49: Italy Nutraceutical Products Market Revenue (Million) Forecast, by Application 2019 & 2032
- Table 50: Russia Nutraceutical Products Market Revenue (Million) Forecast, by Application 2019 & 2032
- Table 51: Rest of Europe Nutraceutical Products Market Revenue (Million) Forecast, by Application 2019 & 2032
- Table 52: Global Nutraceutical Products Market Revenue Million Forecast, by Product Type 2019 & 2032
- Table 53: Global Nutraceutical Products Market Revenue Million Forecast, by Distribution Channel 2019 & 2032
- Table 54: Global Nutraceutical Products Market Revenue Million Forecast, by Country 2019 & 2032
- Table 55: China Nutraceutical Products Market Revenue (Million) Forecast, by Application 2019 & 2032
- Table 56: Japan Nutraceutical Products Market Revenue (Million) Forecast, by Application 2019 & 2032
- Table 57: India Nutraceutical Products Market Revenue (Million) Forecast, by Application 2019 & 2032
- Table 58: Australia Nutraceutical Products Market Revenue (Million) Forecast, by Application 2019 & 2032
- Table 59: Rest of Asia Pacific Nutraceutical Products Market Revenue (Million) Forecast, by Application 2019 & 2032
- Table 60: Global Nutraceutical Products Market Revenue Million Forecast, by Product Type 2019 & 2032
- Table 61: Global Nutraceutical Products Market Revenue Million Forecast, by Distribution Channel 2019 & 2032
- Table 62: Global Nutraceutical Products Market Revenue Million Forecast, by Country 2019 & 2032
- Table 63: Brazil Nutraceutical Products Market Revenue (Million) Forecast, by Application 2019 & 2032
- Table 64: Argentina Nutraceutical Products Market Revenue (Million) Forecast, by Application 2019 & 2032
- Table 65: Rest of South America Nutraceutical Products Market Revenue (Million) Forecast, by Application 2019 & 2032
- Table 66: Global Nutraceutical Products Market Revenue Million Forecast, by Product Type 2019 & 2032
- Table 67: Global Nutraceutical Products Market Revenue Million Forecast, by Distribution Channel 2019 & 2032
- Table 68: Global Nutraceutical Products Market Revenue Million Forecast, by Country 2019 & 2032
- Table 69: Global Nutraceutical Products Market Revenue Million Forecast, by Product Type 2019 & 2032
- Table 70: Global Nutraceutical Products Market Revenue Million Forecast, by Distribution Channel 2019 & 2032
- Table 71: Global Nutraceutical Products Market Revenue Million Forecast, by Country 2019 & 2032
- Table 72: United Arab Emirates Nutraceutical Products Market Revenue (Million) Forecast, by Application 2019 & 2032
- Table 73: Rest of Middle East Nutraceutical Products Market Revenue (Million) Forecast, by Application 2019 & 2032
Frequently Asked Questions
1. What is the projected Compound Annual Growth Rate (CAGR) of the Nutraceutical Products Market?
The projected CAGR is approximately 5.09%.
2. Which companies are prominent players in the Nutraceutical Products Market?
Key companies in the market include Alticor Inc (Amway Corporation), Herbalife International of America Inc, Abbott Laboratories*List Not Exhaustive, General Mills Inc, PepsiCo Inc, Red Bull GmbH, Danone S A, Now Health Group Inc (NOW Foods), Kellogg Company, Nestlé S A.
3. What are the main segments of the Nutraceutical Products Market?
The market segments include Product Type, Distribution Channel.
4. Can you provide details about the market size?
The market size is estimated to be USD 488.41 Million as of 2022.
5. What are some drivers contributing to market growth?
Popularity of On-the-Go Snacking Options; Trend Of Clean Label and Plant-Based Bars.
6. What are the notable trends driving market growth?
Increased Demand From Healthy & Functional Foods.
7. Are there any restraints impacting market growth?
Availability of Counterfeit Products.
8. Can you provide examples of recent developments in the market?
June 2022: Kellogg's Special K released new Protein Snack Bars containing 6 grams of protein and 90 calories. The snack bar is offered in two delectable flavors, sweet Berry Vanilla and rich chocolaty Brownie Sundae, and provides a simple on-the-go protein grab without compromising taste.
9. What pricing options are available for accessing the report?
Pricing options include single-user, multi-user, and enterprise licenses priced at USD 4750, USD 5250, and USD 8750 respectively.
10. Is the market size provided in terms of value or volume?
The market size is provided in terms of value, measured in Million.
11. Are there any specific market keywords associated with the report?
Yes, the market keyword associated with the report is "Nutraceutical Products Market," which aids in identifying and referencing the specific market segment covered.
12. How do I determine which pricing option suits my needs best?
The pricing options vary based on user requirements and access needs. Individual users may opt for single-user licenses, while businesses requiring broader access may choose multi-user or enterprise licenses for cost-effective access to the report.
13. Are there any additional resources or data provided in the Nutraceutical Products Market report?
While the report offers comprehensive insights, it's advisable to review the specific contents or supplementary materials provided to ascertain if additional resources or data are available.
14. How can I stay updated on further developments or reports in the Nutraceutical Products Market?
To stay informed about further developments, trends, and reports in the Nutraceutical Products Market, consider subscribing to industry newsletters, following relevant companies and organizations, or regularly checking reputable industry news sources and publications.
Methodology
Step 1 - Identification of Relevant Samples Size from Population Database


Step 2 - Approaches for Defining Global Market Size (Value, Volume* & Price*)

Note*: In applicable scenarios
Step 3 - Data Sources
Primary Research
- Web Analytics
- Survey Reports
- Research Institute
- Latest Research Reports
- Opinion Leaders
Secondary Research
- Annual Reports
- White Paper
- Latest Press Release
- Industry Association
- Paid Database
- Investor Presentations

Step 4 - Data Triangulation
Involves using different sources of information in order to increase the validity of a study
These sources are likely to be stakeholders in a program - participants, other researchers, program staff, other community members, and so on.
Then we put all data in single framework & apply various statistical tools to find out the dynamic on the market.
During the analysis stage, feedback from the stakeholder groups would be compared to determine areas of agreement as well as areas of divergence
