

Key Insights
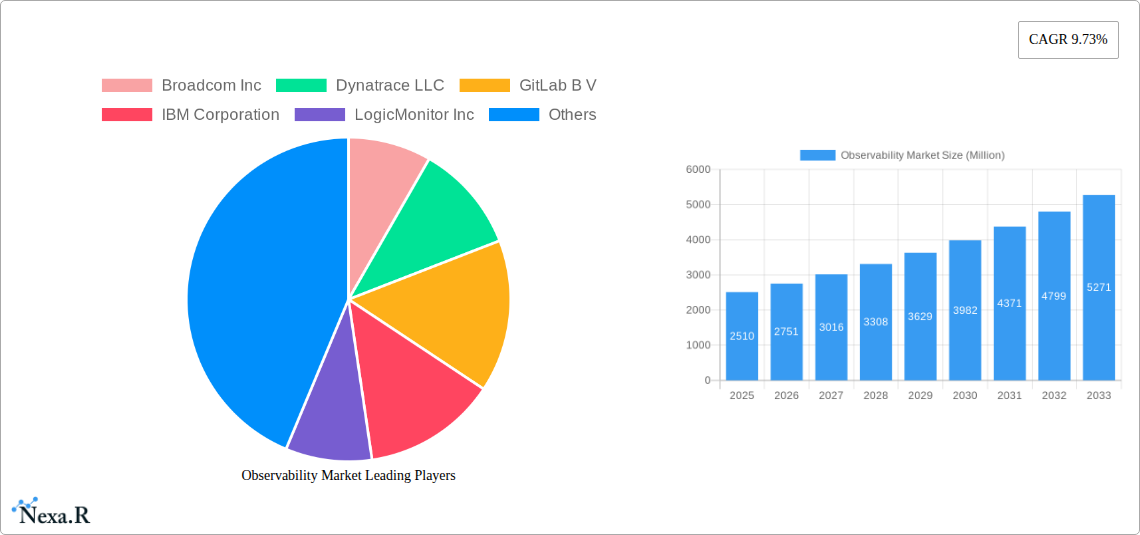
The global observability market, valued at $2.51 billion in 2025, is poised for significant growth, projected to expand at a Compound Annual Growth Rate (CAGR) of 9.73% from 2025 to 2033. This robust expansion is fueled by several key drivers. The increasing adoption of cloud-native architectures and microservices necessitates comprehensive monitoring and troubleshooting capabilities that observability platforms provide. Furthermore, the rising demand for real-time insights into application performance and user experience is pushing organizations to invest in advanced observability solutions. The growing complexity of IT infrastructure, coupled with the need for enhanced security and compliance, further accelerates market growth. Major players like Broadcom, Dynatrace, GitLab, IBM, and Splunk are actively shaping the market landscape through innovation and strategic acquisitions, contributing to the competitive intensity and fostering continuous improvement within the sector. The market is segmented by deployment type (cloud, on-premises), component (monitoring, tracing, logging), and organization size (SMEs, large enterprises), each segment exhibiting unique growth trajectories influenced by specific industry trends and adoption rates.
The forecast period of 2025-2033 is expected to witness a continued shift towards cloud-based observability solutions, driven by their scalability, cost-effectiveness, and ease of deployment. Moreover, the integration of artificial intelligence (AI) and machine learning (ML) into observability platforms is expected to enhance anomaly detection, predictive analysis, and automated remediation capabilities, significantly improving operational efficiency. However, challenges such as the complexity of implementing and managing observability tools, data security and privacy concerns, and the need for skilled professionals to effectively utilize these technologies are anticipated to act as potential restraints on market growth. Despite these challenges, the long-term outlook for the observability market remains highly positive, driven by sustained technological advancements and increasing digital transformation initiatives across various industries.
Observability Market: A Comprehensive Report (2019-2033)
This comprehensive report provides a detailed analysis of the Observability Market, encompassing market dynamics, growth trends, regional dominance, product landscape, key players, and future outlook. The study period covers 2019-2033, with 2025 as the base and estimated year. The forecast period spans 2025-2033, and the historical period includes 2019-2024. This report is crucial for industry professionals, investors, and stakeholders seeking a deep understanding of this rapidly evolving market. The total market size in 2025 is estimated to be xx Million.
Observability Market Dynamics & Structure
The Observability market is characterized by a moderately concentrated landscape, with several key players vying for market share. Technological innovation, driven by the increasing complexity of cloud-native applications and the rise of AI/ML, is a major force shaping market dynamics. Regulatory frameworks related to data privacy and security are also significant influencing factors. The market is witnessing strong M&A activity, indicating consolidation and strategic expansion within the sector. Competitive product substitutes include traditional monitoring tools, but observability platforms offer superior capabilities in terms of context, correlation, and proactive insights. End-users predominantly include large enterprises across diverse industries, particularly those heavily reliant on cloud infrastructure and microservices.
- Market Concentration: Moderately concentrated, with the top 5 players holding an estimated xx% market share in 2025.
- Technological Innovation: AI/ML integration, advancements in distributed tracing, and the emergence of new data formats drive innovation.
- Regulatory Frameworks: GDPR, CCPA, and other data privacy regulations influence data handling practices and vendor selection.
- M&A Activity: xx M&A deals were recorded in the past five years, with an increasing trend observed in recent times. This is leading to increased market consolidation.
- Innovation Barriers: High initial investment costs, integration complexities, and the need for skilled personnel can hinder innovation.
Observability Market Growth Trends & Insights
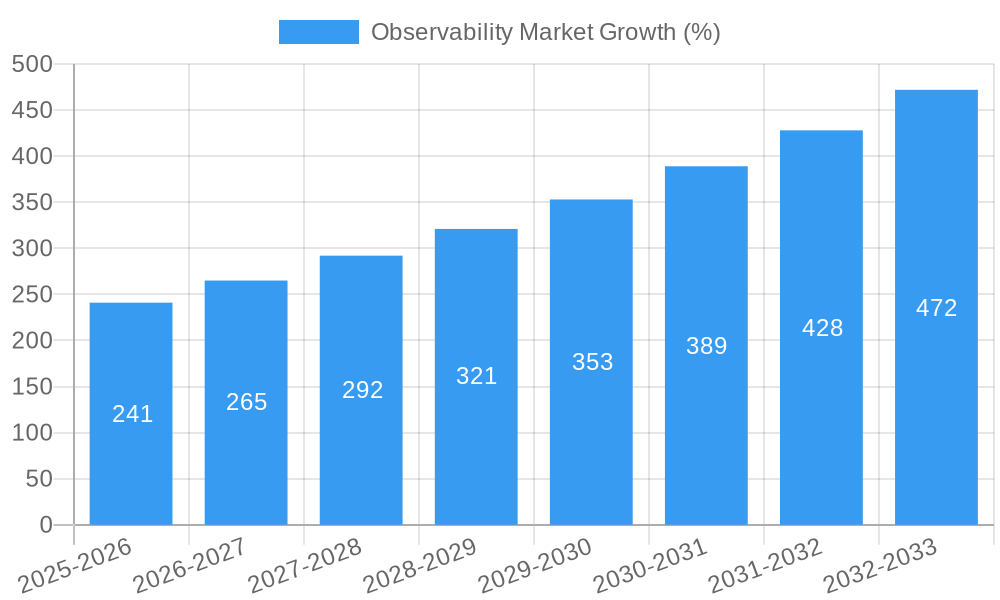
The Observability market exhibits robust growth, driven by the widespread adoption of cloud-native architectures, microservices, and DevOps methodologies. The market experienced a CAGR of xx% during the historical period (2019-2024) and is projected to maintain a CAGR of xx% during the forecast period (2025-2033). This growth is fueled by increasing demand for real-time insights, improved application performance, and enhanced operational efficiency. Technological disruptions, such as the shift towards serverless computing and the growing adoption of Kubernetes, are further accelerating market expansion. Consumer behavior is shifting towards more proactive and intelligent monitoring solutions, driving the demand for advanced observability platforms. Market penetration is currently estimated at xx% in mature markets and is expected to increase significantly in developing economies.
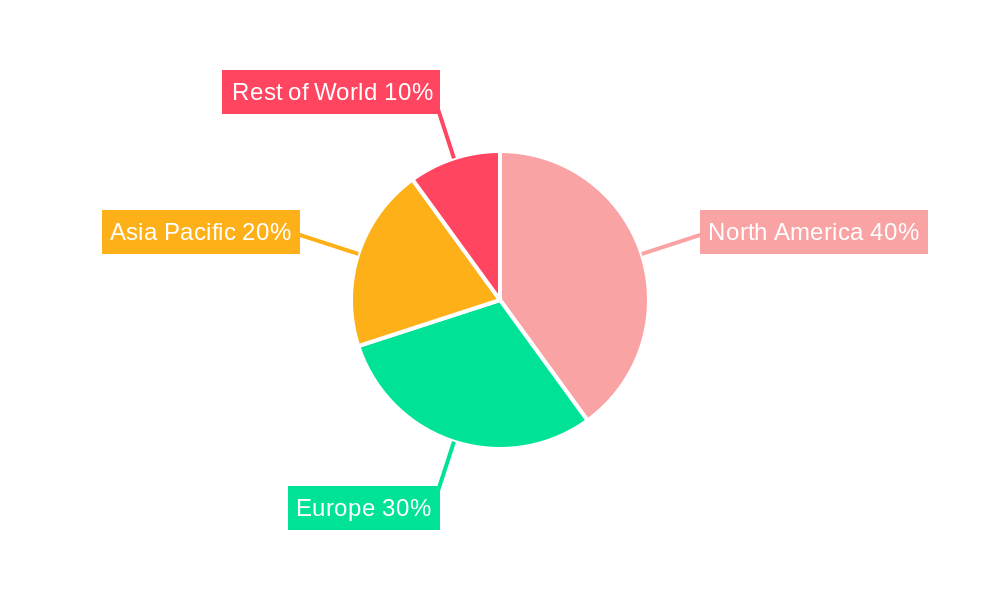
Dominant Regions, Countries, or Segments in Observability Market
North America currently dominates the Observability market, driven by high technology adoption, robust cloud infrastructure, and the presence of major technology players. However, Asia Pacific is emerging as a rapidly growing region, exhibiting significant potential due to increasing digital transformation initiatives and government support for technology advancement. Within the segments, the enterprise segment accounts for the largest market share, followed by the SMB segment, which is expected to experience significant growth in the coming years.
- North America: High cloud adoption, strong technological infrastructure, and the presence of key players contribute to market leadership.
- Asia Pacific: Rapid digital transformation and government support drive significant growth potential.
- Europe: Moderate growth, influenced by regulatory frameworks and economic conditions.
- Enterprise Segment: Largest market share due to high demand for comprehensive observability solutions.
- SMB Segment: High growth potential driven by increasing adoption of cloud-based technologies.
Observability Market Product Landscape
The Observability market offers a diverse range of products, including application performance monitoring (APM) tools, log management solutions, metrics monitoring platforms, and trace analysis systems. These products leverage AI/ML for anomaly detection, root cause analysis, and predictive insights. Key differentiators include advanced analytics capabilities, seamless integration with existing IT infrastructure, and user-friendly interfaces. Recent innovations focus on improved scalability, enhanced security, and broader support for various technologies.
Key Drivers, Barriers & Challenges in Observability Market
Key Drivers:
- Increased adoption of cloud-native architectures and microservices.
- Growing need for real-time insights into application performance and infrastructure health.
- Rise of DevOps and Agile methodologies demanding enhanced monitoring and observability.
Key Challenges:
- High complexity of integrating observability tools into existing IT infrastructure.
- Skill gap in managing and interpreting observability data.
- Data privacy and security concerns related to sensitive application data. This impacts vendor selection and implementation. Approximately xx% of enterprises cite this as a significant challenge.
Emerging Opportunities in Observability Market
- Growing demand for observability in edge computing environments.
- Increasing adoption of observability in IoT and industrial automation applications.
- Expansion into new markets, particularly in developing economies with growing digital infrastructure.
Growth Accelerators in the Observability Market Industry
Technological advancements in AI/ML, serverless computing, and edge computing are key growth accelerators. Strategic partnerships between observability vendors and cloud providers are expanding market reach and adoption. The continuous development of open-source tools and technologies is also contributing to the market growth.
Key Players Shaping the Observability Market Market
- Broadcom Inc
- Dynatrace LLC
- GitLab B V
- IBM Corporation
- LogicMonitor Inc
- Microsoft Corporation
- Monte Carlo Corporation
- Riverbed Technology
- ScienceLogic Inc
- Splunk Inc
- List Not Exhaustive
Notable Milestones in Observability Market Sector
- June 2024: SUSE acquires StackState, integrating observability capabilities into its Rancher platform for Kubernetes management. This strengthens SUSE's position in the enterprise Kubernetes observability market.
- May 2024: Cisco launches a virtual appliance for its AppDynamics On-Premises offering, providing customers with a self-hosted AI-powered observability solution. This caters to enterprises concerned about cloud security and data residency.
In-Depth Observability Market Market Outlook
The Observability market is poised for continued strong growth, driven by ongoing digital transformation, the expanding adoption of cloud-native technologies, and the increasing sophistication of AI/ML-powered observability solutions. Strategic partnerships, acquisitions, and the development of innovative solutions will continue to shape the market landscape. Significant opportunities exist in expanding into untapped markets, particularly in emerging economies and within niche industry segments. The focus on proactive monitoring, AIOps, and improved security features will drive future market expansion.
Observability Market Segmentation
-
1. Type
- 1.1. Solution
- 1.2. Services
-
2. Deployment
- 2.1. Cloud
- 2.2. On-Premises
-
3. Enterprises
- 3.1. SMEs
- 3.2. Large Enterprises
-
4. End-user Vertical
- 4.1. IT and Telecom
- 4.2. Retail and E-commerce
- 4.3. Manufacturing
- 4.4. BFSI
- 4.5. Government and Defense
- 4.6. Other End-user Verticals
Observability Market Segmentation By Geography
- 1. North America
- 2. Europe
- 3. Asia
- 4. Australia and New Zealand
- 5. Latin America
- 6. Middle East and Africa
Observability Market REPORT HIGHLIGHTS
| Aspects | Details |
|---|---|
| Study Period | 2019-2033 |
| Base Year | 2024 |
| Estimated Year | 2025 |
| Forecast Period | 2025-2033 |
| Historical Period | 2019-2024 |
| Growth Rate | CAGR of 9.73% from 2019-2033 |
| Segmentation |
|
Table of Contents
- 1. Introduction
- 1.1. Research Scope
- 1.2. Market Segmentation
- 1.3. Research Methodology
- 1.4. Definitions and Assumptions
- 2. Executive Summary
- 2.1. Introduction
- 3. Market Dynamics
- 3.1. Introduction
- 3.2. Market Drivers
- 3.2.1. Increasing Automation Among Enterprises; Shifting Workloads of Enterprises towards Cloud Environment
- 3.3. Market Restrains
- 3.3.1. Increasing Automation Among Enterprises; Shifting Workloads of Enterprises towards Cloud Environment
- 3.4. Market Trends
- 3.4.1. BFSI to Hold Significant Share
- 4. Market Factor Analysis
- 4.1. Porters Five Forces
- 4.2. Supply/Value Chain
- 4.3. PESTEL analysis
- 4.4. Market Entropy
- 4.5. Patent/Trademark Analysis
- 5. Global Observability Market Analysis, Insights and Forecast, 2019-2031
- 5.1. Market Analysis, Insights and Forecast - by Type
- 5.1.1. Solution
- 5.1.2. Services
- 5.2. Market Analysis, Insights and Forecast - by Deployment
- 5.2.1. Cloud
- 5.2.2. On-Premises
- 5.3. Market Analysis, Insights and Forecast - by Enterprises
- 5.3.1. SMEs
- 5.3.2. Large Enterprises
- 5.4. Market Analysis, Insights and Forecast - by End-user Vertical
- 5.4.1. IT and Telecom
- 5.4.2. Retail and E-commerce
- 5.4.3. Manufacturing
- 5.4.4. BFSI
- 5.4.5. Government and Defense
- 5.4.6. Other End-user Verticals
- 5.5. Market Analysis, Insights and Forecast - by Region
- 5.5.1. North America
- 5.5.2. Europe
- 5.5.3. Asia
- 5.5.4. Australia and New Zealand
- 5.5.5. Latin America
- 5.5.6. Middle East and Africa
- 5.1. Market Analysis, Insights and Forecast - by Type
- 6. North America Observability Market Analysis, Insights and Forecast, 2019-2031
- 6.1. Market Analysis, Insights and Forecast - by Type
- 6.1.1. Solution
- 6.1.2. Services
- 6.2. Market Analysis, Insights and Forecast - by Deployment
- 6.2.1. Cloud
- 6.2.2. On-Premises
- 6.3. Market Analysis, Insights and Forecast - by Enterprises
- 6.3.1. SMEs
- 6.3.2. Large Enterprises
- 6.4. Market Analysis, Insights and Forecast - by End-user Vertical
- 6.4.1. IT and Telecom
- 6.4.2. Retail and E-commerce
- 6.4.3. Manufacturing
- 6.4.4. BFSI
- 6.4.5. Government and Defense
- 6.4.6. Other End-user Verticals
- 6.1. Market Analysis, Insights and Forecast - by Type
- 7. Europe Observability Market Analysis, Insights and Forecast, 2019-2031
- 7.1. Market Analysis, Insights and Forecast - by Type
- 7.1.1. Solution
- 7.1.2. Services
- 7.2. Market Analysis, Insights and Forecast - by Deployment
- 7.2.1. Cloud
- 7.2.2. On-Premises
- 7.3. Market Analysis, Insights and Forecast - by Enterprises
- 7.3.1. SMEs
- 7.3.2. Large Enterprises
- 7.4. Market Analysis, Insights and Forecast - by End-user Vertical
- 7.4.1. IT and Telecom
- 7.4.2. Retail and E-commerce
- 7.4.3. Manufacturing
- 7.4.4. BFSI
- 7.4.5. Government and Defense
- 7.4.6. Other End-user Verticals
- 7.1. Market Analysis, Insights and Forecast - by Type
- 8. Asia Observability Market Analysis, Insights and Forecast, 2019-2031
- 8.1. Market Analysis, Insights and Forecast - by Type
- 8.1.1. Solution
- 8.1.2. Services
- 8.2. Market Analysis, Insights and Forecast - by Deployment
- 8.2.1. Cloud
- 8.2.2. On-Premises
- 8.3. Market Analysis, Insights and Forecast - by Enterprises
- 8.3.1. SMEs
- 8.3.2. Large Enterprises
- 8.4. Market Analysis, Insights and Forecast - by End-user Vertical
- 8.4.1. IT and Telecom
- 8.4.2. Retail and E-commerce
- 8.4.3. Manufacturing
- 8.4.4. BFSI
- 8.4.5. Government and Defense
- 8.4.6. Other End-user Verticals
- 8.1. Market Analysis, Insights and Forecast - by Type
- 9. Australia and New Zealand Observability Market Analysis, Insights and Forecast, 2019-2031
- 9.1. Market Analysis, Insights and Forecast - by Type
- 9.1.1. Solution
- 9.1.2. Services
- 9.2. Market Analysis, Insights and Forecast - by Deployment
- 9.2.1. Cloud
- 9.2.2. On-Premises
- 9.3. Market Analysis, Insights and Forecast - by Enterprises
- 9.3.1. SMEs
- 9.3.2. Large Enterprises
- 9.4. Market Analysis, Insights and Forecast - by End-user Vertical
- 9.4.1. IT and Telecom
- 9.4.2. Retail and E-commerce
- 9.4.3. Manufacturing
- 9.4.4. BFSI
- 9.4.5. Government and Defense
- 9.4.6. Other End-user Verticals
- 9.1. Market Analysis, Insights and Forecast - by Type
- 10. Latin America Observability Market Analysis, Insights and Forecast, 2019-2031
- 10.1. Market Analysis, Insights and Forecast - by Type
- 10.1.1. Solution
- 10.1.2. Services
- 10.2. Market Analysis, Insights and Forecast - by Deployment
- 10.2.1. Cloud
- 10.2.2. On-Premises
- 10.3. Market Analysis, Insights and Forecast - by Enterprises
- 10.3.1. SMEs
- 10.3.2. Large Enterprises
- 10.4. Market Analysis, Insights and Forecast - by End-user Vertical
- 10.4.1. IT and Telecom
- 10.4.2. Retail and E-commerce
- 10.4.3. Manufacturing
- 10.4.4. BFSI
- 10.4.5. Government and Defense
- 10.4.6. Other End-user Verticals
- 10.1. Market Analysis, Insights and Forecast - by Type
- 11. Middle East and Africa Observability Market Analysis, Insights and Forecast, 2019-2031
- 11.1. Market Analysis, Insights and Forecast - by Type
- 11.1.1. Solution
- 11.1.2. Services
- 11.2. Market Analysis, Insights and Forecast - by Deployment
- 11.2.1. Cloud
- 11.2.2. On-Premises
- 11.3. Market Analysis, Insights and Forecast - by Enterprises
- 11.3.1. SMEs
- 11.3.2. Large Enterprises
- 11.4. Market Analysis, Insights and Forecast - by End-user Vertical
- 11.4.1. IT and Telecom
- 11.4.2. Retail and E-commerce
- 11.4.3. Manufacturing
- 11.4.4. BFSI
- 11.4.5. Government and Defense
- 11.4.6. Other End-user Verticals
- 11.1. Market Analysis, Insights and Forecast - by Type
- 12. Competitive Analysis
- 12.1. Global Market Share Analysis 2024
- 12.2. Company Profiles
- 12.2.1 Broadcom Inc
- 12.2.1.1. Overview
- 12.2.1.2. Products
- 12.2.1.3. SWOT Analysis
- 12.2.1.4. Recent Developments
- 12.2.1.5. Financials (Based on Availability)
- 12.2.2 Dynatrace LLC
- 12.2.2.1. Overview
- 12.2.2.2. Products
- 12.2.2.3. SWOT Analysis
- 12.2.2.4. Recent Developments
- 12.2.2.5. Financials (Based on Availability)
- 12.2.3 GitLab B V
- 12.2.3.1. Overview
- 12.2.3.2. Products
- 12.2.3.3. SWOT Analysis
- 12.2.3.4. Recent Developments
- 12.2.3.5. Financials (Based on Availability)
- 12.2.4 IBM Corporation
- 12.2.4.1. Overview
- 12.2.4.2. Products
- 12.2.4.3. SWOT Analysis
- 12.2.4.4. Recent Developments
- 12.2.4.5. Financials (Based on Availability)
- 12.2.5 LogicMonitor Inc
- 12.2.5.1. Overview
- 12.2.5.2. Products
- 12.2.5.3. SWOT Analysis
- 12.2.5.4. Recent Developments
- 12.2.5.5. Financials (Based on Availability)
- 12.2.6 Microsoft Corporation
- 12.2.6.1. Overview
- 12.2.6.2. Products
- 12.2.6.3. SWOT Analysis
- 12.2.6.4. Recent Developments
- 12.2.6.5. Financials (Based on Availability)
- 12.2.7 Monte Carlo Corporation
- 12.2.7.1. Overview
- 12.2.7.2. Products
- 12.2.7.3. SWOT Analysis
- 12.2.7.4. Recent Developments
- 12.2.7.5. Financials (Based on Availability)
- 12.2.8 Riverbed Technology
- 12.2.8.1. Overview
- 12.2.8.2. Products
- 12.2.8.3. SWOT Analysis
- 12.2.8.4. Recent Developments
- 12.2.8.5. Financials (Based on Availability)
- 12.2.9 ScienceLogic Inc
- 12.2.9.1. Overview
- 12.2.9.2. Products
- 12.2.9.3. SWOT Analysis
- 12.2.9.4. Recent Developments
- 12.2.9.5. Financials (Based on Availability)
- 12.2.10 Splunk Inc *List Not Exhaustive
- 12.2.10.1. Overview
- 12.2.10.2. Products
- 12.2.10.3. SWOT Analysis
- 12.2.10.4. Recent Developments
- 12.2.10.5. Financials (Based on Availability)
- 12.2.1 Broadcom Inc
List of Figures
- Figure 1: Global Observability Market Revenue Breakdown (Million, %) by Region 2024 & 2032
- Figure 2: Global Observability Market Volume Breakdown (Billion, %) by Region 2024 & 2032
- Figure 3: North America Observability Market Revenue (Million), by Type 2024 & 2032
- Figure 4: North America Observability Market Volume (Billion), by Type 2024 & 2032
- Figure 5: North America Observability Market Revenue Share (%), by Type 2024 & 2032
- Figure 6: North America Observability Market Volume Share (%), by Type 2024 & 2032
- Figure 7: North America Observability Market Revenue (Million), by Deployment 2024 & 2032
- Figure 8: North America Observability Market Volume (Billion), by Deployment 2024 & 2032
- Figure 9: North America Observability Market Revenue Share (%), by Deployment 2024 & 2032
- Figure 10: North America Observability Market Volume Share (%), by Deployment 2024 & 2032
- Figure 11: North America Observability Market Revenue (Million), by Enterprises 2024 & 2032
- Figure 12: North America Observability Market Volume (Billion), by Enterprises 2024 & 2032
- Figure 13: North America Observability Market Revenue Share (%), by Enterprises 2024 & 2032
- Figure 14: North America Observability Market Volume Share (%), by Enterprises 2024 & 2032
- Figure 15: North America Observability Market Revenue (Million), by End-user Vertical 2024 & 2032
- Figure 16: North America Observability Market Volume (Billion), by End-user Vertical 2024 & 2032
- Figure 17: North America Observability Market Revenue Share (%), by End-user Vertical 2024 & 2032
- Figure 18: North America Observability Market Volume Share (%), by End-user Vertical 2024 & 2032
- Figure 19: North America Observability Market Revenue (Million), by Country 2024 & 2032
- Figure 20: North America Observability Market Volume (Billion), by Country 2024 & 2032
- Figure 21: North America Observability Market Revenue Share (%), by Country 2024 & 2032
- Figure 22: North America Observability Market Volume Share (%), by Country 2024 & 2032
- Figure 23: Europe Observability Market Revenue (Million), by Type 2024 & 2032
- Figure 24: Europe Observability Market Volume (Billion), by Type 2024 & 2032
- Figure 25: Europe Observability Market Revenue Share (%), by Type 2024 & 2032
- Figure 26: Europe Observability Market Volume Share (%), by Type 2024 & 2032
- Figure 27: Europe Observability Market Revenue (Million), by Deployment 2024 & 2032
- Figure 28: Europe Observability Market Volume (Billion), by Deployment 2024 & 2032
- Figure 29: Europe Observability Market Revenue Share (%), by Deployment 2024 & 2032
- Figure 30: Europe Observability Market Volume Share (%), by Deployment 2024 & 2032
- Figure 31: Europe Observability Market Revenue (Million), by Enterprises 2024 & 2032
- Figure 32: Europe Observability Market Volume (Billion), by Enterprises 2024 & 2032
- Figure 33: Europe Observability Market Revenue Share (%), by Enterprises 2024 & 2032
- Figure 34: Europe Observability Market Volume Share (%), by Enterprises 2024 & 2032
- Figure 35: Europe Observability Market Revenue (Million), by End-user Vertical 2024 & 2032
- Figure 36: Europe Observability Market Volume (Billion), by End-user Vertical 2024 & 2032
- Figure 37: Europe Observability Market Revenue Share (%), by End-user Vertical 2024 & 2032
- Figure 38: Europe Observability Market Volume Share (%), by End-user Vertical 2024 & 2032
- Figure 39: Europe Observability Market Revenue (Million), by Country 2024 & 2032
- Figure 40: Europe Observability Market Volume (Billion), by Country 2024 & 2032
- Figure 41: Europe Observability Market Revenue Share (%), by Country 2024 & 2032
- Figure 42: Europe Observability Market Volume Share (%), by Country 2024 & 2032
- Figure 43: Asia Observability Market Revenue (Million), by Type 2024 & 2032
- Figure 44: Asia Observability Market Volume (Billion), by Type 2024 & 2032
- Figure 45: Asia Observability Market Revenue Share (%), by Type 2024 & 2032
- Figure 46: Asia Observability Market Volume Share (%), by Type 2024 & 2032
- Figure 47: Asia Observability Market Revenue (Million), by Deployment 2024 & 2032
- Figure 48: Asia Observability Market Volume (Billion), by Deployment 2024 & 2032
- Figure 49: Asia Observability Market Revenue Share (%), by Deployment 2024 & 2032
- Figure 50: Asia Observability Market Volume Share (%), by Deployment 2024 & 2032
- Figure 51: Asia Observability Market Revenue (Million), by Enterprises 2024 & 2032
- Figure 52: Asia Observability Market Volume (Billion), by Enterprises 2024 & 2032
- Figure 53: Asia Observability Market Revenue Share (%), by Enterprises 2024 & 2032
- Figure 54: Asia Observability Market Volume Share (%), by Enterprises 2024 & 2032
- Figure 55: Asia Observability Market Revenue (Million), by End-user Vertical 2024 & 2032
- Figure 56: Asia Observability Market Volume (Billion), by End-user Vertical 2024 & 2032
- Figure 57: Asia Observability Market Revenue Share (%), by End-user Vertical 2024 & 2032
- Figure 58: Asia Observability Market Volume Share (%), by End-user Vertical 2024 & 2032
- Figure 59: Asia Observability Market Revenue (Million), by Country 2024 & 2032
- Figure 60: Asia Observability Market Volume (Billion), by Country 2024 & 2032
- Figure 61: Asia Observability Market Revenue Share (%), by Country 2024 & 2032
- Figure 62: Asia Observability Market Volume Share (%), by Country 2024 & 2032
- Figure 63: Australia and New Zealand Observability Market Revenue (Million), by Type 2024 & 2032
- Figure 64: Australia and New Zealand Observability Market Volume (Billion), by Type 2024 & 2032
- Figure 65: Australia and New Zealand Observability Market Revenue Share (%), by Type 2024 & 2032
- Figure 66: Australia and New Zealand Observability Market Volume Share (%), by Type 2024 & 2032
- Figure 67: Australia and New Zealand Observability Market Revenue (Million), by Deployment 2024 & 2032
- Figure 68: Australia and New Zealand Observability Market Volume (Billion), by Deployment 2024 & 2032
- Figure 69: Australia and New Zealand Observability Market Revenue Share (%), by Deployment 2024 & 2032
- Figure 70: Australia and New Zealand Observability Market Volume Share (%), by Deployment 2024 & 2032
- Figure 71: Australia and New Zealand Observability Market Revenue (Million), by Enterprises 2024 & 2032
- Figure 72: Australia and New Zealand Observability Market Volume (Billion), by Enterprises 2024 & 2032
- Figure 73: Australia and New Zealand Observability Market Revenue Share (%), by Enterprises 2024 & 2032
- Figure 74: Australia and New Zealand Observability Market Volume Share (%), by Enterprises 2024 & 2032
- Figure 75: Australia and New Zealand Observability Market Revenue (Million), by End-user Vertical 2024 & 2032
- Figure 76: Australia and New Zealand Observability Market Volume (Billion), by End-user Vertical 2024 & 2032
- Figure 77: Australia and New Zealand Observability Market Revenue Share (%), by End-user Vertical 2024 & 2032
- Figure 78: Australia and New Zealand Observability Market Volume Share (%), by End-user Vertical 2024 & 2032
- Figure 79: Australia and New Zealand Observability Market Revenue (Million), by Country 2024 & 2032
- Figure 80: Australia and New Zealand Observability Market Volume (Billion), by Country 2024 & 2032
- Figure 81: Australia and New Zealand Observability Market Revenue Share (%), by Country 2024 & 2032
- Figure 82: Australia and New Zealand Observability Market Volume Share (%), by Country 2024 & 2032
- Figure 83: Latin America Observability Market Revenue (Million), by Type 2024 & 2032
- Figure 84: Latin America Observability Market Volume (Billion), by Type 2024 & 2032
- Figure 85: Latin America Observability Market Revenue Share (%), by Type 2024 & 2032
- Figure 86: Latin America Observability Market Volume Share (%), by Type 2024 & 2032
- Figure 87: Latin America Observability Market Revenue (Million), by Deployment 2024 & 2032
- Figure 88: Latin America Observability Market Volume (Billion), by Deployment 2024 & 2032
- Figure 89: Latin America Observability Market Revenue Share (%), by Deployment 2024 & 2032
- Figure 90: Latin America Observability Market Volume Share (%), by Deployment 2024 & 2032
- Figure 91: Latin America Observability Market Revenue (Million), by Enterprises 2024 & 2032
- Figure 92: Latin America Observability Market Volume (Billion), by Enterprises 2024 & 2032
- Figure 93: Latin America Observability Market Revenue Share (%), by Enterprises 2024 & 2032
- Figure 94: Latin America Observability Market Volume Share (%), by Enterprises 2024 & 2032
- Figure 95: Latin America Observability Market Revenue (Million), by End-user Vertical 2024 & 2032
- Figure 96: Latin America Observability Market Volume (Billion), by End-user Vertical 2024 & 2032
- Figure 97: Latin America Observability Market Revenue Share (%), by End-user Vertical 2024 & 2032
- Figure 98: Latin America Observability Market Volume Share (%), by End-user Vertical 2024 & 2032
- Figure 99: Latin America Observability Market Revenue (Million), by Country 2024 & 2032
- Figure 100: Latin America Observability Market Volume (Billion), by Country 2024 & 2032
- Figure 101: Latin America Observability Market Revenue Share (%), by Country 2024 & 2032
- Figure 102: Latin America Observability Market Volume Share (%), by Country 2024 & 2032
- Figure 103: Middle East and Africa Observability Market Revenue (Million), by Type 2024 & 2032
- Figure 104: Middle East and Africa Observability Market Volume (Billion), by Type 2024 & 2032
- Figure 105: Middle East and Africa Observability Market Revenue Share (%), by Type 2024 & 2032
- Figure 106: Middle East and Africa Observability Market Volume Share (%), by Type 2024 & 2032
- Figure 107: Middle East and Africa Observability Market Revenue (Million), by Deployment 2024 & 2032
- Figure 108: Middle East and Africa Observability Market Volume (Billion), by Deployment 2024 & 2032
- Figure 109: Middle East and Africa Observability Market Revenue Share (%), by Deployment 2024 & 2032
- Figure 110: Middle East and Africa Observability Market Volume Share (%), by Deployment 2024 & 2032
- Figure 111: Middle East and Africa Observability Market Revenue (Million), by Enterprises 2024 & 2032
- Figure 112: Middle East and Africa Observability Market Volume (Billion), by Enterprises 2024 & 2032
- Figure 113: Middle East and Africa Observability Market Revenue Share (%), by Enterprises 2024 & 2032
- Figure 114: Middle East and Africa Observability Market Volume Share (%), by Enterprises 2024 & 2032
- Figure 115: Middle East and Africa Observability Market Revenue (Million), by End-user Vertical 2024 & 2032
- Figure 116: Middle East and Africa Observability Market Volume (Billion), by End-user Vertical 2024 & 2032
- Figure 117: Middle East and Africa Observability Market Revenue Share (%), by End-user Vertical 2024 & 2032
- Figure 118: Middle East and Africa Observability Market Volume Share (%), by End-user Vertical 2024 & 2032
- Figure 119: Middle East and Africa Observability Market Revenue (Million), by Country 2024 & 2032
- Figure 120: Middle East and Africa Observability Market Volume (Billion), by Country 2024 & 2032
- Figure 121: Middle East and Africa Observability Market Revenue Share (%), by Country 2024 & 2032
- Figure 122: Middle East and Africa Observability Market Volume Share (%), by Country 2024 & 2032
List of Tables
- Table 1: Global Observability Market Revenue Million Forecast, by Region 2019 & 2032
- Table 2: Global Observability Market Volume Billion Forecast, by Region 2019 & 2032
- Table 3: Global Observability Market Revenue Million Forecast, by Type 2019 & 2032
- Table 4: Global Observability Market Volume Billion Forecast, by Type 2019 & 2032
- Table 5: Global Observability Market Revenue Million Forecast, by Deployment 2019 & 2032
- Table 6: Global Observability Market Volume Billion Forecast, by Deployment 2019 & 2032
- Table 7: Global Observability Market Revenue Million Forecast, by Enterprises 2019 & 2032
- Table 8: Global Observability Market Volume Billion Forecast, by Enterprises 2019 & 2032
- Table 9: Global Observability Market Revenue Million Forecast, by End-user Vertical 2019 & 2032
- Table 10: Global Observability Market Volume Billion Forecast, by End-user Vertical 2019 & 2032
- Table 11: Global Observability Market Revenue Million Forecast, by Region 2019 & 2032
- Table 12: Global Observability Market Volume Billion Forecast, by Region 2019 & 2032
- Table 13: Global Observability Market Revenue Million Forecast, by Type 2019 & 2032
- Table 14: Global Observability Market Volume Billion Forecast, by Type 2019 & 2032
- Table 15: Global Observability Market Revenue Million Forecast, by Deployment 2019 & 2032
- Table 16: Global Observability Market Volume Billion Forecast, by Deployment 2019 & 2032
- Table 17: Global Observability Market Revenue Million Forecast, by Enterprises 2019 & 2032
- Table 18: Global Observability Market Volume Billion Forecast, by Enterprises 2019 & 2032
- Table 19: Global Observability Market Revenue Million Forecast, by End-user Vertical 2019 & 2032
- Table 20: Global Observability Market Volume Billion Forecast, by End-user Vertical 2019 & 2032
- Table 21: Global Observability Market Revenue Million Forecast, by Country 2019 & 2032
- Table 22: Global Observability Market Volume Billion Forecast, by Country 2019 & 2032
- Table 23: Global Observability Market Revenue Million Forecast, by Type 2019 & 2032
- Table 24: Global Observability Market Volume Billion Forecast, by Type 2019 & 2032
- Table 25: Global Observability Market Revenue Million Forecast, by Deployment 2019 & 2032
- Table 26: Global Observability Market Volume Billion Forecast, by Deployment 2019 & 2032
- Table 27: Global Observability Market Revenue Million Forecast, by Enterprises 2019 & 2032
- Table 28: Global Observability Market Volume Billion Forecast, by Enterprises 2019 & 2032
- Table 29: Global Observability Market Revenue Million Forecast, by End-user Vertical 2019 & 2032
- Table 30: Global Observability Market Volume Billion Forecast, by End-user Vertical 2019 & 2032
- Table 31: Global Observability Market Revenue Million Forecast, by Country 2019 & 2032
- Table 32: Global Observability Market Volume Billion Forecast, by Country 2019 & 2032
- Table 33: Global Observability Market Revenue Million Forecast, by Type 2019 & 2032
- Table 34: Global Observability Market Volume Billion Forecast, by Type 2019 & 2032
- Table 35: Global Observability Market Revenue Million Forecast, by Deployment 2019 & 2032
- Table 36: Global Observability Market Volume Billion Forecast, by Deployment 2019 & 2032
- Table 37: Global Observability Market Revenue Million Forecast, by Enterprises 2019 & 2032
- Table 38: Global Observability Market Volume Billion Forecast, by Enterprises 2019 & 2032
- Table 39: Global Observability Market Revenue Million Forecast, by End-user Vertical 2019 & 2032
- Table 40: Global Observability Market Volume Billion Forecast, by End-user Vertical 2019 & 2032
- Table 41: Global Observability Market Revenue Million Forecast, by Country 2019 & 2032
- Table 42: Global Observability Market Volume Billion Forecast, by Country 2019 & 2032
- Table 43: Global Observability Market Revenue Million Forecast, by Type 2019 & 2032
- Table 44: Global Observability Market Volume Billion Forecast, by Type 2019 & 2032
- Table 45: Global Observability Market Revenue Million Forecast, by Deployment 2019 & 2032
- Table 46: Global Observability Market Volume Billion Forecast, by Deployment 2019 & 2032
- Table 47: Global Observability Market Revenue Million Forecast, by Enterprises 2019 & 2032
- Table 48: Global Observability Market Volume Billion Forecast, by Enterprises 2019 & 2032
- Table 49: Global Observability Market Revenue Million Forecast, by End-user Vertical 2019 & 2032
- Table 50: Global Observability Market Volume Billion Forecast, by End-user Vertical 2019 & 2032
- Table 51: Global Observability Market Revenue Million Forecast, by Country 2019 & 2032
- Table 52: Global Observability Market Volume Billion Forecast, by Country 2019 & 2032
- Table 53: Global Observability Market Revenue Million Forecast, by Type 2019 & 2032
- Table 54: Global Observability Market Volume Billion Forecast, by Type 2019 & 2032
- Table 55: Global Observability Market Revenue Million Forecast, by Deployment 2019 & 2032
- Table 56: Global Observability Market Volume Billion Forecast, by Deployment 2019 & 2032
- Table 57: Global Observability Market Revenue Million Forecast, by Enterprises 2019 & 2032
- Table 58: Global Observability Market Volume Billion Forecast, by Enterprises 2019 & 2032
- Table 59: Global Observability Market Revenue Million Forecast, by End-user Vertical 2019 & 2032
- Table 60: Global Observability Market Volume Billion Forecast, by End-user Vertical 2019 & 2032
- Table 61: Global Observability Market Revenue Million Forecast, by Country 2019 & 2032
- Table 62: Global Observability Market Volume Billion Forecast, by Country 2019 & 2032
- Table 63: Global Observability Market Revenue Million Forecast, by Type 2019 & 2032
- Table 64: Global Observability Market Volume Billion Forecast, by Type 2019 & 2032
- Table 65: Global Observability Market Revenue Million Forecast, by Deployment 2019 & 2032
- Table 66: Global Observability Market Volume Billion Forecast, by Deployment 2019 & 2032
- Table 67: Global Observability Market Revenue Million Forecast, by Enterprises 2019 & 2032
- Table 68: Global Observability Market Volume Billion Forecast, by Enterprises 2019 & 2032
- Table 69: Global Observability Market Revenue Million Forecast, by End-user Vertical 2019 & 2032
- Table 70: Global Observability Market Volume Billion Forecast, by End-user Vertical 2019 & 2032
- Table 71: Global Observability Market Revenue Million Forecast, by Country 2019 & 2032
- Table 72: Global Observability Market Volume Billion Forecast, by Country 2019 & 2032
Frequently Asked Questions
1. What is the projected Compound Annual Growth Rate (CAGR) of the Observability Market?
The projected CAGR is approximately 9.73%.
2. Which companies are prominent players in the Observability Market?
Key companies in the market include Broadcom Inc, Dynatrace LLC, GitLab B V, IBM Corporation, LogicMonitor Inc, Microsoft Corporation, Monte Carlo Corporation, Riverbed Technology, ScienceLogic Inc, Splunk Inc *List Not Exhaustive.
3. What are the main segments of the Observability Market?
The market segments include Type, Deployment, Enterprises, End-user Vertical.
4. Can you provide details about the market size?
The market size is estimated to be USD 2.51 Million as of 2022.
5. What are some drivers contributing to market growth?
Increasing Automation Among Enterprises; Shifting Workloads of Enterprises towards Cloud Environment.
6. What are the notable trends driving market growth?
BFSI to Hold Significant Share.
7. Are there any restraints impacting market growth?
Increasing Automation Among Enterprises; Shifting Workloads of Enterprises towards Cloud Environment.
8. Can you provide examples of recent developments in the market?
June 2024: SUSE announced it has acquired StackState as part of a plan to embed observability capabilities into its Rancher platform for managing Kubernetes clusters. Announced at SUSECon event, the StackState observability platform will be embedded into the Rancher Prime version of the platform for enterprise IT teams.May 2024: Cisco announced a new virtual appliance for its AppDynamics On-Premises application observability offering, enabling customers to use a self-hosted observability solution built on AI-powered intelligence for anomaly detection and root cause analysis, application security, and SAP monitoring.
9. What pricing options are available for accessing the report?
Pricing options include single-user, multi-user, and enterprise licenses priced at USD 4750, USD 5250, and USD 8750 respectively.
10. Is the market size provided in terms of value or volume?
The market size is provided in terms of value, measured in Million and volume, measured in Billion.
11. Are there any specific market keywords associated with the report?
Yes, the market keyword associated with the report is "Observability Market," which aids in identifying and referencing the specific market segment covered.
12. How do I determine which pricing option suits my needs best?
The pricing options vary based on user requirements and access needs. Individual users may opt for single-user licenses, while businesses requiring broader access may choose multi-user or enterprise licenses for cost-effective access to the report.
13. Are there any additional resources or data provided in the Observability Market report?
While the report offers comprehensive insights, it's advisable to review the specific contents or supplementary materials provided to ascertain if additional resources or data are available.
14. How can I stay updated on further developments or reports in the Observability Market?
To stay informed about further developments, trends, and reports in the Observability Market, consider subscribing to industry newsletters, following relevant companies and organizations, or regularly checking reputable industry news sources and publications.
Methodology
Step 1 - Identification of Relevant Samples Size from Population Database


Step 2 - Approaches for Defining Global Market Size (Value, Volume* & Price*)

Note*: In applicable scenarios
Step 3 - Data Sources
Primary Research
- Web Analytics
- Survey Reports
- Research Institute
- Latest Research Reports
- Opinion Leaders
Secondary Research
- Annual Reports
- White Paper
- Latest Press Release
- Industry Association
- Paid Database
- Investor Presentations

Step 4 - Data Triangulation
Involves using different sources of information in order to increase the validity of a study
These sources are likely to be stakeholders in a program - participants, other researchers, program staff, other community members, and so on.
Then we put all data in single framework & apply various statistical tools to find out the dynamic on the market.
During the analysis stage, feedback from the stakeholder groups would be compared to determine areas of agreement as well as areas of divergence
