

Key Insights
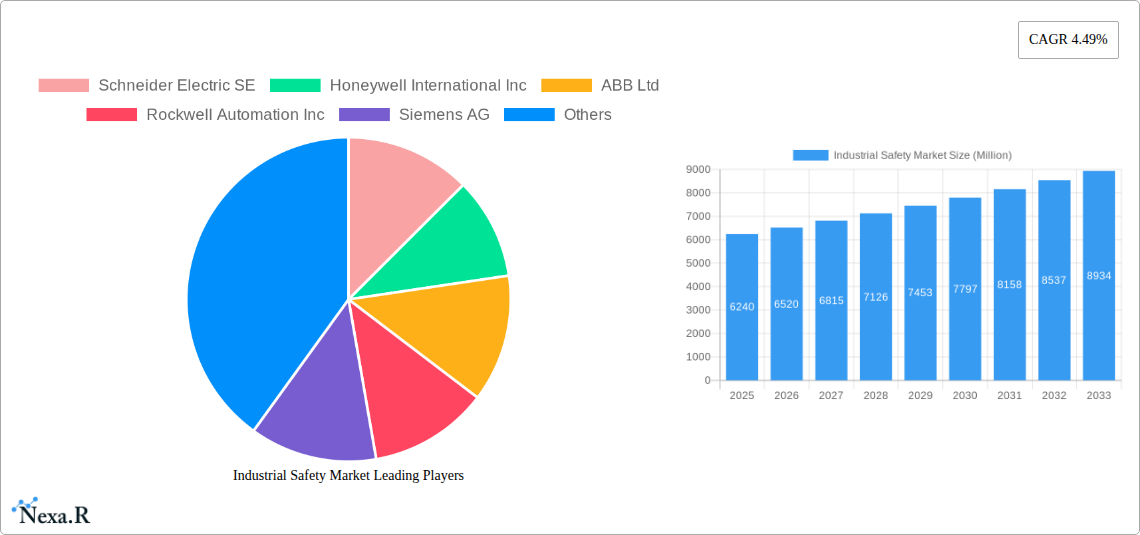
The industrial safety market, valued at $6.24 billion in 2025, is projected to experience robust growth, driven by increasing industrial automation, stringent government regulations on workplace safety, and a rising awareness of the importance of employee well-being. The market's compound annual growth rate (CAGR) of 4.49% from 2025 to 2033 reflects a steady demand for advanced safety technologies and solutions across various sectors, including manufacturing, energy, and construction. Key growth drivers include the adoption of Industrial Internet of Things (IIoT) devices for real-time monitoring and predictive maintenance, the integration of artificial intelligence (AI) for enhanced risk assessment and incident prevention, and the increasing demand for intrinsically safe equipment in hazardous environments. This market is segmented by product type (safety sensors, safety relays, emergency stop devices, safety PLCs, etc.), end-use industry (manufacturing, oil & gas, mining, etc.), and geography. The competitive landscape comprises both established multinational corporations like Schneider Electric, Honeywell, and Siemens, as well as specialized niche players offering innovative safety solutions. The market’s growth is also being influenced by the rising adoption of Industry 4.0 principles across the industrial sector, emphasizing a holistic approach towards workplace safety.
The restraints to market growth primarily involve the high initial investment costs associated with implementing advanced safety systems, particularly in smaller companies with limited budgets. However, the long-term cost savings associated with reduced accidents, improved productivity, and compliance with safety regulations are mitigating this factor. Furthermore, the market's growth trajectory might be influenced by economic fluctuations and global supply chain disruptions. However, ongoing technological advancements and the persistent focus on worker safety globally point towards a continued expansion of this market throughout the forecast period. The increasing availability of cost-effective and user-friendly safety solutions is expected to democratize access and drive wider adoption, especially within small and medium-sized enterprises (SMEs).
Industrial Safety Market: A Comprehensive Report (2019-2033)
This in-depth report provides a comprehensive analysis of the Industrial Safety Market, encompassing market dynamics, growth trends, regional dominance, product landscape, key players, and future outlook. The study period covers 2019-2033, with 2025 as the base and estimated year. The report segments the market into various categories, offering detailed insights for informed decision-making. The market is valued at xx Million units in 2025 and is projected to reach xx Million units by 2033.
Industrial Safety Market Dynamics & Structure
The industrial safety market is characterized by a moderately consolidated structure with several key players holding significant market share. The market is driven by stringent government regulations, increasing industrial automation, and growing awareness of workplace safety. Technological innovation, particularly in areas like IoT-enabled safety systems and AI-powered risk assessment, is another crucial growth driver. However, high initial investment costs and integration complexities pose challenges. Mergers and acquisitions (M&A) activity is moderate, with larger players acquiring smaller, specialized companies to expand their product portfolios and technological capabilities.
- Market Concentration: Moderately Consolidated (Top 5 players hold approximately xx% market share in 2025).
- Technological Innovation: Strong focus on IoT, AI, and advanced sensor technologies.
- Regulatory Framework: Stringent safety standards and compliance regulations across various geographies.
- Competitive Product Substitutes: Limited direct substitutes, but alternative risk mitigation strategies exist.
- End-User Demographics: Primarily manufacturing, energy, construction, and transportation industries.
- M&A Trends: Moderate activity, focusing on technological expansion and geographic reach (xx M&A deals recorded between 2019-2024).
Industrial Safety Market Growth Trends & Insights
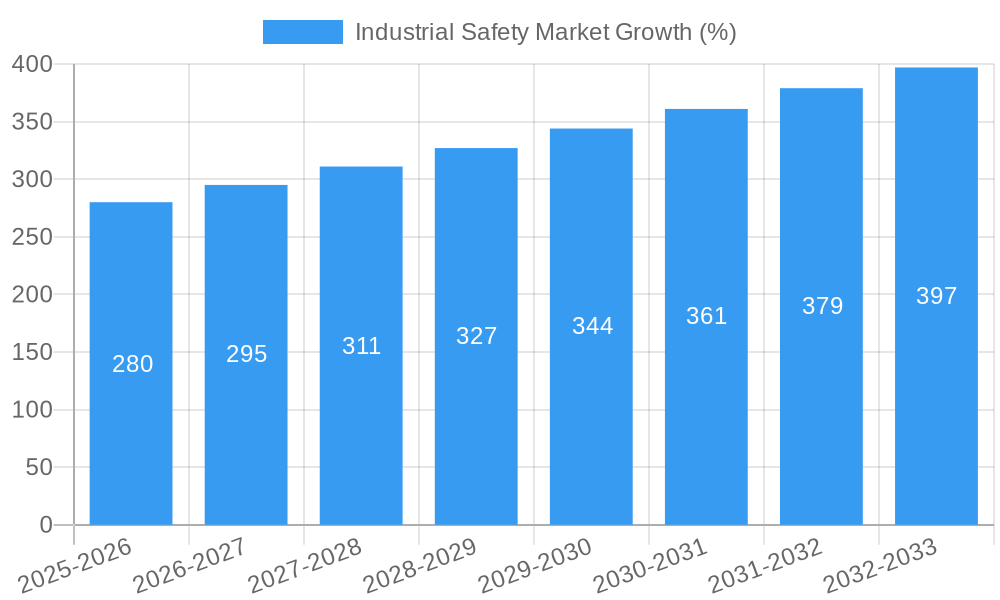
The industrial safety market exhibits robust growth, driven by increasing industrial output, rising worker safety concerns, and technological advancements. The market witnessed a CAGR of xx% during the historical period (2019-2024) and is projected to maintain a CAGR of xx% during the forecast period (2025-2033). This growth is fueled by rising adoption rates of advanced safety technologies, particularly in developing economies experiencing rapid industrialization. Consumer behavior is shifting towards proactive safety measures, increasing demand for sophisticated safety solutions. Technological disruptions, such as the integration of IoT and AI, are transforming the market, leading to more efficient and effective safety systems. Market penetration is increasing across various industries, with higher adoption in sectors with stringent safety regulations.
Dominant Regions, Countries, or Segments in Industrial Safety Market
North America currently holds the largest market share, driven by robust industrial activity, stringent regulatory frameworks, and high technological adoption. However, Asia-Pacific is poised for significant growth, fueled by rapid industrialization and expanding manufacturing sectors. Within segments, the demand for personal protective equipment (PPE) remains substantial, although growth is also seen in advanced safety systems such as integrated safety instrumented systems (SIS) and emergency shutdown systems (ESD).
- North America: High adoption of advanced technologies, stringent regulations.
- Asia-Pacific: Rapid industrialization, expanding manufacturing base, cost-effective solutions gaining traction.
- Europe: Mature market, focus on compliance and sustainability.
- Market Segment Dominance: PPE holds a significant share, but advanced safety systems are exhibiting higher growth rates.
Industrial Safety Market Product Landscape
The industrial safety market offers a diverse range of products, including personal protective equipment (PPE), safety instrumented systems (SIS), emergency shutdown systems (ESD), and gas detection systems. Recent innovations focus on improved ergonomics, enhanced connectivity, and advanced analytics capabilities. Unique selling propositions include real-time monitoring, predictive maintenance, and seamless integration with existing industrial control systems. Technological advancements in sensor technology, wireless communication, and data analytics are driving product performance improvements and enhancing safety protocols.
Key Drivers, Barriers & Challenges in Industrial Safety Market
Key Drivers:
- Stringent government regulations and safety standards.
- Increasing industrial automation and the associated need for robust safety measures.
- Growing awareness of worker safety and the associated cost of workplace accidents.
- Technological advancements, such as IoT and AI-powered solutions.
Challenges & Restraints:
- High initial investment costs associated with advanced safety systems.
- Complexity in integrating new technologies into existing infrastructure.
- Supply chain disruptions impacting the availability of essential components.
- Competition from low-cost providers in developing economies.
Emerging Opportunities in Industrial Safety Market
- Untapped markets in developing economies.
- Growing demand for customized safety solutions.
- Increasing adoption of predictive maintenance and risk assessment technologies.
- Opportunities in emerging sectors like renewable energy and autonomous systems.
Growth Accelerators in the Industrial Safety Market Industry
The long-term growth of the industrial safety market is being fueled by several factors. Technological breakthroughs in sensor technology, artificial intelligence, and machine learning are leading to more sophisticated and effective safety solutions. Strategic partnerships between safety equipment manufacturers and industrial automation providers are driving the integration of safety systems into broader industrial control architectures. Market expansion into developing economies, driven by increasing industrial activity and heightened safety awareness, presents a substantial growth opportunity.
Key Players Shaping the Industrial Safety Market Market
- Schneider Electric SE
- Honeywell International Inc
- ABB Ltd
- Rockwell Automation Inc
- Siemens AG
- Emerson Electric Co
- Baker Hughes
- HIMA Paul Hildebrandt GmbH
- Yokogawa Electric Corporation
- Omron Corporation
- Johnson Controls
- Balluff GmbH
- Keyence Corporation
- IDEC Corporation
- SICK AG
- Mitsubishi Electric
- Banner Engineering
- Fortress Interlocks
- Automation Inc
Notable Milestones in Industrial Safety Market Sector
- January 2024: MKS Instruments Inc. received TÜV Rheinland certification for its programmable safety interlock solution.
- April 2024: Emerson launched the ASCO Series 148/149 safety valve and motorized actuator for industrial fuel oil burners.
In-Depth Industrial Safety Market Market Outlook
The future of the industrial safety market is bright, characterized by continued growth driven by technological advancements, increasing regulatory pressures, and heightened safety awareness. Strategic partnerships and collaborations will further accelerate innovation and market penetration. The focus on predictive maintenance, real-time monitoring, and AI-powered risk assessment will lead to more proactive and efficient safety management practices, ultimately enhancing workplace safety and reducing operational costs. The market's potential for growth remains significant, particularly in developing economies and emerging industrial sectors.
Industrial Safety Market Segmentation
-
1. Component
- 1.1. Safety Sensors
- 1.2. Safety Controllers/Relays
- 1.3. Safety Valves
- 1.4. Other Components
-
2. Safety System
- 2.1. Emergency Shutdown Systems (ESD)
- 2.2. Fire and Gas Monitoring Systems
- 2.3. High Integrity Pressure Protection Systems (HIPPS)
- 2.4. Burner Management Systems (BMS)
- 2.5. Other Safety Systems
-
3. End-user Industry
- 3.1. Aerospace and Defense
- 3.2. Oil and Gas
- 3.3. Automotive
- 3.4. Energy and Power
- 3.5. Metals and Mining
- 3.6. Pharmaceutical and Healthcare
- 3.7. Food and Beverage
- 3.8. Chemical and Petrochemical
- 3.9. Other End-user Industries
Industrial Safety Market Segmentation By Geography
- 1. North America
- 2. Europe
- 3. Asia
- 4. Australia and New Zealand
- 5. Latin America
- 6. Middle East

Industrial Safety Market REPORT HIGHLIGHTS
| Aspects | Details |
|---|---|
| Study Period | 2019-2033 |
| Base Year | 2024 |
| Estimated Year | 2025 |
| Forecast Period | 2025-2033 |
| Historical Period | 2019-2024 |
| Growth Rate | CAGR of 4.49% from 2019-2033 |
| Segmentation |
|
Table of Contents
- 1. Introduction
- 1.1. Research Scope
- 1.2. Market Segmentation
- 1.3. Research Methodology
- 1.4. Definitions and Assumptions
- 2. Executive Summary
- 2.1. Introduction
- 3. Market Dynamics
- 3.1. Introduction
- 3.2. Market Drivers
- 3.2.1 Increasing Regulatory Environment in the Industry will Drive the Market Growth; The Rising Adoption of Automation
- 3.2.2 Robotics
- 3.2.3 and IoT will Increase the Demand for Industrial Safety
- 3.3. Market Restrains
- 3.3.1 Increasing Regulatory Environment in the Industry will Drive the Market Growth; The Rising Adoption of Automation
- 3.3.2 Robotics
- 3.3.3 and IoT will Increase the Demand for Industrial Safety
- 3.4. Market Trends
- 3.4.1. Safety Sensors Segment is Expected to Hold Significant Market Share
- 4. Market Factor Analysis
- 4.1. Porters Five Forces
- 4.2. Supply/Value Chain
- 4.3. PESTEL analysis
- 4.4. Market Entropy
- 4.5. Patent/Trademark Analysis
- 5. Global Industrial Safety Market Analysis, Insights and Forecast, 2019-2031
- 5.1. Market Analysis, Insights and Forecast - by Component
- 5.1.1. Safety Sensors
- 5.1.2. Safety Controllers/Relays
- 5.1.3. Safety Valves
- 5.1.4. Other Components
- 5.2. Market Analysis, Insights and Forecast - by Safety System
- 5.2.1. Emergency Shutdown Systems (ESD)
- 5.2.2. Fire and Gas Monitoring Systems
- 5.2.3. High Integrity Pressure Protection Systems (HIPPS)
- 5.2.4. Burner Management Systems (BMS)
- 5.2.5. Other Safety Systems
- 5.3. Market Analysis, Insights and Forecast - by End-user Industry
- 5.3.1. Aerospace and Defense
- 5.3.2. Oil and Gas
- 5.3.3. Automotive
- 5.3.4. Energy and Power
- 5.3.5. Metals and Mining
- 5.3.6. Pharmaceutical and Healthcare
- 5.3.7. Food and Beverage
- 5.3.8. Chemical and Petrochemical
- 5.3.9. Other End-user Industries
- 5.4. Market Analysis, Insights and Forecast - by Region
- 5.4.1. North America
- 5.4.2. Europe
- 5.4.3. Asia
- 5.4.4. Australia and New Zealand
- 5.4.5. Latin America
- 5.4.6. Middle East
- 5.1. Market Analysis, Insights and Forecast - by Component
- 6. North America Industrial Safety Market Analysis, Insights and Forecast, 2019-2031
- 6.1. Market Analysis, Insights and Forecast - by Component
- 6.1.1. Safety Sensors
- 6.1.2. Safety Controllers/Relays
- 6.1.3. Safety Valves
- 6.1.4. Other Components
- 6.2. Market Analysis, Insights and Forecast - by Safety System
- 6.2.1. Emergency Shutdown Systems (ESD)
- 6.2.2. Fire and Gas Monitoring Systems
- 6.2.3. High Integrity Pressure Protection Systems (HIPPS)
- 6.2.4. Burner Management Systems (BMS)
- 6.2.5. Other Safety Systems
- 6.3. Market Analysis, Insights and Forecast - by End-user Industry
- 6.3.1. Aerospace and Defense
- 6.3.2. Oil and Gas
- 6.3.3. Automotive
- 6.3.4. Energy and Power
- 6.3.5. Metals and Mining
- 6.3.6. Pharmaceutical and Healthcare
- 6.3.7. Food and Beverage
- 6.3.8. Chemical and Petrochemical
- 6.3.9. Other End-user Industries
- 6.1. Market Analysis, Insights and Forecast - by Component
- 7. Europe Industrial Safety Market Analysis, Insights and Forecast, 2019-2031
- 7.1. Market Analysis, Insights and Forecast - by Component
- 7.1.1. Safety Sensors
- 7.1.2. Safety Controllers/Relays
- 7.1.3. Safety Valves
- 7.1.4. Other Components
- 7.2. Market Analysis, Insights and Forecast - by Safety System
- 7.2.1. Emergency Shutdown Systems (ESD)
- 7.2.2. Fire and Gas Monitoring Systems
- 7.2.3. High Integrity Pressure Protection Systems (HIPPS)
- 7.2.4. Burner Management Systems (BMS)
- 7.2.5. Other Safety Systems
- 7.3. Market Analysis, Insights and Forecast - by End-user Industry
- 7.3.1. Aerospace and Defense
- 7.3.2. Oil and Gas
- 7.3.3. Automotive
- 7.3.4. Energy and Power
- 7.3.5. Metals and Mining
- 7.3.6. Pharmaceutical and Healthcare
- 7.3.7. Food and Beverage
- 7.3.8. Chemical and Petrochemical
- 7.3.9. Other End-user Industries
- 7.1. Market Analysis, Insights and Forecast - by Component
- 8. Asia Industrial Safety Market Analysis, Insights and Forecast, 2019-2031
- 8.1. Market Analysis, Insights and Forecast - by Component
- 8.1.1. Safety Sensors
- 8.1.2. Safety Controllers/Relays
- 8.1.3. Safety Valves
- 8.1.4. Other Components
- 8.2. Market Analysis, Insights and Forecast - by Safety System
- 8.2.1. Emergency Shutdown Systems (ESD)
- 8.2.2. Fire and Gas Monitoring Systems
- 8.2.3. High Integrity Pressure Protection Systems (HIPPS)
- 8.2.4. Burner Management Systems (BMS)
- 8.2.5. Other Safety Systems
- 8.3. Market Analysis, Insights and Forecast - by End-user Industry
- 8.3.1. Aerospace and Defense
- 8.3.2. Oil and Gas
- 8.3.3. Automotive
- 8.3.4. Energy and Power
- 8.3.5. Metals and Mining
- 8.3.6. Pharmaceutical and Healthcare
- 8.3.7. Food and Beverage
- 8.3.8. Chemical and Petrochemical
- 8.3.9. Other End-user Industries
- 8.1. Market Analysis, Insights and Forecast - by Component
- 9. Australia and New Zealand Industrial Safety Market Analysis, Insights and Forecast, 2019-2031
- 9.1. Market Analysis, Insights and Forecast - by Component
- 9.1.1. Safety Sensors
- 9.1.2. Safety Controllers/Relays
- 9.1.3. Safety Valves
- 9.1.4. Other Components
- 9.2. Market Analysis, Insights and Forecast - by Safety System
- 9.2.1. Emergency Shutdown Systems (ESD)
- 9.2.2. Fire and Gas Monitoring Systems
- 9.2.3. High Integrity Pressure Protection Systems (HIPPS)
- 9.2.4. Burner Management Systems (BMS)
- 9.2.5. Other Safety Systems
- 9.3. Market Analysis, Insights and Forecast - by End-user Industry
- 9.3.1. Aerospace and Defense
- 9.3.2. Oil and Gas
- 9.3.3. Automotive
- 9.3.4. Energy and Power
- 9.3.5. Metals and Mining
- 9.3.6. Pharmaceutical and Healthcare
- 9.3.7. Food and Beverage
- 9.3.8. Chemical and Petrochemical
- 9.3.9. Other End-user Industries
- 9.1. Market Analysis, Insights and Forecast - by Component
- 10. Latin America Industrial Safety Market Analysis, Insights and Forecast, 2019-2031
- 10.1. Market Analysis, Insights and Forecast - by Component
- 10.1.1. Safety Sensors
- 10.1.2. Safety Controllers/Relays
- 10.1.3. Safety Valves
- 10.1.4. Other Components
- 10.2. Market Analysis, Insights and Forecast - by Safety System
- 10.2.1. Emergency Shutdown Systems (ESD)
- 10.2.2. Fire and Gas Monitoring Systems
- 10.2.3. High Integrity Pressure Protection Systems (HIPPS)
- 10.2.4. Burner Management Systems (BMS)
- 10.2.5. Other Safety Systems
- 10.3. Market Analysis, Insights and Forecast - by End-user Industry
- 10.3.1. Aerospace and Defense
- 10.3.2. Oil and Gas
- 10.3.3. Automotive
- 10.3.4. Energy and Power
- 10.3.5. Metals and Mining
- 10.3.6. Pharmaceutical and Healthcare
- 10.3.7. Food and Beverage
- 10.3.8. Chemical and Petrochemical
- 10.3.9. Other End-user Industries
- 10.1. Market Analysis, Insights and Forecast - by Component
- 11. Middle East Industrial Safety Market Analysis, Insights and Forecast, 2019-2031
- 11.1. Market Analysis, Insights and Forecast - by Component
- 11.1.1. Safety Sensors
- 11.1.2. Safety Controllers/Relays
- 11.1.3. Safety Valves
- 11.1.4. Other Components
- 11.2. Market Analysis, Insights and Forecast - by Safety System
- 11.2.1. Emergency Shutdown Systems (ESD)
- 11.2.2. Fire and Gas Monitoring Systems
- 11.2.3. High Integrity Pressure Protection Systems (HIPPS)
- 11.2.4. Burner Management Systems (BMS)
- 11.2.5. Other Safety Systems
- 11.3. Market Analysis, Insights and Forecast - by End-user Industry
- 11.3.1. Aerospace and Defense
- 11.3.2. Oil and Gas
- 11.3.3. Automotive
- 11.3.4. Energy and Power
- 11.3.5. Metals and Mining
- 11.3.6. Pharmaceutical and Healthcare
- 11.3.7. Food and Beverage
- 11.3.8. Chemical and Petrochemical
- 11.3.9. Other End-user Industries
- 11.1. Market Analysis, Insights and Forecast - by Component
- 12. Competitive Analysis
- 12.1. Global Market Share Analysis 2024
- 12.2. Company Profiles
- 12.2.1 Schneider Electric SE
- 12.2.1.1. Overview
- 12.2.1.2. Products
- 12.2.1.3. SWOT Analysis
- 12.2.1.4. Recent Developments
- 12.2.1.5. Financials (Based on Availability)
- 12.2.2 Honeywell International Inc
- 12.2.2.1. Overview
- 12.2.2.2. Products
- 12.2.2.3. SWOT Analysis
- 12.2.2.4. Recent Developments
- 12.2.2.5. Financials (Based on Availability)
- 12.2.3 ABB Ltd
- 12.2.3.1. Overview
- 12.2.3.2. Products
- 12.2.3.3. SWOT Analysis
- 12.2.3.4. Recent Developments
- 12.2.3.5. Financials (Based on Availability)
- 12.2.4 Rockwell Automation Inc
- 12.2.4.1. Overview
- 12.2.4.2. Products
- 12.2.4.3. SWOT Analysis
- 12.2.4.4. Recent Developments
- 12.2.4.5. Financials (Based on Availability)
- 12.2.5 Siemens AG
- 12.2.5.1. Overview
- 12.2.5.2. Products
- 12.2.5.3. SWOT Analysis
- 12.2.5.4. Recent Developments
- 12.2.5.5. Financials (Based on Availability)
- 12.2.6 Emerson Electric Co
- 12.2.6.1. Overview
- 12.2.6.2. Products
- 12.2.6.3. SWOT Analysis
- 12.2.6.4. Recent Developments
- 12.2.6.5. Financials (Based on Availability)
- 12.2.7 Baker Hughes
- 12.2.7.1. Overview
- 12.2.7.2. Products
- 12.2.7.3. SWOT Analysis
- 12.2.7.4. Recent Developments
- 12.2.7.5. Financials (Based on Availability)
- 12.2.8 HIMA Paul Hildebrandt GmbH
- 12.2.8.1. Overview
- 12.2.8.2. Products
- 12.2.8.3. SWOT Analysis
- 12.2.8.4. Recent Developments
- 12.2.8.5. Financials (Based on Availability)
- 12.2.9 Yokogawa Electric Corporation
- 12.2.9.1. Overview
- 12.2.9.2. Products
- 12.2.9.3. SWOT Analysis
- 12.2.9.4. Recent Developments
- 12.2.9.5. Financials (Based on Availability)
- 12.2.10 Omron Corporation
- 12.2.10.1. Overview
- 12.2.10.2. Products
- 12.2.10.3. SWOT Analysis
- 12.2.10.4. Recent Developments
- 12.2.10.5. Financials (Based on Availability)
- 12.2.11 Johnson Controls
- 12.2.11.1. Overview
- 12.2.11.2. Products
- 12.2.11.3. SWOT Analysis
- 12.2.11.4. Recent Developments
- 12.2.11.5. Financials (Based on Availability)
- 12.2.12 Balluff GmbH
- 12.2.12.1. Overview
- 12.2.12.2. Products
- 12.2.12.3. SWOT Analysis
- 12.2.12.4. Recent Developments
- 12.2.12.5. Financials (Based on Availability)
- 12.2.13 Keyence Corporation
- 12.2.13.1. Overview
- 12.2.13.2. Products
- 12.2.13.3. SWOT Analysis
- 12.2.13.4. Recent Developments
- 12.2.13.5. Financials (Based on Availability)
- 12.2.14 IDEC Corporation
- 12.2.14.1. Overview
- 12.2.14.2. Products
- 12.2.14.3. SWOT Analysis
- 12.2.14.4. Recent Developments
- 12.2.14.5. Financials (Based on Availability)
- 12.2.15 SICK AG
- 12.2.15.1. Overview
- 12.2.15.2. Products
- 12.2.15.3. SWOT Analysis
- 12.2.15.4. Recent Developments
- 12.2.15.5. Financials (Based on Availability)
- 12.2.16 Mitsubishi Electric
- 12.2.16.1. Overview
- 12.2.16.2. Products
- 12.2.16.3. SWOT Analysis
- 12.2.16.4. Recent Developments
- 12.2.16.5. Financials (Based on Availability)
- 12.2.17 Banner Engineering
- 12.2.17.1. Overview
- 12.2.17.2. Products
- 12.2.17.3. SWOT Analysis
- 12.2.17.4. Recent Developments
- 12.2.17.5. Financials (Based on Availability)
- 12.2.18 Fortress Interlocks
- 12.2.18.1. Overview
- 12.2.18.2. Products
- 12.2.18.3. SWOT Analysis
- 12.2.18.4. Recent Developments
- 12.2.18.5. Financials (Based on Availability)
- 12.2.19 Automation Inc
- 12.2.19.1. Overview
- 12.2.19.2. Products
- 12.2.19.3. SWOT Analysis
- 12.2.19.4. Recent Developments
- 12.2.19.5. Financials (Based on Availability)
- 12.2.1 Schneider Electric SE
List of Figures
- Figure 1: Global Industrial Safety Market Revenue Breakdown (Million, %) by Region 2024 & 2032
- Figure 2: Global Industrial Safety Market Volume Breakdown (Billion, %) by Region 2024 & 2032
- Figure 3: North America Industrial Safety Market Revenue (Million), by Component 2024 & 2032
- Figure 4: North America Industrial Safety Market Volume (Billion), by Component 2024 & 2032
- Figure 5: North America Industrial Safety Market Revenue Share (%), by Component 2024 & 2032
- Figure 6: North America Industrial Safety Market Volume Share (%), by Component 2024 & 2032
- Figure 7: North America Industrial Safety Market Revenue (Million), by Safety System 2024 & 2032
- Figure 8: North America Industrial Safety Market Volume (Billion), by Safety System 2024 & 2032
- Figure 9: North America Industrial Safety Market Revenue Share (%), by Safety System 2024 & 2032
- Figure 10: North America Industrial Safety Market Volume Share (%), by Safety System 2024 & 2032
- Figure 11: North America Industrial Safety Market Revenue (Million), by End-user Industry 2024 & 2032
- Figure 12: North America Industrial Safety Market Volume (Billion), by End-user Industry 2024 & 2032
- Figure 13: North America Industrial Safety Market Revenue Share (%), by End-user Industry 2024 & 2032
- Figure 14: North America Industrial Safety Market Volume Share (%), by End-user Industry 2024 & 2032
- Figure 15: North America Industrial Safety Market Revenue (Million), by Country 2024 & 2032
- Figure 16: North America Industrial Safety Market Volume (Billion), by Country 2024 & 2032
- Figure 17: North America Industrial Safety Market Revenue Share (%), by Country 2024 & 2032
- Figure 18: North America Industrial Safety Market Volume Share (%), by Country 2024 & 2032
- Figure 19: Europe Industrial Safety Market Revenue (Million), by Component 2024 & 2032
- Figure 20: Europe Industrial Safety Market Volume (Billion), by Component 2024 & 2032
- Figure 21: Europe Industrial Safety Market Revenue Share (%), by Component 2024 & 2032
- Figure 22: Europe Industrial Safety Market Volume Share (%), by Component 2024 & 2032
- Figure 23: Europe Industrial Safety Market Revenue (Million), by Safety System 2024 & 2032
- Figure 24: Europe Industrial Safety Market Volume (Billion), by Safety System 2024 & 2032
- Figure 25: Europe Industrial Safety Market Revenue Share (%), by Safety System 2024 & 2032
- Figure 26: Europe Industrial Safety Market Volume Share (%), by Safety System 2024 & 2032
- Figure 27: Europe Industrial Safety Market Revenue (Million), by End-user Industry 2024 & 2032
- Figure 28: Europe Industrial Safety Market Volume (Billion), by End-user Industry 2024 & 2032
- Figure 29: Europe Industrial Safety Market Revenue Share (%), by End-user Industry 2024 & 2032
- Figure 30: Europe Industrial Safety Market Volume Share (%), by End-user Industry 2024 & 2032
- Figure 31: Europe Industrial Safety Market Revenue (Million), by Country 2024 & 2032
- Figure 32: Europe Industrial Safety Market Volume (Billion), by Country 2024 & 2032
- Figure 33: Europe Industrial Safety Market Revenue Share (%), by Country 2024 & 2032
- Figure 34: Europe Industrial Safety Market Volume Share (%), by Country 2024 & 2032
- Figure 35: Asia Industrial Safety Market Revenue (Million), by Component 2024 & 2032
- Figure 36: Asia Industrial Safety Market Volume (Billion), by Component 2024 & 2032
- Figure 37: Asia Industrial Safety Market Revenue Share (%), by Component 2024 & 2032
- Figure 38: Asia Industrial Safety Market Volume Share (%), by Component 2024 & 2032
- Figure 39: Asia Industrial Safety Market Revenue (Million), by Safety System 2024 & 2032
- Figure 40: Asia Industrial Safety Market Volume (Billion), by Safety System 2024 & 2032
- Figure 41: Asia Industrial Safety Market Revenue Share (%), by Safety System 2024 & 2032
- Figure 42: Asia Industrial Safety Market Volume Share (%), by Safety System 2024 & 2032
- Figure 43: Asia Industrial Safety Market Revenue (Million), by End-user Industry 2024 & 2032
- Figure 44: Asia Industrial Safety Market Volume (Billion), by End-user Industry 2024 & 2032
- Figure 45: Asia Industrial Safety Market Revenue Share (%), by End-user Industry 2024 & 2032
- Figure 46: Asia Industrial Safety Market Volume Share (%), by End-user Industry 2024 & 2032
- Figure 47: Asia Industrial Safety Market Revenue (Million), by Country 2024 & 2032
- Figure 48: Asia Industrial Safety Market Volume (Billion), by Country 2024 & 2032
- Figure 49: Asia Industrial Safety Market Revenue Share (%), by Country 2024 & 2032
- Figure 50: Asia Industrial Safety Market Volume Share (%), by Country 2024 & 2032
- Figure 51: Australia and New Zealand Industrial Safety Market Revenue (Million), by Component 2024 & 2032
- Figure 52: Australia and New Zealand Industrial Safety Market Volume (Billion), by Component 2024 & 2032
- Figure 53: Australia and New Zealand Industrial Safety Market Revenue Share (%), by Component 2024 & 2032
- Figure 54: Australia and New Zealand Industrial Safety Market Volume Share (%), by Component 2024 & 2032
- Figure 55: Australia and New Zealand Industrial Safety Market Revenue (Million), by Safety System 2024 & 2032
- Figure 56: Australia and New Zealand Industrial Safety Market Volume (Billion), by Safety System 2024 & 2032
- Figure 57: Australia and New Zealand Industrial Safety Market Revenue Share (%), by Safety System 2024 & 2032
- Figure 58: Australia and New Zealand Industrial Safety Market Volume Share (%), by Safety System 2024 & 2032
- Figure 59: Australia and New Zealand Industrial Safety Market Revenue (Million), by End-user Industry 2024 & 2032
- Figure 60: Australia and New Zealand Industrial Safety Market Volume (Billion), by End-user Industry 2024 & 2032
- Figure 61: Australia and New Zealand Industrial Safety Market Revenue Share (%), by End-user Industry 2024 & 2032
- Figure 62: Australia and New Zealand Industrial Safety Market Volume Share (%), by End-user Industry 2024 & 2032
- Figure 63: Australia and New Zealand Industrial Safety Market Revenue (Million), by Country 2024 & 2032
- Figure 64: Australia and New Zealand Industrial Safety Market Volume (Billion), by Country 2024 & 2032
- Figure 65: Australia and New Zealand Industrial Safety Market Revenue Share (%), by Country 2024 & 2032
- Figure 66: Australia and New Zealand Industrial Safety Market Volume Share (%), by Country 2024 & 2032
- Figure 67: Latin America Industrial Safety Market Revenue (Million), by Component 2024 & 2032
- Figure 68: Latin America Industrial Safety Market Volume (Billion), by Component 2024 & 2032
- Figure 69: Latin America Industrial Safety Market Revenue Share (%), by Component 2024 & 2032
- Figure 70: Latin America Industrial Safety Market Volume Share (%), by Component 2024 & 2032
- Figure 71: Latin America Industrial Safety Market Revenue (Million), by Safety System 2024 & 2032
- Figure 72: Latin America Industrial Safety Market Volume (Billion), by Safety System 2024 & 2032
- Figure 73: Latin America Industrial Safety Market Revenue Share (%), by Safety System 2024 & 2032
- Figure 74: Latin America Industrial Safety Market Volume Share (%), by Safety System 2024 & 2032
- Figure 75: Latin America Industrial Safety Market Revenue (Million), by End-user Industry 2024 & 2032
- Figure 76: Latin America Industrial Safety Market Volume (Billion), by End-user Industry 2024 & 2032
- Figure 77: Latin America Industrial Safety Market Revenue Share (%), by End-user Industry 2024 & 2032
- Figure 78: Latin America Industrial Safety Market Volume Share (%), by End-user Industry 2024 & 2032
- Figure 79: Latin America Industrial Safety Market Revenue (Million), by Country 2024 & 2032
- Figure 80: Latin America Industrial Safety Market Volume (Billion), by Country 2024 & 2032
- Figure 81: Latin America Industrial Safety Market Revenue Share (%), by Country 2024 & 2032
- Figure 82: Latin America Industrial Safety Market Volume Share (%), by Country 2024 & 2032
- Figure 83: Middle East Industrial Safety Market Revenue (Million), by Component 2024 & 2032
- Figure 84: Middle East Industrial Safety Market Volume (Billion), by Component 2024 & 2032
- Figure 85: Middle East Industrial Safety Market Revenue Share (%), by Component 2024 & 2032
- Figure 86: Middle East Industrial Safety Market Volume Share (%), by Component 2024 & 2032
- Figure 87: Middle East Industrial Safety Market Revenue (Million), by Safety System 2024 & 2032
- Figure 88: Middle East Industrial Safety Market Volume (Billion), by Safety System 2024 & 2032
- Figure 89: Middle East Industrial Safety Market Revenue Share (%), by Safety System 2024 & 2032
- Figure 90: Middle East Industrial Safety Market Volume Share (%), by Safety System 2024 & 2032
- Figure 91: Middle East Industrial Safety Market Revenue (Million), by End-user Industry 2024 & 2032
- Figure 92: Middle East Industrial Safety Market Volume (Billion), by End-user Industry 2024 & 2032
- Figure 93: Middle East Industrial Safety Market Revenue Share (%), by End-user Industry 2024 & 2032
- Figure 94: Middle East Industrial Safety Market Volume Share (%), by End-user Industry 2024 & 2032
- Figure 95: Middle East Industrial Safety Market Revenue (Million), by Country 2024 & 2032
- Figure 96: Middle East Industrial Safety Market Volume (Billion), by Country 2024 & 2032
- Figure 97: Middle East Industrial Safety Market Revenue Share (%), by Country 2024 & 2032
- Figure 98: Middle East Industrial Safety Market Volume Share (%), by Country 2024 & 2032
List of Tables
- Table 1: Global Industrial Safety Market Revenue Million Forecast, by Region 2019 & 2032
- Table 2: Global Industrial Safety Market Volume Billion Forecast, by Region 2019 & 2032
- Table 3: Global Industrial Safety Market Revenue Million Forecast, by Component 2019 & 2032
- Table 4: Global Industrial Safety Market Volume Billion Forecast, by Component 2019 & 2032
- Table 5: Global Industrial Safety Market Revenue Million Forecast, by Safety System 2019 & 2032
- Table 6: Global Industrial Safety Market Volume Billion Forecast, by Safety System 2019 & 2032
- Table 7: Global Industrial Safety Market Revenue Million Forecast, by End-user Industry 2019 & 2032
- Table 8: Global Industrial Safety Market Volume Billion Forecast, by End-user Industry 2019 & 2032
- Table 9: Global Industrial Safety Market Revenue Million Forecast, by Region 2019 & 2032
- Table 10: Global Industrial Safety Market Volume Billion Forecast, by Region 2019 & 2032
- Table 11: Global Industrial Safety Market Revenue Million Forecast, by Component 2019 & 2032
- Table 12: Global Industrial Safety Market Volume Billion Forecast, by Component 2019 & 2032
- Table 13: Global Industrial Safety Market Revenue Million Forecast, by Safety System 2019 & 2032
- Table 14: Global Industrial Safety Market Volume Billion Forecast, by Safety System 2019 & 2032
- Table 15: Global Industrial Safety Market Revenue Million Forecast, by End-user Industry 2019 & 2032
- Table 16: Global Industrial Safety Market Volume Billion Forecast, by End-user Industry 2019 & 2032
- Table 17: Global Industrial Safety Market Revenue Million Forecast, by Country 2019 & 2032
- Table 18: Global Industrial Safety Market Volume Billion Forecast, by Country 2019 & 2032
- Table 19: Global Industrial Safety Market Revenue Million Forecast, by Component 2019 & 2032
- Table 20: Global Industrial Safety Market Volume Billion Forecast, by Component 2019 & 2032
- Table 21: Global Industrial Safety Market Revenue Million Forecast, by Safety System 2019 & 2032
- Table 22: Global Industrial Safety Market Volume Billion Forecast, by Safety System 2019 & 2032
- Table 23: Global Industrial Safety Market Revenue Million Forecast, by End-user Industry 2019 & 2032
- Table 24: Global Industrial Safety Market Volume Billion Forecast, by End-user Industry 2019 & 2032
- Table 25: Global Industrial Safety Market Revenue Million Forecast, by Country 2019 & 2032
- Table 26: Global Industrial Safety Market Volume Billion Forecast, by Country 2019 & 2032
- Table 27: Global Industrial Safety Market Revenue Million Forecast, by Component 2019 & 2032
- Table 28: Global Industrial Safety Market Volume Billion Forecast, by Component 2019 & 2032
- Table 29: Global Industrial Safety Market Revenue Million Forecast, by Safety System 2019 & 2032
- Table 30: Global Industrial Safety Market Volume Billion Forecast, by Safety System 2019 & 2032
- Table 31: Global Industrial Safety Market Revenue Million Forecast, by End-user Industry 2019 & 2032
- Table 32: Global Industrial Safety Market Volume Billion Forecast, by End-user Industry 2019 & 2032
- Table 33: Global Industrial Safety Market Revenue Million Forecast, by Country 2019 & 2032
- Table 34: Global Industrial Safety Market Volume Billion Forecast, by Country 2019 & 2032
- Table 35: Global Industrial Safety Market Revenue Million Forecast, by Component 2019 & 2032
- Table 36: Global Industrial Safety Market Volume Billion Forecast, by Component 2019 & 2032
- Table 37: Global Industrial Safety Market Revenue Million Forecast, by Safety System 2019 & 2032
- Table 38: Global Industrial Safety Market Volume Billion Forecast, by Safety System 2019 & 2032
- Table 39: Global Industrial Safety Market Revenue Million Forecast, by End-user Industry 2019 & 2032
- Table 40: Global Industrial Safety Market Volume Billion Forecast, by End-user Industry 2019 & 2032
- Table 41: Global Industrial Safety Market Revenue Million Forecast, by Country 2019 & 2032
- Table 42: Global Industrial Safety Market Volume Billion Forecast, by Country 2019 & 2032
- Table 43: Global Industrial Safety Market Revenue Million Forecast, by Component 2019 & 2032
- Table 44: Global Industrial Safety Market Volume Billion Forecast, by Component 2019 & 2032
- Table 45: Global Industrial Safety Market Revenue Million Forecast, by Safety System 2019 & 2032
- Table 46: Global Industrial Safety Market Volume Billion Forecast, by Safety System 2019 & 2032
- Table 47: Global Industrial Safety Market Revenue Million Forecast, by End-user Industry 2019 & 2032
- Table 48: Global Industrial Safety Market Volume Billion Forecast, by End-user Industry 2019 & 2032
- Table 49: Global Industrial Safety Market Revenue Million Forecast, by Country 2019 & 2032
- Table 50: Global Industrial Safety Market Volume Billion Forecast, by Country 2019 & 2032
- Table 51: Global Industrial Safety Market Revenue Million Forecast, by Component 2019 & 2032
- Table 52: Global Industrial Safety Market Volume Billion Forecast, by Component 2019 & 2032
- Table 53: Global Industrial Safety Market Revenue Million Forecast, by Safety System 2019 & 2032
- Table 54: Global Industrial Safety Market Volume Billion Forecast, by Safety System 2019 & 2032
- Table 55: Global Industrial Safety Market Revenue Million Forecast, by End-user Industry 2019 & 2032
- Table 56: Global Industrial Safety Market Volume Billion Forecast, by End-user Industry 2019 & 2032
- Table 57: Global Industrial Safety Market Revenue Million Forecast, by Country 2019 & 2032
- Table 58: Global Industrial Safety Market Volume Billion Forecast, by Country 2019 & 2032
Frequently Asked Questions
1. What is the projected Compound Annual Growth Rate (CAGR) of the Industrial Safety Market?
The projected CAGR is approximately 4.49%.
2. Which companies are prominent players in the Industrial Safety Market?
Key companies in the market include Schneider Electric SE, Honeywell International Inc, ABB Ltd, Rockwell Automation Inc, Siemens AG, Emerson Electric Co, Baker Hughes, HIMA Paul Hildebrandt GmbH, Yokogawa Electric Corporation, Omron Corporation, Johnson Controls, Balluff GmbH, Keyence Corporation, IDEC Corporation, SICK AG, Mitsubishi Electric, Banner Engineering, Fortress Interlocks, Automation Inc.
3. What are the main segments of the Industrial Safety Market?
The market segments include Component, Safety System, End-user Industry.
4. Can you provide details about the market size?
The market size is estimated to be USD 6.24 Million as of 2022.
5. What are some drivers contributing to market growth?
Increasing Regulatory Environment in the Industry will Drive the Market Growth; The Rising Adoption of Automation. Robotics. and IoT will Increase the Demand for Industrial Safety.
6. What are the notable trends driving market growth?
Safety Sensors Segment is Expected to Hold Significant Market Share.
7. Are there any restraints impacting market growth?
Increasing Regulatory Environment in the Industry will Drive the Market Growth; The Rising Adoption of Automation. Robotics. and IoT will Increase the Demand for Industrial Safety.
8. Can you provide examples of recent developments in the market?
April 2024 - Emerson launched the ASCO Series 148/149 safety valve and motorized actuator, specifically engineered for industrial fuel oil burner recirculation and safety shutoff functions. This innovative solution offers industrial users a dependable and adaptable instrument to mitigate risks of overpressure, leaks, and system failures that may result in health and safety hazards, with a single configuration applicable to various combustion system applications.
9. What pricing options are available for accessing the report?
Pricing options include single-user, multi-user, and enterprise licenses priced at USD 4750, USD 5250, and USD 8750 respectively.
10. Is the market size provided in terms of value or volume?
The market size is provided in terms of value, measured in Million and volume, measured in Billion.
11. Are there any specific market keywords associated with the report?
Yes, the market keyword associated with the report is "Industrial Safety Market," which aids in identifying and referencing the specific market segment covered.
12. How do I determine which pricing option suits my needs best?
The pricing options vary based on user requirements and access needs. Individual users may opt for single-user licenses, while businesses requiring broader access may choose multi-user or enterprise licenses for cost-effective access to the report.
13. Are there any additional resources or data provided in the Industrial Safety Market report?
While the report offers comprehensive insights, it's advisable to review the specific contents or supplementary materials provided to ascertain if additional resources or data are available.
14. How can I stay updated on further developments or reports in the Industrial Safety Market?
To stay informed about further developments, trends, and reports in the Industrial Safety Market, consider subscribing to industry newsletters, following relevant companies and organizations, or regularly checking reputable industry news sources and publications.
Methodology
Step 1 - Identification of Relevant Samples Size from Population Database


Step 2 - Approaches for Defining Global Market Size (Value, Volume* & Price*)

Note*: In applicable scenarios
Step 3 - Data Sources
Primary Research
- Web Analytics
- Survey Reports
- Research Institute
- Latest Research Reports
- Opinion Leaders
Secondary Research
- Annual Reports
- White Paper
- Latest Press Release
- Industry Association
- Paid Database
- Investor Presentations

Step 4 - Data Triangulation
Involves using different sources of information in order to increase the validity of a study
These sources are likely to be stakeholders in a program - participants, other researchers, program staff, other community members, and so on.
Then we put all data in single framework & apply various statistical tools to find out the dynamic on the market.
During the analysis stage, feedback from the stakeholder groups would be compared to determine areas of agreement as well as areas of divergence
