

Key Insights
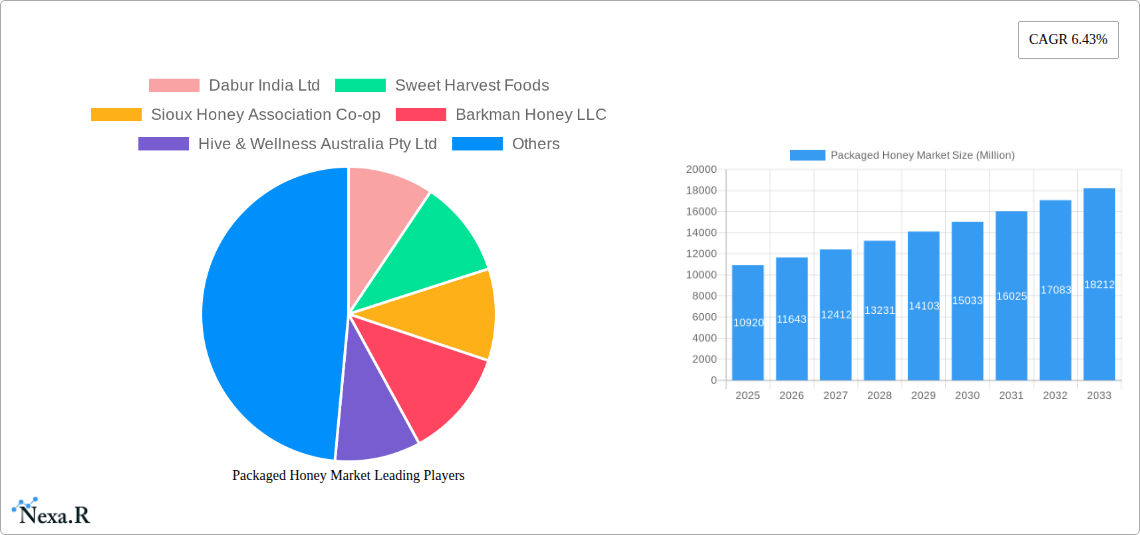
The global packaged honey market, valued at $10.92 billion in 2025, is projected to experience robust growth, driven by several key factors. Rising consumer awareness of honey's health benefits, including its antioxidant and antimicrobial properties, fuels demand for this natural sweetener. The increasing prevalence of health-conscious lifestyles and a growing preference for natural and organic food products further bolster market expansion. Convenience is another significant driver; readily available packaged honey offers consumers a practical and easy-to-use alternative to bulk honey. Furthermore, the expanding food and beverage industry, incorporating honey into various products like yogurt, granola bars, and baked goods, creates lucrative avenues for market growth. While pricing fluctuations and potential supply chain disruptions due to factors like weather conditions and bee colony health pose challenges, the overall market outlook remains positive.
The market segmentation reveals a diverse landscape of players, including large multinational corporations like McCormick & Company Inc and The J.M. Smucker Company, alongside regional and smaller honey producers such as Dabur India Ltd and Sioux Honey Association Co-op. This competitive landscape fosters innovation in product offerings, packaging, and marketing strategies. The market is witnessing the rise of specialized honey varieties, such as organic, raw, and infused honeys, catering to specific consumer preferences and contributing to premium pricing segments. Geographic expansion into emerging markets with a growing middle class and increasing disposable incomes presents significant opportunities for future growth. Continued focus on sustainable beekeeping practices and ensuring the ethical sourcing of honey will be crucial for long-term market sustainability and consumer trust. The projected Compound Annual Growth Rate (CAGR) of 6.43% over the forecast period (2025-2033) suggests a significant increase in market value, making it an attractive sector for investment and expansion.
Packaged Honey Market: A Comprehensive Market Report (2019-2033)
This in-depth report provides a comprehensive analysis of the Packaged Honey Market, encompassing market dynamics, growth trends, regional dominance, product landscape, key players, and future outlook. The study period covers 2019-2033, with 2025 as the base and estimated year. This report is essential for industry professionals, investors, and stakeholders seeking to understand and capitalize on opportunities within this dynamic market. The parent market is the broader honey market, and the child market focuses specifically on packaged honey products.
Packaged Honey Market Dynamics & Structure
The Packaged Honey Market is characterized by a moderately concentrated structure, with several key players holding significant market share. Technological advancements, particularly in automated harvesting and processing, are driving efficiency and product innovation. Regulatory frameworks concerning food safety and labeling vary across regions, influencing market dynamics. Competitive substitutes, such as artificial sweeteners and other natural sweeteners, exert pressure on market growth. End-user demographics are shifting towards health-conscious consumers seeking natural and organic options. M&A activity has been moderate in recent years, with larger players strategically acquiring smaller companies to expand their product portfolios and geographical reach.
- Market Concentration: Moderately concentrated, with top 10 players holding approximately xx% market share (2024).
- Technological Innovation: Automation in harvesting and processing, improved packaging technologies, and traceability systems.
- Regulatory Framework: Varying food safety and labeling regulations across different countries.
- Competitive Substitutes: Artificial sweeteners, agave nectar, maple syrup.
- End-User Demographics: Growing demand from health-conscious and environmentally aware consumers.
- M&A Activity: Moderate activity in recent years, focusing on expansion and diversification. Estimated xx M&A deals in the period 2019-2024.
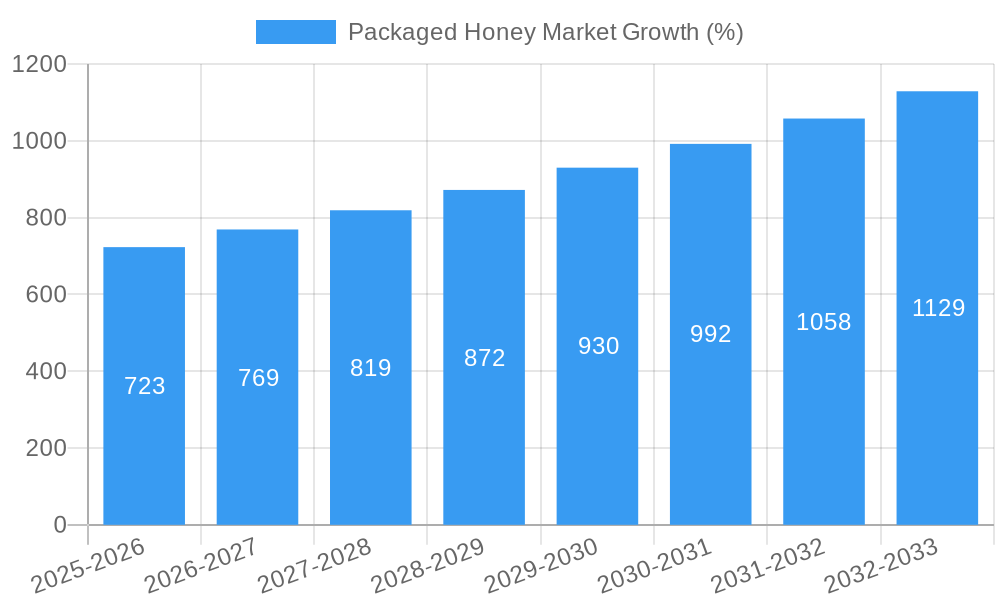
Packaged Honey Market Growth Trends & Insights
The Packaged Honey Market exhibits steady growth, driven by rising consumer demand for natural sweeteners and the increasing awareness of honey's health benefits. Market size experienced a CAGR of xx% during the historical period (2019-2024), reaching xx million units in 2024. Adoption rates of packaged honey are high in developed regions, while emerging markets show significant growth potential. Technological disruptions, such as the introduction of novel processing techniques and sustainable packaging solutions, are influencing market trends. Consumer behavior is shifting towards premium and specialized honey varieties, including organic and raw honey. The forecast period (2025-2033) projects a CAGR of xx%, with the market expected to reach xx million units by 2033. Market penetration in developing economies is a key growth driver.
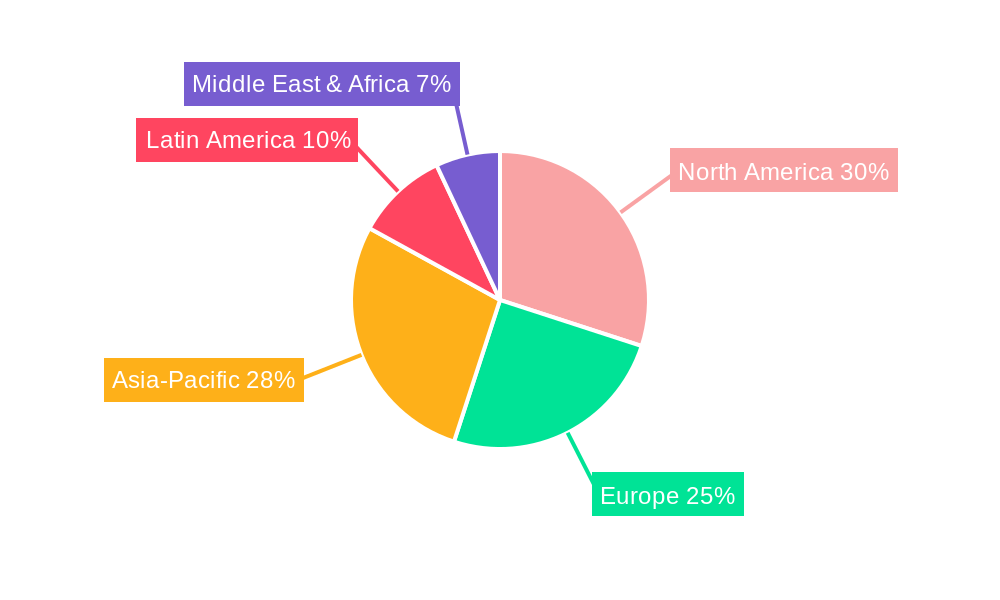
Dominant Regions, Countries, or Segments in Packaged Honey Market
North America and Europe currently dominate the Packaged Honey Market, driven by high consumer spending power and established distribution networks. However, Asia-Pacific shows strong growth potential due to rising disposable incomes and increasing health awareness. Within these regions, specific countries like the US, Canada, Germany, and China stand out as major consumers.
- North America: High per capita consumption and robust retail infrastructure.
- Europe: Strong demand for organic and specialized honey varieties.
- Asia-Pacific: Significant growth potential driven by rising incomes and increasing health awareness.
- Key Drivers: Favorable economic policies, expanding retail channels, and increasing awareness of honey’s health benefits.
Packaged Honey Market Product Landscape
The Packaged Honey Market offers a diverse range of products, including raw honey, organic honey, flavored honey, and honey-based products. Innovation is focused on enhancing product quality, extending shelf life, and developing convenient packaging formats. Unique selling propositions include origin certification, traceability, and sustainability claims. Technological advancements in packaging and processing are contributing to product differentiation and premiumization.
Key Drivers, Barriers & Challenges in Packaged Honey Market
Key Drivers:
- Rising consumer preference for natural and healthy sweeteners.
- Growing awareness of honey's health benefits.
- Expanding retail channels and online sales.
Key Challenges:
- Fluctuations in honey production due to climatic conditions.
- Price volatility of raw honey impacting profitability.
- Intense competition from artificial sweeteners and other natural sweeteners. This pressure represents approximately xx% of the market.
- Stricter food safety and labeling regulations across different countries.
Emerging Opportunities in Packaged Honey Market
- Growing demand for organic and sustainably sourced honey.
- Expansion into new product categories, such as honey-based beverages and skincare products.
- Exploring untapped markets in developing countries.
- Development of innovative packaging solutions that extend shelf life and enhance consumer convenience.
Growth Accelerators in the Packaged Honey Market Industry
The Packaged Honey Market is poised for sustained growth fueled by technological breakthroughs in processing and packaging, strategic partnerships between honey producers and food manufacturers, and expansion into new geographical markets. Furthermore, increasing consumer awareness of the health benefits of honey and its versatility as an ingredient in various food and beverage products will contribute to long-term growth.
Key Players Shaping the Packaged Honey Market
- Dabur India Ltd
- Sweet Harvest Foods
- Sioux Honey Association Co-op
- Barkman Honey LLC
- Hive & Wellness Australia Pty Ltd
- Patanjali Ayurved Limited
- Bright Food Group co Ltd
- McCormick & Company Inc
- The J M Smucker Company
- Apis Group
- List Not Exhaustive
Notable Milestones in Packaged Honey Market Sector
- January 2024: Dabur invested INR 135 crore in expanding its manufacturing facility, boosting production of Dabur Honey.
- January 2024: APIS Honey launched Apis Organic Honey sourced from Kashmir.
- December 2023: Better Foodie launched their 'Vegan H*ney' in collaboration with MeliBio.
In-Depth Packaged Honey Market Outlook
The Packaged Honey Market is projected to witness robust growth over the forecast period, driven by a confluence of factors including rising consumer health consciousness, expanding retail channels, and the increasing adoption of innovative packaging and processing technologies. Strategic partnerships, expansion into new markets, and the development of value-added honey products will further fuel market expansion. Significant opportunities lie in catering to the growing demand for organic, raw, and specialized honey varieties.
Packaged Honey Market Segmentation
-
1. Product Category
- 1.1. Conventional
- 1.2. Organic
-
2. Packaging Type
- 2.1. Pet Bottles
- 2.2. Glass Jars
- 2.3. Other Packaging Types
Packaged Honey Market Segmentation By Geography
-
1. North America
- 1.1. United States
- 1.2. Canada
- 1.3. Mexico
- 1.4. Rest of North America
-
2. Europe
- 2.1. Germany
- 2.2. France
- 2.3. Russia
- 2.4. Spain
- 2.5. United Kingdom
- 2.6. Italy
- 2.7. Rest of Europe
-
3. Asia Pacific
- 3.1. India
- 3.2. China
- 3.3. Japan
- 3.4. Australia
- 3.5. Rest of Asia pacific
-
4. South America
- 4.1. Brazil
- 4.2. Argentina
- 4.3. Rest of South America
-
5. Middle East and Africa
- 5.1. United Arab Emirates
- 5.2. South Africa
- 5.3. Rest of Middle East
Packaged Honey Market REPORT HIGHLIGHTS
| Aspects | Details |
|---|---|
| Study Period | 2019-2033 |
| Base Year | 2024 |
| Estimated Year | 2025 |
| Forecast Period | 2025-2033 |
| Historical Period | 2019-2024 |
| Growth Rate | CAGR of 6.43% from 2019-2033 |
| Segmentation |
|
Table of Contents
- 1. Introduction
- 1.1. Research Scope
- 1.2. Market Segmentation
- 1.3. Research Methodology
- 1.4. Definitions and Assumptions
- 2. Executive Summary
- 2.1. Introduction
- 3. Market Dynamics
- 3.1. Introduction
- 3.2. Market Drivers
- 3.2.1. Increasing Demand for Natural Sweeteners; Government Initiatives Boost Honey Production and Beekeeping
- 3.3. Market Restrains
- 3.3.1. Increasing Demand for Natural Sweeteners; Government Initiatives Boost Honey Production and Beekeeping
- 3.4. Market Trends
- 3.4.1. Conventional Honey Is Consumed Globally
- 4. Market Factor Analysis
- 4.1. Porters Five Forces
- 4.2. Supply/Value Chain
- 4.3. PESTEL analysis
- 4.4. Market Entropy
- 4.5. Patent/Trademark Analysis
- 5. Global Packaged Honey Market Analysis, Insights and Forecast, 2019-2031
- 5.1. Market Analysis, Insights and Forecast - by Product Category
- 5.1.1. Conventional
- 5.1.2. Organic
- 5.2. Market Analysis, Insights and Forecast - by Packaging Type
- 5.2.1. Pet Bottles
- 5.2.2. Glass Jars
- 5.2.3. Other Packaging Types
- 5.3. Market Analysis, Insights and Forecast - by Region
- 5.3.1. North America
- 5.3.2. Europe
- 5.3.3. Asia Pacific
- 5.3.4. South America
- 5.3.5. Middle East and Africa
- 5.1. Market Analysis, Insights and Forecast - by Product Category
- 6. North America Packaged Honey Market Analysis, Insights and Forecast, 2019-2031
- 6.1. Market Analysis, Insights and Forecast - by Product Category
- 6.1.1. Conventional
- 6.1.2. Organic
- 6.2. Market Analysis, Insights and Forecast - by Packaging Type
- 6.2.1. Pet Bottles
- 6.2.2. Glass Jars
- 6.2.3. Other Packaging Types
- 6.1. Market Analysis, Insights and Forecast - by Product Category
- 7. Europe Packaged Honey Market Analysis, Insights and Forecast, 2019-2031
- 7.1. Market Analysis, Insights and Forecast - by Product Category
- 7.1.1. Conventional
- 7.1.2. Organic
- 7.2. Market Analysis, Insights and Forecast - by Packaging Type
- 7.2.1. Pet Bottles
- 7.2.2. Glass Jars
- 7.2.3. Other Packaging Types
- 7.1. Market Analysis, Insights and Forecast - by Product Category
- 8. Asia Pacific Packaged Honey Market Analysis, Insights and Forecast, 2019-2031
- 8.1. Market Analysis, Insights and Forecast - by Product Category
- 8.1.1. Conventional
- 8.1.2. Organic
- 8.2. Market Analysis, Insights and Forecast - by Packaging Type
- 8.2.1. Pet Bottles
- 8.2.2. Glass Jars
- 8.2.3. Other Packaging Types
- 8.1. Market Analysis, Insights and Forecast - by Product Category
- 9. South America Packaged Honey Market Analysis, Insights and Forecast, 2019-2031
- 9.1. Market Analysis, Insights and Forecast - by Product Category
- 9.1.1. Conventional
- 9.1.2. Organic
- 9.2. Market Analysis, Insights and Forecast - by Packaging Type
- 9.2.1. Pet Bottles
- 9.2.2. Glass Jars
- 9.2.3. Other Packaging Types
- 9.1. Market Analysis, Insights and Forecast - by Product Category
- 10. Middle East and Africa Packaged Honey Market Analysis, Insights and Forecast, 2019-2031
- 10.1. Market Analysis, Insights and Forecast - by Product Category
- 10.1.1. Conventional
- 10.1.2. Organic
- 10.2. Market Analysis, Insights and Forecast - by Packaging Type
- 10.2.1. Pet Bottles
- 10.2.2. Glass Jars
- 10.2.3. Other Packaging Types
- 10.1. Market Analysis, Insights and Forecast - by Product Category
- 11. Competitive Analysis
- 11.1. Global Market Share Analysis 2024
- 11.2. Company Profiles
- 11.2.1 Dabur India Ltd
- 11.2.1.1. Overview
- 11.2.1.2. Products
- 11.2.1.3. SWOT Analysis
- 11.2.1.4. Recent Developments
- 11.2.1.5. Financials (Based on Availability)
- 11.2.2 Sweet Harvest Foods
- 11.2.2.1. Overview
- 11.2.2.2. Products
- 11.2.2.3. SWOT Analysis
- 11.2.2.4. Recent Developments
- 11.2.2.5. Financials (Based on Availability)
- 11.2.3 Sioux Honey Association Co-op
- 11.2.3.1. Overview
- 11.2.3.2. Products
- 11.2.3.3. SWOT Analysis
- 11.2.3.4. Recent Developments
- 11.2.3.5. Financials (Based on Availability)
- 11.2.4 Barkman Honey LLC
- 11.2.4.1. Overview
- 11.2.4.2. Products
- 11.2.4.3. SWOT Analysis
- 11.2.4.4. Recent Developments
- 11.2.4.5. Financials (Based on Availability)
- 11.2.5 Hive & Wellness Australia Pty Ltd
- 11.2.5.1. Overview
- 11.2.5.2. Products
- 11.2.5.3. SWOT Analysis
- 11.2.5.4. Recent Developments
- 11.2.5.5. Financials (Based on Availability)
- 11.2.6 Patanjali Ayurved Limited
- 11.2.6.1. Overview
- 11.2.6.2. Products
- 11.2.6.3. SWOT Analysis
- 11.2.6.4. Recent Developments
- 11.2.6.5. Financials (Based on Availability)
- 11.2.7 Bright Food Group co Ltd
- 11.2.7.1. Overview
- 11.2.7.2. Products
- 11.2.7.3. SWOT Analysis
- 11.2.7.4. Recent Developments
- 11.2.7.5. Financials (Based on Availability)
- 11.2.8 Mccormick & Company Inc
- 11.2.8.1. Overview
- 11.2.8.2. Products
- 11.2.8.3. SWOT Analysis
- 11.2.8.4. Recent Developments
- 11.2.8.5. Financials (Based on Availability)
- 11.2.9 The J M Smucker Company
- 11.2.9.1. Overview
- 11.2.9.2. Products
- 11.2.9.3. SWOT Analysis
- 11.2.9.4. Recent Developments
- 11.2.9.5. Financials (Based on Availability)
- 11.2.10 Apis Group*List Not Exhaustive
- 11.2.10.1. Overview
- 11.2.10.2. Products
- 11.2.10.3. SWOT Analysis
- 11.2.10.4. Recent Developments
- 11.2.10.5. Financials (Based on Availability)
- 11.2.1 Dabur India Ltd
List of Figures
- Figure 1: Global Packaged Honey Market Revenue Breakdown (Million, %) by Region 2024 & 2032
- Figure 2: Global Packaged Honey Market Volume Breakdown (Billion, %) by Region 2024 & 2032
- Figure 3: North America Packaged Honey Market Revenue (Million), by Product Category 2024 & 2032
- Figure 4: North America Packaged Honey Market Volume (Billion), by Product Category 2024 & 2032
- Figure 5: North America Packaged Honey Market Revenue Share (%), by Product Category 2024 & 2032
- Figure 6: North America Packaged Honey Market Volume Share (%), by Product Category 2024 & 2032
- Figure 7: North America Packaged Honey Market Revenue (Million), by Packaging Type 2024 & 2032
- Figure 8: North America Packaged Honey Market Volume (Billion), by Packaging Type 2024 & 2032
- Figure 9: North America Packaged Honey Market Revenue Share (%), by Packaging Type 2024 & 2032
- Figure 10: North America Packaged Honey Market Volume Share (%), by Packaging Type 2024 & 2032
- Figure 11: North America Packaged Honey Market Revenue (Million), by Country 2024 & 2032
- Figure 12: North America Packaged Honey Market Volume (Billion), by Country 2024 & 2032
- Figure 13: North America Packaged Honey Market Revenue Share (%), by Country 2024 & 2032
- Figure 14: North America Packaged Honey Market Volume Share (%), by Country 2024 & 2032
- Figure 15: Europe Packaged Honey Market Revenue (Million), by Product Category 2024 & 2032
- Figure 16: Europe Packaged Honey Market Volume (Billion), by Product Category 2024 & 2032
- Figure 17: Europe Packaged Honey Market Revenue Share (%), by Product Category 2024 & 2032
- Figure 18: Europe Packaged Honey Market Volume Share (%), by Product Category 2024 & 2032
- Figure 19: Europe Packaged Honey Market Revenue (Million), by Packaging Type 2024 & 2032
- Figure 20: Europe Packaged Honey Market Volume (Billion), by Packaging Type 2024 & 2032
- Figure 21: Europe Packaged Honey Market Revenue Share (%), by Packaging Type 2024 & 2032
- Figure 22: Europe Packaged Honey Market Volume Share (%), by Packaging Type 2024 & 2032
- Figure 23: Europe Packaged Honey Market Revenue (Million), by Country 2024 & 2032
- Figure 24: Europe Packaged Honey Market Volume (Billion), by Country 2024 & 2032
- Figure 25: Europe Packaged Honey Market Revenue Share (%), by Country 2024 & 2032
- Figure 26: Europe Packaged Honey Market Volume Share (%), by Country 2024 & 2032
- Figure 27: Asia Pacific Packaged Honey Market Revenue (Million), by Product Category 2024 & 2032
- Figure 28: Asia Pacific Packaged Honey Market Volume (Billion), by Product Category 2024 & 2032
- Figure 29: Asia Pacific Packaged Honey Market Revenue Share (%), by Product Category 2024 & 2032
- Figure 30: Asia Pacific Packaged Honey Market Volume Share (%), by Product Category 2024 & 2032
- Figure 31: Asia Pacific Packaged Honey Market Revenue (Million), by Packaging Type 2024 & 2032
- Figure 32: Asia Pacific Packaged Honey Market Volume (Billion), by Packaging Type 2024 & 2032
- Figure 33: Asia Pacific Packaged Honey Market Revenue Share (%), by Packaging Type 2024 & 2032
- Figure 34: Asia Pacific Packaged Honey Market Volume Share (%), by Packaging Type 2024 & 2032
- Figure 35: Asia Pacific Packaged Honey Market Revenue (Million), by Country 2024 & 2032
- Figure 36: Asia Pacific Packaged Honey Market Volume (Billion), by Country 2024 & 2032
- Figure 37: Asia Pacific Packaged Honey Market Revenue Share (%), by Country 2024 & 2032
- Figure 38: Asia Pacific Packaged Honey Market Volume Share (%), by Country 2024 & 2032
- Figure 39: South America Packaged Honey Market Revenue (Million), by Product Category 2024 & 2032
- Figure 40: South America Packaged Honey Market Volume (Billion), by Product Category 2024 & 2032
- Figure 41: South America Packaged Honey Market Revenue Share (%), by Product Category 2024 & 2032
- Figure 42: South America Packaged Honey Market Volume Share (%), by Product Category 2024 & 2032
- Figure 43: South America Packaged Honey Market Revenue (Million), by Packaging Type 2024 & 2032
- Figure 44: South America Packaged Honey Market Volume (Billion), by Packaging Type 2024 & 2032
- Figure 45: South America Packaged Honey Market Revenue Share (%), by Packaging Type 2024 & 2032
- Figure 46: South America Packaged Honey Market Volume Share (%), by Packaging Type 2024 & 2032
- Figure 47: South America Packaged Honey Market Revenue (Million), by Country 2024 & 2032
- Figure 48: South America Packaged Honey Market Volume (Billion), by Country 2024 & 2032
- Figure 49: South America Packaged Honey Market Revenue Share (%), by Country 2024 & 2032
- Figure 50: South America Packaged Honey Market Volume Share (%), by Country 2024 & 2032
- Figure 51: Middle East and Africa Packaged Honey Market Revenue (Million), by Product Category 2024 & 2032
- Figure 52: Middle East and Africa Packaged Honey Market Volume (Billion), by Product Category 2024 & 2032
- Figure 53: Middle East and Africa Packaged Honey Market Revenue Share (%), by Product Category 2024 & 2032
- Figure 54: Middle East and Africa Packaged Honey Market Volume Share (%), by Product Category 2024 & 2032
- Figure 55: Middle East and Africa Packaged Honey Market Revenue (Million), by Packaging Type 2024 & 2032
- Figure 56: Middle East and Africa Packaged Honey Market Volume (Billion), by Packaging Type 2024 & 2032
- Figure 57: Middle East and Africa Packaged Honey Market Revenue Share (%), by Packaging Type 2024 & 2032
- Figure 58: Middle East and Africa Packaged Honey Market Volume Share (%), by Packaging Type 2024 & 2032
- Figure 59: Middle East and Africa Packaged Honey Market Revenue (Million), by Country 2024 & 2032
- Figure 60: Middle East and Africa Packaged Honey Market Volume (Billion), by Country 2024 & 2032
- Figure 61: Middle East and Africa Packaged Honey Market Revenue Share (%), by Country 2024 & 2032
- Figure 62: Middle East and Africa Packaged Honey Market Volume Share (%), by Country 2024 & 2032
List of Tables
- Table 1: Global Packaged Honey Market Revenue Million Forecast, by Region 2019 & 2032
- Table 2: Global Packaged Honey Market Volume Billion Forecast, by Region 2019 & 2032
- Table 3: Global Packaged Honey Market Revenue Million Forecast, by Product Category 2019 & 2032
- Table 4: Global Packaged Honey Market Volume Billion Forecast, by Product Category 2019 & 2032
- Table 5: Global Packaged Honey Market Revenue Million Forecast, by Packaging Type 2019 & 2032
- Table 6: Global Packaged Honey Market Volume Billion Forecast, by Packaging Type 2019 & 2032
- Table 7: Global Packaged Honey Market Revenue Million Forecast, by Region 2019 & 2032
- Table 8: Global Packaged Honey Market Volume Billion Forecast, by Region 2019 & 2032
- Table 9: Global Packaged Honey Market Revenue Million Forecast, by Product Category 2019 & 2032
- Table 10: Global Packaged Honey Market Volume Billion Forecast, by Product Category 2019 & 2032
- Table 11: Global Packaged Honey Market Revenue Million Forecast, by Packaging Type 2019 & 2032
- Table 12: Global Packaged Honey Market Volume Billion Forecast, by Packaging Type 2019 & 2032
- Table 13: Global Packaged Honey Market Revenue Million Forecast, by Country 2019 & 2032
- Table 14: Global Packaged Honey Market Volume Billion Forecast, by Country 2019 & 2032
- Table 15: United States Packaged Honey Market Revenue (Million) Forecast, by Application 2019 & 2032
- Table 16: United States Packaged Honey Market Volume (Billion) Forecast, by Application 2019 & 2032
- Table 17: Canada Packaged Honey Market Revenue (Million) Forecast, by Application 2019 & 2032
- Table 18: Canada Packaged Honey Market Volume (Billion) Forecast, by Application 2019 & 2032
- Table 19: Mexico Packaged Honey Market Revenue (Million) Forecast, by Application 2019 & 2032
- Table 20: Mexico Packaged Honey Market Volume (Billion) Forecast, by Application 2019 & 2032
- Table 21: Rest of North America Packaged Honey Market Revenue (Million) Forecast, by Application 2019 & 2032
- Table 22: Rest of North America Packaged Honey Market Volume (Billion) Forecast, by Application 2019 & 2032
- Table 23: Global Packaged Honey Market Revenue Million Forecast, by Product Category 2019 & 2032
- Table 24: Global Packaged Honey Market Volume Billion Forecast, by Product Category 2019 & 2032
- Table 25: Global Packaged Honey Market Revenue Million Forecast, by Packaging Type 2019 & 2032
- Table 26: Global Packaged Honey Market Volume Billion Forecast, by Packaging Type 2019 & 2032
- Table 27: Global Packaged Honey Market Revenue Million Forecast, by Country 2019 & 2032
- Table 28: Global Packaged Honey Market Volume Billion Forecast, by Country 2019 & 2032
- Table 29: Germany Packaged Honey Market Revenue (Million) Forecast, by Application 2019 & 2032
- Table 30: Germany Packaged Honey Market Volume (Billion) Forecast, by Application 2019 & 2032
- Table 31: France Packaged Honey Market Revenue (Million) Forecast, by Application 2019 & 2032
- Table 32: France Packaged Honey Market Volume (Billion) Forecast, by Application 2019 & 2032
- Table 33: Russia Packaged Honey Market Revenue (Million) Forecast, by Application 2019 & 2032
- Table 34: Russia Packaged Honey Market Volume (Billion) Forecast, by Application 2019 & 2032
- Table 35: Spain Packaged Honey Market Revenue (Million) Forecast, by Application 2019 & 2032
- Table 36: Spain Packaged Honey Market Volume (Billion) Forecast, by Application 2019 & 2032
- Table 37: United Kingdom Packaged Honey Market Revenue (Million) Forecast, by Application 2019 & 2032
- Table 38: United Kingdom Packaged Honey Market Volume (Billion) Forecast, by Application 2019 & 2032
- Table 39: Italy Packaged Honey Market Revenue (Million) Forecast, by Application 2019 & 2032
- Table 40: Italy Packaged Honey Market Volume (Billion) Forecast, by Application 2019 & 2032
- Table 41: Rest of Europe Packaged Honey Market Revenue (Million) Forecast, by Application 2019 & 2032
- Table 42: Rest of Europe Packaged Honey Market Volume (Billion) Forecast, by Application 2019 & 2032
- Table 43: Global Packaged Honey Market Revenue Million Forecast, by Product Category 2019 & 2032
- Table 44: Global Packaged Honey Market Volume Billion Forecast, by Product Category 2019 & 2032
- Table 45: Global Packaged Honey Market Revenue Million Forecast, by Packaging Type 2019 & 2032
- Table 46: Global Packaged Honey Market Volume Billion Forecast, by Packaging Type 2019 & 2032
- Table 47: Global Packaged Honey Market Revenue Million Forecast, by Country 2019 & 2032
- Table 48: Global Packaged Honey Market Volume Billion Forecast, by Country 2019 & 2032
- Table 49: India Packaged Honey Market Revenue (Million) Forecast, by Application 2019 & 2032
- Table 50: India Packaged Honey Market Volume (Billion) Forecast, by Application 2019 & 2032
- Table 51: China Packaged Honey Market Revenue (Million) Forecast, by Application 2019 & 2032
- Table 52: China Packaged Honey Market Volume (Billion) Forecast, by Application 2019 & 2032
- Table 53: Japan Packaged Honey Market Revenue (Million) Forecast, by Application 2019 & 2032
- Table 54: Japan Packaged Honey Market Volume (Billion) Forecast, by Application 2019 & 2032
- Table 55: Australia Packaged Honey Market Revenue (Million) Forecast, by Application 2019 & 2032
- Table 56: Australia Packaged Honey Market Volume (Billion) Forecast, by Application 2019 & 2032
- Table 57: Rest of Asia pacific Packaged Honey Market Revenue (Million) Forecast, by Application 2019 & 2032
- Table 58: Rest of Asia pacific Packaged Honey Market Volume (Billion) Forecast, by Application 2019 & 2032
- Table 59: Global Packaged Honey Market Revenue Million Forecast, by Product Category 2019 & 2032
- Table 60: Global Packaged Honey Market Volume Billion Forecast, by Product Category 2019 & 2032
- Table 61: Global Packaged Honey Market Revenue Million Forecast, by Packaging Type 2019 & 2032
- Table 62: Global Packaged Honey Market Volume Billion Forecast, by Packaging Type 2019 & 2032
- Table 63: Global Packaged Honey Market Revenue Million Forecast, by Country 2019 & 2032
- Table 64: Global Packaged Honey Market Volume Billion Forecast, by Country 2019 & 2032
- Table 65: Brazil Packaged Honey Market Revenue (Million) Forecast, by Application 2019 & 2032
- Table 66: Brazil Packaged Honey Market Volume (Billion) Forecast, by Application 2019 & 2032
- Table 67: Argentina Packaged Honey Market Revenue (Million) Forecast, by Application 2019 & 2032
- Table 68: Argentina Packaged Honey Market Volume (Billion) Forecast, by Application 2019 & 2032
- Table 69: Rest of South America Packaged Honey Market Revenue (Million) Forecast, by Application 2019 & 2032
- Table 70: Rest of South America Packaged Honey Market Volume (Billion) Forecast, by Application 2019 & 2032
- Table 71: Global Packaged Honey Market Revenue Million Forecast, by Product Category 2019 & 2032
- Table 72: Global Packaged Honey Market Volume Billion Forecast, by Product Category 2019 & 2032
- Table 73: Global Packaged Honey Market Revenue Million Forecast, by Packaging Type 2019 & 2032
- Table 74: Global Packaged Honey Market Volume Billion Forecast, by Packaging Type 2019 & 2032
- Table 75: Global Packaged Honey Market Revenue Million Forecast, by Country 2019 & 2032
- Table 76: Global Packaged Honey Market Volume Billion Forecast, by Country 2019 & 2032
- Table 77: United Arab Emirates Packaged Honey Market Revenue (Million) Forecast, by Application 2019 & 2032
- Table 78: United Arab Emirates Packaged Honey Market Volume (Billion) Forecast, by Application 2019 & 2032
- Table 79: South Africa Packaged Honey Market Revenue (Million) Forecast, by Application 2019 & 2032
- Table 80: South Africa Packaged Honey Market Volume (Billion) Forecast, by Application 2019 & 2032
- Table 81: Rest of Middle East Packaged Honey Market Revenue (Million) Forecast, by Application 2019 & 2032
- Table 82: Rest of Middle East Packaged Honey Market Volume (Billion) Forecast, by Application 2019 & 2032
Frequently Asked Questions
1. What is the projected Compound Annual Growth Rate (CAGR) of the Packaged Honey Market?
The projected CAGR is approximately 6.43%.
2. Which companies are prominent players in the Packaged Honey Market?
Key companies in the market include Dabur India Ltd, Sweet Harvest Foods, Sioux Honey Association Co-op, Barkman Honey LLC, Hive & Wellness Australia Pty Ltd, Patanjali Ayurved Limited, Bright Food Group co Ltd, Mccormick & Company Inc, The J M Smucker Company, Apis Group*List Not Exhaustive.
3. What are the main segments of the Packaged Honey Market?
The market segments include Product Category, Packaging Type.
4. Can you provide details about the market size?
The market size is estimated to be USD 10.92 Million as of 2022.
5. What are some drivers contributing to market growth?
Increasing Demand for Natural Sweeteners; Government Initiatives Boost Honey Production and Beekeeping.
6. What are the notable trends driving market growth?
Conventional Honey Is Consumed Globally.
7. Are there any restraints impacting market growth?
Increasing Demand for Natural Sweeteners; Government Initiatives Boost Honey Production and Beekeeping.
8. Can you provide examples of recent developments in the market?
January 2024: Dabur, one of the leading firms in the Ayurvedic and personal care space, recently invested approximately INR 135 crore in expanding its manufacturing facility in South India. This move is geared toward bolstering the production capacity of its flagship products, including Dabur Honey, Dabur Red Paste, and Odonil air fresheners.
9. What pricing options are available for accessing the report?
Pricing options include single-user, multi-user, and enterprise licenses priced at USD 4750, USD 5250, and USD 8750 respectively.
10. Is the market size provided in terms of value or volume?
The market size is provided in terms of value, measured in Million and volume, measured in Billion.
11. Are there any specific market keywords associated with the report?
Yes, the market keyword associated with the report is "Packaged Honey Market," which aids in identifying and referencing the specific market segment covered.
12. How do I determine which pricing option suits my needs best?
The pricing options vary based on user requirements and access needs. Individual users may opt for single-user licenses, while businesses requiring broader access may choose multi-user or enterprise licenses for cost-effective access to the report.
13. Are there any additional resources or data provided in the Packaged Honey Market report?
While the report offers comprehensive insights, it's advisable to review the specific contents or supplementary materials provided to ascertain if additional resources or data are available.
14. How can I stay updated on further developments or reports in the Packaged Honey Market?
To stay informed about further developments, trends, and reports in the Packaged Honey Market, consider subscribing to industry newsletters, following relevant companies and organizations, or regularly checking reputable industry news sources and publications.
Methodology
Step 1 - Identification of Relevant Samples Size from Population Database


Step 2 - Approaches for Defining Global Market Size (Value, Volume* & Price*)

Note*: In applicable scenarios
Step 3 - Data Sources
Primary Research
- Web Analytics
- Survey Reports
- Research Institute
- Latest Research Reports
- Opinion Leaders
Secondary Research
- Annual Reports
- White Paper
- Latest Press Release
- Industry Association
- Paid Database
- Investor Presentations

Step 4 - Data Triangulation
Involves using different sources of information in order to increase the validity of a study
These sources are likely to be stakeholders in a program - participants, other researchers, program staff, other community members, and so on.
Then we put all data in single framework & apply various statistical tools to find out the dynamic on the market.
During the analysis stage, feedback from the stakeholder groups would be compared to determine areas of agreement as well as areas of divergence
