

Key Insights
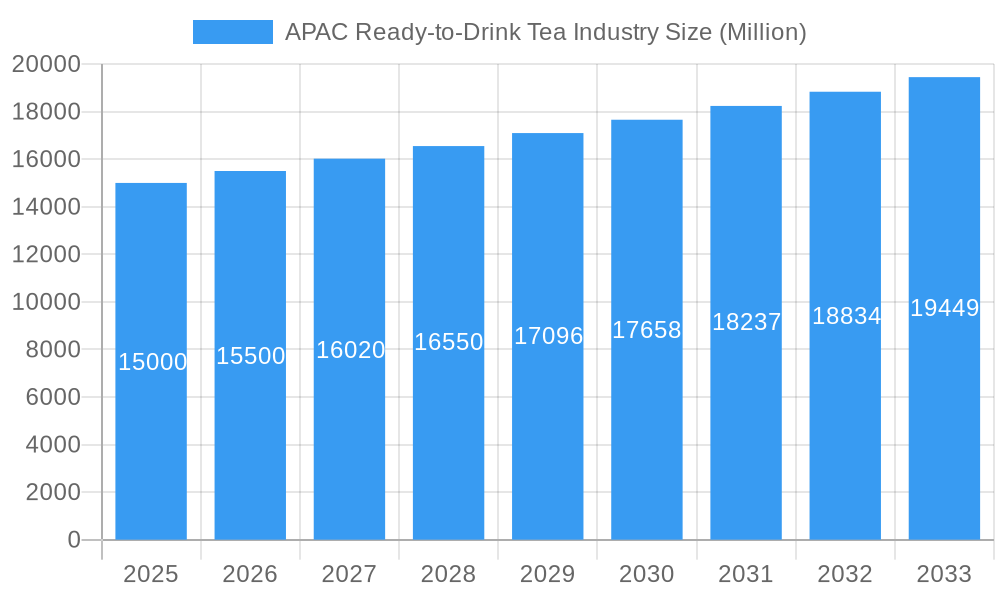
The Asia-Pacific Ready-to-Drink (RTD) tea market, projected at 51.8 billion in 2025, is forecast to grow at a CAGR of 4.2% between 2025 and 2033. Key growth drivers include rising disposable incomes and increasing consumer preference for convenient, healthy beverages, particularly green and herbal teas. Innovations in packaging, such as aseptic and PET bottles, are expanding product appeal and shelf life. The off-trade distribution channel, including supermarkets and online retail, is a significant contributor to market accessibility. Challenges include raw material price volatility and competition from other beverage categories. Consumer preferences vary regionally, with established markets favoring traditional types and emerging markets embracing innovative flavors.

APAC Ready-to-Drink Tea Industry Market Size (In Billion)
Market segmentation highlights opportunities in packaging, with aseptic and PET bottles leading. Green tea remains dominant, with herbal and iced tea segments showing strong growth potential. China, India, and Japan are key markets, while Vietnam and Indonesia present rapid growth prospects. Leading companies like Ichitan Group PCL, Nestle S.A., and Asahi Group Holdings Ltd. leverage brand recognition and distribution networks. Emerging players are focusing on product innovation and targeted marketing to gain market share. Success hinges on adapting to consumer trends, investing in sustainable packaging, and maintaining resilient supply chains.
APAC Ready-to-Drink Tea Industry Company Market Share
This report offers a comprehensive analysis of the Asia-Pacific RTD tea market, covering market size, growth trends, competitive landscape, and future outlook for the period 2019-2033. The base year is 2025, with a forecast period extending to 2033. It examines key segments including Packaging Type (Aseptic, Glass, Metal, PET), Beverage Type (Green, Herbal, Iced, Other RTD), and Distribution Channel (Off-trade, On-trade) across major APAC countries: Australia, China, India, Indonesia, Japan, Malaysia, South Korea, Thailand, Vietnam, and the Rest of Asia-Pacific.
APAC Ready-to-Drink Tea Industry Market Dynamics & Structure
The APAC RTD tea market is characterized by a complex interplay of factors influencing its structure and dynamics. Market concentration is moderate, with several large multinational players alongside regional and local brands competing fiercely. Technological innovation, particularly in packaging and product formulations (e.g., functional teas), is a key driver, alongside evolving consumer preferences for healthier and more convenient beverage options. Regulatory frameworks concerning labeling, ingredients, and health claims vary across countries, impacting market access and product development. Competitive substitutes include other RTD beverages like juices, carbonated soft drinks, and bottled water. End-user demographics show significant growth potential among younger consumers and health-conscious individuals. M&A activity has been moderate in recent years, with larger players strategically acquiring smaller companies to expand their product portfolios and market reach.
- Market Concentration: Moderately concentrated, with a mix of multinational and regional players. The top 5 players hold approximately xx% market share (2024).
- Technological Innovation: Focus on sustainable packaging, functional ingredients (e.g., vitamins, antioxidants), and innovative flavors.
- Regulatory Landscape: Varies across countries, impacting labeling requirements and ingredient approvals.
- Competitive Substitutes: Carbonated soft drinks, juices, bottled water, and other functional beverages.
- M&A Activity: Moderate level of mergers and acquisitions, primarily focused on market expansion and product diversification. xx M&A deals were recorded between 2019 and 2024.
APAC Ready-to-Drink Tea Industry Growth Trends & Insights
The APAC RTD tea market has experienced robust growth over the historical period (2019-2024), driven by increasing disposable incomes, changing lifestyles, and growing health consciousness. The market size reached xx million units in 2024, exhibiting a CAGR of xx% during this period. Adoption rates are highest in countries with established RTD beverage cultures, such as Japan and South Korea. Technological disruptions, particularly in e-commerce and online delivery platforms, are reshaping distribution channels and consumer access. Consumer behavior shifts towards premiumization and functional benefits are influencing product innovation and pricing strategies. The forecast period (2025-2033) anticipates continued growth, driven by increasing demand in emerging markets and the introduction of innovative products. Market penetration is expected to increase significantly in less developed markets across APAC.
Dominant Regions, Countries, or Segments in APAC Ready-to-Drink Tea Industry
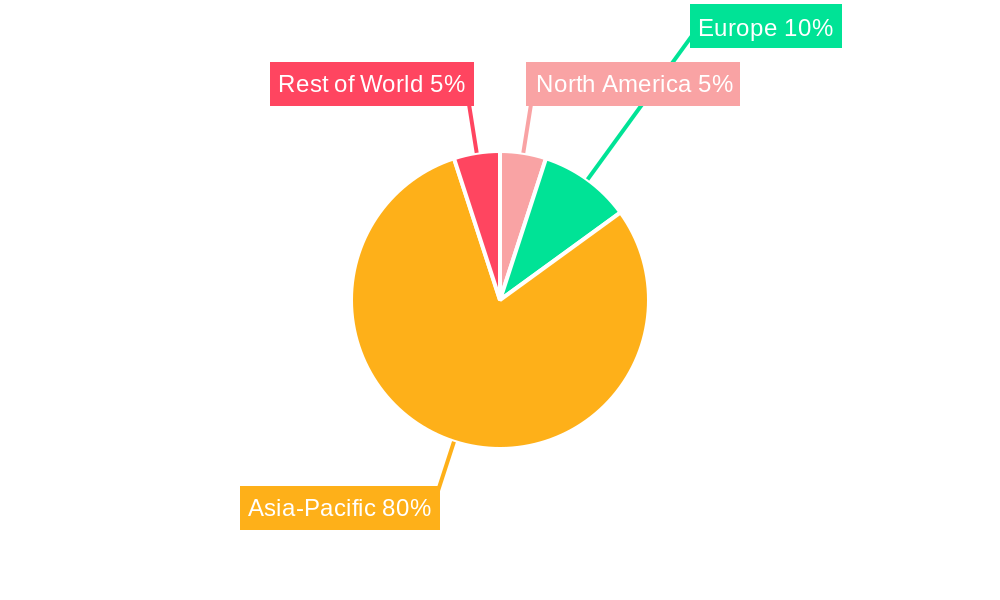
China and Japan are the dominant markets in the APAC RTD tea industry, contributing a significant share of overall market value. However, high growth potential exists in other regions such as India and Southeast Asia. Within segments, PET bottles are the dominant packaging type due to their cost-effectiveness and convenience. Green tea remains the leading soft drink type, followed by iced tea. The off-trade distribution channel dominates, with supermarkets, convenience stores, and hypermarkets being major retail outlets.
- China: Largest market, driven by high tea consumption and a large population base.
- Japan: Mature market with high per capita consumption and established brands.
- India: High growth potential fueled by increasing disposable incomes and changing consumer preferences.
- Southeast Asia: Significant growth opportunities due to rising urbanization and young population.
- PET Bottles: Leading packaging type due to affordability and convenience.
- Green Tea: Dominant soft drink type, owing to its health benefits and cultural significance.
- Off-trade: Primary distribution channel.
APAC Ready-to-Drink Tea Industry Product Landscape
Product innovation focuses on incorporating functional ingredients, such as vitamins, antioxidants, and probiotics, to enhance health benefits. New flavor profiles and packaging formats are also being introduced to cater to evolving consumer preferences. Companies are increasingly emphasizing sustainability through eco-friendly packaging materials and production processes. Key performance indicators include sales volume, market share, and consumer feedback.
Key Drivers, Barriers & Challenges in APAC Ready-to-Drink Tea Industry
Key Drivers: Rising disposable incomes, growing health consciousness, increasing urbanization, and expanding distribution networks are driving market growth. Technological advancements in packaging and production processes are also contributing to market expansion.
Challenges: Intense competition from established players and emerging brands, fluctuating raw material prices, and varying regulatory requirements across different countries pose significant challenges. Supply chain disruptions can significantly impact production and distribution.
Emerging Opportunities in APAP Ready-to-Drink Tea Industry
Untapped markets in smaller APAC countries present significant growth potential. Innovations such as organic and functional teas cater to growing health consciousness. E-commerce and direct-to-consumer models are transforming distribution and marketing strategies.
Growth Accelerators in the APAC Ready-to-Drink Tea Industry Industry
Technological advancements, strategic partnerships, and market expansion strategies are driving long-term growth. The focus on sustainable and eco-friendly practices also enhances brand appeal and market positioning.
Key Players Shaping the APAC Ready-to-Drink Tea Industry Market
- Ichitan Group PCL
- Nestle S A
- Asahi Group Holdings Ltd
- Ito En Ltd
- Nongfu Spring Co Ltd
- Tata Consumer Products Ltd
- PT Anggada Putra Rekso Mulia
- Suntory Holdings Limited
- JDB Group
- Tingyi (Cayman Islands) Holding Corporation
- The Coca-Cola Company
- Uni-President Enterprises Corp
- Kirin Holdings Company Limited
- Thai Beverages PCL
- Sapporo Holdings Limited
Notable Milestones in APAC Ready-to-Drink Tea Industry Sector
- November 2023: The Coca-Cola Company's ChaiChun brand opened a new store in Delhi, expanding its reach in India.
- September 2022: Coca-Cola launched Ayataka Cafe Matcha Latte in Japan.
- June 2021: Sermsuk launched "est Play plus vitamins B6 and B12," a vitamin-infused CSD.
In-Depth APAC Ready-to-Drink Tea Industry Market Outlook
The APAC RTD tea market is poised for continued growth, driven by increasing consumer demand for healthy and convenient beverages. Strategic partnerships, product diversification, and expansion into emerging markets will be crucial for maintaining market competitiveness. The focus on sustainable and innovative products will also play a key role in shaping the future of the industry.
APAC Ready-to-Drink Tea Industry Segmentation
-
1. Soft Drink Type
- 1.1. Green Tea
- 1.2. Herbal Tea
- 1.3. Iced Tea
- 1.4. Other RTD Tea
-
2. Packaging Type
- 2.1. Aseptic packages
- 2.2. Glass Bottles
- 2.3. Metal Can
- 2.4. PET Bottles
-
3. Distribution Channel
-
3.1. Off-trade
- 3.1.1. Convenience Stores
- 3.1.2. Online Retail
- 3.1.3. Supermarket/Hypermarket
- 3.1.4. Others
- 3.2. On-trade
-
3.1. Off-trade
APAC Ready-to-Drink Tea Industry Segmentation By Geography
-
1. North America
- 1.1. United States
- 1.2. Canada
- 1.3. Mexico
-
2. South America
- 2.1. Brazil
- 2.2. Argentina
- 2.3. Rest of South America
-
3. Europe
- 3.1. United Kingdom
- 3.2. Germany
- 3.3. France
- 3.4. Italy
- 3.5. Spain
- 3.6. Russia
- 3.7. Benelux
- 3.8. Nordics
- 3.9. Rest of Europe
-
4. Middle East & Africa
- 4.1. Turkey
- 4.2. Israel
- 4.3. GCC
- 4.4. North Africa
- 4.5. South Africa
- 4.6. Rest of Middle East & Africa
-
5. Asia Pacific
- 5.1. China
- 5.2. India
- 5.3. Japan
- 5.4. South Korea
- 5.5. ASEAN
- 5.6. Oceania
- 5.7. Rest of Asia Pacific
APAC Ready-to-Drink Tea Industry Regional Market Share
Geographic Coverage of APAC Ready-to-Drink Tea Industry
APAC Ready-to-Drink Tea Industry REPORT HIGHLIGHTS
| Aspects | Details |
|---|---|
| Study Period | 2020-2034 |
| Base Year | 2025 |
| Estimated Year | 2026 |
| Forecast Period | 2026-2034 |
| Historical Period | 2020-2025 |
| Growth Rate | CAGR of 4.2% from 2020-2034 |
| Segmentation |
|
Table of Contents
- 1. Introduction
- 1.1. Research Scope
- 1.2. Market Segmentation
- 1.3. Research Objective
- 1.4. Definitions and Assumptions
- 2. Executive Summary
- 2.1. Market Snapshot
- 3. Market Dynamics
- 3.1. Market Drivers
- 3.2. Market Restrains
- 3.3. Market Trends
- 3.4. Market Opportunities
- 4. Market Factor Analysis
- 4.1. Porters Five Forces
- 4.1.1. Bargaining Power of Suppliers
- 4.1.2. Bargaining Power of Buyers
- 4.1.3. Threat of New Entrants
- 4.1.4. Threat of Substitutes
- 4.1.5. Competitive Rivalry
- 4.2. PESTEL analysis
- 4.3. BCG Analysis
- 4.3.1. Stars (High Growth, High Market Share)
- 4.3.2. Cash Cows (Low Growth, High Market Share)
- 4.3.3. Question Mark (High Growth, Low Market Share)
- 4.3.4. Dogs (Low Growth, Low Market Share)
- 4.4. Ansoff Matrix Analysis
- 4.5. Supply Chain Analysis
- 4.6. Regulatory Landscape
- 4.7. Current Market Potential and Opportunity Assessment (TAM–SAM–SOM Framework)
- 4.8. NRP Analyst Note
- 4.1. Porters Five Forces
- 5. Market Analysis, Insights and Forecast 2021-2033
- 5.1. Market Analysis, Insights and Forecast - by Soft Drink Type
- 5.1.1. Green Tea
- 5.1.2. Herbal Tea
- 5.1.3. Iced Tea
- 5.1.4. Other RTD Tea
- 5.2. Market Analysis, Insights and Forecast - by Packaging Type
- 5.2.1. Aseptic packages
- 5.2.2. Glass Bottles
- 5.2.3. Metal Can
- 5.2.4. PET Bottles
- 5.3. Market Analysis, Insights and Forecast - by Distribution Channel
- 5.3.1. Off-trade
- 5.3.1.1. Convenience Stores
- 5.3.1.2. Online Retail
- 5.3.1.3. Supermarket/Hypermarket
- 5.3.1.4. Others
- 5.3.2. On-trade
- 5.3.1. Off-trade
- 5.4. Market Analysis, Insights and Forecast - by Region
- 5.4.1. North America
- 5.4.2. South America
- 5.4.3. Europe
- 5.4.4. Middle East & Africa
- 5.4.5. Asia Pacific
- 5.1. Market Analysis, Insights and Forecast - by Soft Drink Type
- 6. Global APAC Ready-to-Drink Tea Industry Analysis, Insights and Forecast, 2021-2033
- 6.1. Market Analysis, Insights and Forecast - by Soft Drink Type
- 6.1.1. Green Tea
- 6.1.2. Herbal Tea
- 6.1.3. Iced Tea
- 6.1.4. Other RTD Tea
- 6.2. Market Analysis, Insights and Forecast - by Packaging Type
- 6.2.1. Aseptic packages
- 6.2.2. Glass Bottles
- 6.2.3. Metal Can
- 6.2.4. PET Bottles
- 6.3. Market Analysis, Insights and Forecast - by Distribution Channel
- 6.3.1. Off-trade
- 6.3.1.1. Convenience Stores
- 6.3.1.2. Online Retail
- 6.3.1.3. Supermarket/Hypermarket
- 6.3.1.4. Others
- 6.3.2. On-trade
- 6.3.1. Off-trade
- 6.1. Market Analysis, Insights and Forecast - by Soft Drink Type
- 7. North America APAC Ready-to-Drink Tea Industry Analysis, Insights and Forecast, 2020-2032
- 7.1. Market Analysis, Insights and Forecast - by Soft Drink Type
- 7.1.1. Green Tea
- 7.1.2. Herbal Tea
- 7.1.3. Iced Tea
- 7.1.4. Other RTD Tea
- 7.2. Market Analysis, Insights and Forecast - by Packaging Type
- 7.2.1. Aseptic packages
- 7.2.2. Glass Bottles
- 7.2.3. Metal Can
- 7.2.4. PET Bottles
- 7.3. Market Analysis, Insights and Forecast - by Distribution Channel
- 7.3.1. Off-trade
- 7.3.1.1. Convenience Stores
- 7.3.1.2. Online Retail
- 7.3.1.3. Supermarket/Hypermarket
- 7.3.1.4. Others
- 7.3.2. On-trade
- 7.3.1. Off-trade
- 7.1. Market Analysis, Insights and Forecast - by Soft Drink Type
- 8. South America APAC Ready-to-Drink Tea Industry Analysis, Insights and Forecast, 2020-2032
- 8.1. Market Analysis, Insights and Forecast - by Soft Drink Type
- 8.1.1. Green Tea
- 8.1.2. Herbal Tea
- 8.1.3. Iced Tea
- 8.1.4. Other RTD Tea
- 8.2. Market Analysis, Insights and Forecast - by Packaging Type
- 8.2.1. Aseptic packages
- 8.2.2. Glass Bottles
- 8.2.3. Metal Can
- 8.2.4. PET Bottles
- 8.3. Market Analysis, Insights and Forecast - by Distribution Channel
- 8.3.1. Off-trade
- 8.3.1.1. Convenience Stores
- 8.3.1.2. Online Retail
- 8.3.1.3. Supermarket/Hypermarket
- 8.3.1.4. Others
- 8.3.2. On-trade
- 8.3.1. Off-trade
- 8.1. Market Analysis, Insights and Forecast - by Soft Drink Type
- 9. Europe APAC Ready-to-Drink Tea Industry Analysis, Insights and Forecast, 2020-2032
- 9.1. Market Analysis, Insights and Forecast - by Soft Drink Type
- 9.1.1. Green Tea
- 9.1.2. Herbal Tea
- 9.1.3. Iced Tea
- 9.1.4. Other RTD Tea
- 9.2. Market Analysis, Insights and Forecast - by Packaging Type
- 9.2.1. Aseptic packages
- 9.2.2. Glass Bottles
- 9.2.3. Metal Can
- 9.2.4. PET Bottles
- 9.3. Market Analysis, Insights and Forecast - by Distribution Channel
- 9.3.1. Off-trade
- 9.3.1.1. Convenience Stores
- 9.3.1.2. Online Retail
- 9.3.1.3. Supermarket/Hypermarket
- 9.3.1.4. Others
- 9.3.2. On-trade
- 9.3.1. Off-trade
- 9.1. Market Analysis, Insights and Forecast - by Soft Drink Type
- 10. Middle East & Africa APAC Ready-to-Drink Tea Industry Analysis, Insights and Forecast, 2020-2032
- 10.1. Market Analysis, Insights and Forecast - by Soft Drink Type
- 10.1.1. Green Tea
- 10.1.2. Herbal Tea
- 10.1.3. Iced Tea
- 10.1.4. Other RTD Tea
- 10.2. Market Analysis, Insights and Forecast - by Packaging Type
- 10.2.1. Aseptic packages
- 10.2.2. Glass Bottles
- 10.2.3. Metal Can
- 10.2.4. PET Bottles
- 10.3. Market Analysis, Insights and Forecast - by Distribution Channel
- 10.3.1. Off-trade
- 10.3.1.1. Convenience Stores
- 10.3.1.2. Online Retail
- 10.3.1.3. Supermarket/Hypermarket
- 10.3.1.4. Others
- 10.3.2. On-trade
- 10.3.1. Off-trade
- 10.1. Market Analysis, Insights and Forecast - by Soft Drink Type
- 11. Asia Pacific APAC Ready-to-Drink Tea Industry Analysis, Insights and Forecast, 2020-2032
- 11.1. Market Analysis, Insights and Forecast - by Soft Drink Type
- 11.1.1. Green Tea
- 11.1.2. Herbal Tea
- 11.1.3. Iced Tea
- 11.1.4. Other RTD Tea
- 11.2. Market Analysis, Insights and Forecast - by Packaging Type
- 11.2.1. Aseptic packages
- 11.2.2. Glass Bottles
- 11.2.3. Metal Can
- 11.2.4. PET Bottles
- 11.3. Market Analysis, Insights and Forecast - by Distribution Channel
- 11.3.1. Off-trade
- 11.3.1.1. Convenience Stores
- 11.3.1.2. Online Retail
- 11.3.1.3. Supermarket/Hypermarket
- 11.3.1.4. Others
- 11.3.2. On-trade
- 11.3.1. Off-trade
- 11.1. Market Analysis, Insights and Forecast - by Soft Drink Type
- 12. Competitive Analysis
- 12.1. Company Profiles
- 12.1.1 Ichitan Group PCL
- 12.1.1.1. Company Overview
- 12.1.1.2. Products
- 12.1.1.3. Company Financials
- 12.1.1.4. SWOT Analysis
- 12.1.2 Nestle S A
- 12.1.2.1. Company Overview
- 12.1.2.2. Products
- 12.1.2.3. Company Financials
- 12.1.2.4. SWOT Analysis
- 12.1.3 Asahi Group Holdings Ltd
- 12.1.3.1. Company Overview
- 12.1.3.2. Products
- 12.1.3.3. Company Financials
- 12.1.3.4. SWOT Analysis
- 12.1.4 Ito En Ltd
- 12.1.4.1. Company Overview
- 12.1.4.2. Products
- 12.1.4.3. Company Financials
- 12.1.4.4. SWOT Analysis
- 12.1.5 Nongfu Spring Co Ltd
- 12.1.5.1. Company Overview
- 12.1.5.2. Products
- 12.1.5.3. Company Financials
- 12.1.5.4. SWOT Analysis
- 12.1.6 Tata Consumer Products Ltd
- 12.1.6.1. Company Overview
- 12.1.6.2. Products
- 12.1.6.3. Company Financials
- 12.1.6.4. SWOT Analysis
- 12.1.7 PT Anggada Putra Rekso Mulia
- 12.1.7.1. Company Overview
- 12.1.7.2. Products
- 12.1.7.3. Company Financials
- 12.1.7.4. SWOT Analysis
- 12.1.8 Suntory Holdings Limited
- 12.1.8.1. Company Overview
- 12.1.8.2. Products
- 12.1.8.3. Company Financials
- 12.1.8.4. SWOT Analysis
- 12.1.9 JDB Group
- 12.1.9.1. Company Overview
- 12.1.9.2. Products
- 12.1.9.3. Company Financials
- 12.1.9.4. SWOT Analysis
- 12.1.10 Tingyi (Cayman Islands) Holding Corporation
- 12.1.10.1. Company Overview
- 12.1.10.2. Products
- 12.1.10.3. Company Financials
- 12.1.10.4. SWOT Analysis
- 12.1.11 The Coca-Cola Company
- 12.1.11.1. Company Overview
- 12.1.11.2. Products
- 12.1.11.3. Company Financials
- 12.1.11.4. SWOT Analysis
- 12.1.12 Uni-President Enterprises Corp
- 12.1.12.1. Company Overview
- 12.1.12.2. Products
- 12.1.12.3. Company Financials
- 12.1.12.4. SWOT Analysis
- 12.1.13 Kirin Holdings Company Limited
- 12.1.13.1. Company Overview
- 12.1.13.2. Products
- 12.1.13.3. Company Financials
- 12.1.13.4. SWOT Analysis
- 12.1.14 Thai Beverages PCL
- 12.1.14.1. Company Overview
- 12.1.14.2. Products
- 12.1.14.3. Company Financials
- 12.1.14.4. SWOT Analysis
- 12.1.15 Sapporo Holdings Limited
- 12.1.15.1. Company Overview
- 12.1.15.2. Products
- 12.1.15.3. Company Financials
- 12.1.15.4. SWOT Analysis
- 12.1.1 Ichitan Group PCL
- 12.2. Market Entropy
- 12.2.1 Company's Key Areas Served
- 12.2.2 Recent Developments
- 12.3. Company Market Share Analysis 2025
- 12.3.1 Top 5 Companies Market Share Analysis
- 12.3.2 Top 3 Companies Market Share Analysis
- 12.4. List of Potential Customers
- 13. Research Methodology
List of Figures
- Figure 1: Global APAC Ready-to-Drink Tea Industry Revenue Breakdown (billion, %) by Region 2025 & 2033
- Figure 2: North America APAC Ready-to-Drink Tea Industry Revenue (billion), by Soft Drink Type 2025 & 2033
- Figure 3: North America APAC Ready-to-Drink Tea Industry Revenue Share (%), by Soft Drink Type 2025 & 2033
- Figure 4: North America APAC Ready-to-Drink Tea Industry Revenue (billion), by Packaging Type 2025 & 2033
- Figure 5: North America APAC Ready-to-Drink Tea Industry Revenue Share (%), by Packaging Type 2025 & 2033
- Figure 6: North America APAC Ready-to-Drink Tea Industry Revenue (billion), by Distribution Channel 2025 & 2033
- Figure 7: North America APAC Ready-to-Drink Tea Industry Revenue Share (%), by Distribution Channel 2025 & 2033
- Figure 8: North America APAC Ready-to-Drink Tea Industry Revenue (billion), by Country 2025 & 2033
- Figure 9: North America APAC Ready-to-Drink Tea Industry Revenue Share (%), by Country 2025 & 2033
- Figure 10: South America APAC Ready-to-Drink Tea Industry Revenue (billion), by Soft Drink Type 2025 & 2033
- Figure 11: South America APAC Ready-to-Drink Tea Industry Revenue Share (%), by Soft Drink Type 2025 & 2033
- Figure 12: South America APAC Ready-to-Drink Tea Industry Revenue (billion), by Packaging Type 2025 & 2033
- Figure 13: South America APAC Ready-to-Drink Tea Industry Revenue Share (%), by Packaging Type 2025 & 2033
- Figure 14: South America APAC Ready-to-Drink Tea Industry Revenue (billion), by Distribution Channel 2025 & 2033
- Figure 15: South America APAC Ready-to-Drink Tea Industry Revenue Share (%), by Distribution Channel 2025 & 2033
- Figure 16: South America APAC Ready-to-Drink Tea Industry Revenue (billion), by Country 2025 & 2033
- Figure 17: South America APAC Ready-to-Drink Tea Industry Revenue Share (%), by Country 2025 & 2033
- Figure 18: Europe APAC Ready-to-Drink Tea Industry Revenue (billion), by Soft Drink Type 2025 & 2033
- Figure 19: Europe APAC Ready-to-Drink Tea Industry Revenue Share (%), by Soft Drink Type 2025 & 2033
- Figure 20: Europe APAC Ready-to-Drink Tea Industry Revenue (billion), by Packaging Type 2025 & 2033
- Figure 21: Europe APAC Ready-to-Drink Tea Industry Revenue Share (%), by Packaging Type 2025 & 2033
- Figure 22: Europe APAC Ready-to-Drink Tea Industry Revenue (billion), by Distribution Channel 2025 & 2033
- Figure 23: Europe APAC Ready-to-Drink Tea Industry Revenue Share (%), by Distribution Channel 2025 & 2033
- Figure 24: Europe APAC Ready-to-Drink Tea Industry Revenue (billion), by Country 2025 & 2033
- Figure 25: Europe APAC Ready-to-Drink Tea Industry Revenue Share (%), by Country 2025 & 2033
- Figure 26: Middle East & Africa APAC Ready-to-Drink Tea Industry Revenue (billion), by Soft Drink Type 2025 & 2033
- Figure 27: Middle East & Africa APAC Ready-to-Drink Tea Industry Revenue Share (%), by Soft Drink Type 2025 & 2033
- Figure 28: Middle East & Africa APAC Ready-to-Drink Tea Industry Revenue (billion), by Packaging Type 2025 & 2033
- Figure 29: Middle East & Africa APAC Ready-to-Drink Tea Industry Revenue Share (%), by Packaging Type 2025 & 2033
- Figure 30: Middle East & Africa APAC Ready-to-Drink Tea Industry Revenue (billion), by Distribution Channel 2025 & 2033
- Figure 31: Middle East & Africa APAC Ready-to-Drink Tea Industry Revenue Share (%), by Distribution Channel 2025 & 2033
- Figure 32: Middle East & Africa APAC Ready-to-Drink Tea Industry Revenue (billion), by Country 2025 & 2033
- Figure 33: Middle East & Africa APAC Ready-to-Drink Tea Industry Revenue Share (%), by Country 2025 & 2033
- Figure 34: Asia Pacific APAC Ready-to-Drink Tea Industry Revenue (billion), by Soft Drink Type 2025 & 2033
- Figure 35: Asia Pacific APAC Ready-to-Drink Tea Industry Revenue Share (%), by Soft Drink Type 2025 & 2033
- Figure 36: Asia Pacific APAC Ready-to-Drink Tea Industry Revenue (billion), by Packaging Type 2025 & 2033
- Figure 37: Asia Pacific APAC Ready-to-Drink Tea Industry Revenue Share (%), by Packaging Type 2025 & 2033
- Figure 38: Asia Pacific APAC Ready-to-Drink Tea Industry Revenue (billion), by Distribution Channel 2025 & 2033
- Figure 39: Asia Pacific APAC Ready-to-Drink Tea Industry Revenue Share (%), by Distribution Channel 2025 & 2033
- Figure 40: Asia Pacific APAC Ready-to-Drink Tea Industry Revenue (billion), by Country 2025 & 2033
- Figure 41: Asia Pacific APAC Ready-to-Drink Tea Industry Revenue Share (%), by Country 2025 & 2033
List of Tables
- Table 1: Global APAC Ready-to-Drink Tea Industry Revenue billion Forecast, by Soft Drink Type 2020 & 2033
- Table 2: Global APAC Ready-to-Drink Tea Industry Revenue billion Forecast, by Packaging Type 2020 & 2033
- Table 3: Global APAC Ready-to-Drink Tea Industry Revenue billion Forecast, by Distribution Channel 2020 & 2033
- Table 4: Global APAC Ready-to-Drink Tea Industry Revenue billion Forecast, by Region 2020 & 2033
- Table 5: Global APAC Ready-to-Drink Tea Industry Revenue billion Forecast, by Soft Drink Type 2020 & 2033
- Table 6: Global APAC Ready-to-Drink Tea Industry Revenue billion Forecast, by Packaging Type 2020 & 2033
- Table 7: Global APAC Ready-to-Drink Tea Industry Revenue billion Forecast, by Distribution Channel 2020 & 2033
- Table 8: Global APAC Ready-to-Drink Tea Industry Revenue billion Forecast, by Country 2020 & 2033
- Table 9: United States APAC Ready-to-Drink Tea Industry Revenue (billion) Forecast, by Application 2020 & 2033
- Table 10: Canada APAC Ready-to-Drink Tea Industry Revenue (billion) Forecast, by Application 2020 & 2033
- Table 11: Mexico APAC Ready-to-Drink Tea Industry Revenue (billion) Forecast, by Application 2020 & 2033
- Table 12: Global APAC Ready-to-Drink Tea Industry Revenue billion Forecast, by Soft Drink Type 2020 & 2033
- Table 13: Global APAC Ready-to-Drink Tea Industry Revenue billion Forecast, by Packaging Type 2020 & 2033
- Table 14: Global APAC Ready-to-Drink Tea Industry Revenue billion Forecast, by Distribution Channel 2020 & 2033
- Table 15: Global APAC Ready-to-Drink Tea Industry Revenue billion Forecast, by Country 2020 & 2033
- Table 16: Brazil APAC Ready-to-Drink Tea Industry Revenue (billion) Forecast, by Application 2020 & 2033
- Table 17: Argentina APAC Ready-to-Drink Tea Industry Revenue (billion) Forecast, by Application 2020 & 2033
- Table 18: Rest of South America APAC Ready-to-Drink Tea Industry Revenue (billion) Forecast, by Application 2020 & 2033
- Table 19: Global APAC Ready-to-Drink Tea Industry Revenue billion Forecast, by Soft Drink Type 2020 & 2033
- Table 20: Global APAC Ready-to-Drink Tea Industry Revenue billion Forecast, by Packaging Type 2020 & 2033
- Table 21: Global APAC Ready-to-Drink Tea Industry Revenue billion Forecast, by Distribution Channel 2020 & 2033
- Table 22: Global APAC Ready-to-Drink Tea Industry Revenue billion Forecast, by Country 2020 & 2033
- Table 23: United Kingdom APAC Ready-to-Drink Tea Industry Revenue (billion) Forecast, by Application 2020 & 2033
- Table 24: Germany APAC Ready-to-Drink Tea Industry Revenue (billion) Forecast, by Application 2020 & 2033
- Table 25: France APAC Ready-to-Drink Tea Industry Revenue (billion) Forecast, by Application 2020 & 2033
- Table 26: Italy APAC Ready-to-Drink Tea Industry Revenue (billion) Forecast, by Application 2020 & 2033
- Table 27: Spain APAC Ready-to-Drink Tea Industry Revenue (billion) Forecast, by Application 2020 & 2033
- Table 28: Russia APAC Ready-to-Drink Tea Industry Revenue (billion) Forecast, by Application 2020 & 2033
- Table 29: Benelux APAC Ready-to-Drink Tea Industry Revenue (billion) Forecast, by Application 2020 & 2033
- Table 30: Nordics APAC Ready-to-Drink Tea Industry Revenue (billion) Forecast, by Application 2020 & 2033
- Table 31: Rest of Europe APAC Ready-to-Drink Tea Industry Revenue (billion) Forecast, by Application 2020 & 2033
- Table 32: Global APAC Ready-to-Drink Tea Industry Revenue billion Forecast, by Soft Drink Type 2020 & 2033
- Table 33: Global APAC Ready-to-Drink Tea Industry Revenue billion Forecast, by Packaging Type 2020 & 2033
- Table 34: Global APAC Ready-to-Drink Tea Industry Revenue billion Forecast, by Distribution Channel 2020 & 2033
- Table 35: Global APAC Ready-to-Drink Tea Industry Revenue billion Forecast, by Country 2020 & 2033
- Table 36: Turkey APAC Ready-to-Drink Tea Industry Revenue (billion) Forecast, by Application 2020 & 2033
- Table 37: Israel APAC Ready-to-Drink Tea Industry Revenue (billion) Forecast, by Application 2020 & 2033
- Table 38: GCC APAC Ready-to-Drink Tea Industry Revenue (billion) Forecast, by Application 2020 & 2033
- Table 39: North Africa APAC Ready-to-Drink Tea Industry Revenue (billion) Forecast, by Application 2020 & 2033
- Table 40: South Africa APAC Ready-to-Drink Tea Industry Revenue (billion) Forecast, by Application 2020 & 2033
- Table 41: Rest of Middle East & Africa APAC Ready-to-Drink Tea Industry Revenue (billion) Forecast, by Application 2020 & 2033
- Table 42: Global APAC Ready-to-Drink Tea Industry Revenue billion Forecast, by Soft Drink Type 2020 & 2033
- Table 43: Global APAC Ready-to-Drink Tea Industry Revenue billion Forecast, by Packaging Type 2020 & 2033
- Table 44: Global APAC Ready-to-Drink Tea Industry Revenue billion Forecast, by Distribution Channel 2020 & 2033
- Table 45: Global APAC Ready-to-Drink Tea Industry Revenue billion Forecast, by Country 2020 & 2033
- Table 46: China APAC Ready-to-Drink Tea Industry Revenue (billion) Forecast, by Application 2020 & 2033
- Table 47: India APAC Ready-to-Drink Tea Industry Revenue (billion) Forecast, by Application 2020 & 2033
- Table 48: Japan APAC Ready-to-Drink Tea Industry Revenue (billion) Forecast, by Application 2020 & 2033
- Table 49: South Korea APAC Ready-to-Drink Tea Industry Revenue (billion) Forecast, by Application 2020 & 2033
- Table 50: ASEAN APAC Ready-to-Drink Tea Industry Revenue (billion) Forecast, by Application 2020 & 2033
- Table 51: Oceania APAC Ready-to-Drink Tea Industry Revenue (billion) Forecast, by Application 2020 & 2033
- Table 52: Rest of Asia Pacific APAC Ready-to-Drink Tea Industry Revenue (billion) Forecast, by Application 2020 & 2033
Frequently Asked Questions
1. What is the projected Compound Annual Growth Rate (CAGR) of the APAC Ready-to-Drink Tea Industry?
The projected CAGR is approximately 4.2%.
2. Which companies are prominent players in the APAC Ready-to-Drink Tea Industry?
Key companies in the market include Ichitan Group PCL, Nestle S A, Asahi Group Holdings Ltd, Ito En Ltd, Nongfu Spring Co Ltd, Tata Consumer Products Ltd, PT Anggada Putra Rekso Mulia, Suntory Holdings Limited, JDB Group, Tingyi (Cayman Islands) Holding Corporation, The Coca-Cola Company, Uni-President Enterprises Corp, Kirin Holdings Company Limited, Thai Beverages PCL, Sapporo Holdings Limited.
3. What are the main segments of the APAC Ready-to-Drink Tea Industry?
The market segments include Soft Drink Type, Packaging Type, Distribution Channel.
4. Can you provide details about the market size?
The market size is estimated to be USD 51.8 billion as of 2022.
5. What are some drivers contributing to market growth?
Rising Trend of Ingestible Beauty Products; Growing demand for Nutrient-Enriched Cosmetic Products.
6. What are the notable trends driving market growth?
OTHER KEY INDUSTRY TRENDS COVERED IN THE REPORT.
7. Are there any restraints impacting market growth?
Availability of Counterfeit Beauty Supplements Products.
8. Can you provide examples of recent developments in the market?
November 2023: The Coca-Cola Company's brand ChaiChun brought exquisite teas to Delhi with its new store, The ChaiChun Store, expanding its business.September 2022: Ayataka, a brand of iced green tea produced by Coca-Cola, has announced the release of its new Ayataka Cafe Matcha Latte which will hit stores across JapanJune 2021: Sermsuk launched “est Play plus vitamins B6 and B12”, a vitamin-infused carbonated soft drink (CSD) certified by “Healthier Choice” nutritional logo.
9. What pricing options are available for accessing the report?
Pricing options include single-user, multi-user, and enterprise licenses priced at USD 3800, USD 4500, and USD 5800 respectively.
10. Is the market size provided in terms of value or volume?
The market size is provided in terms of value, measured in billion.
11. Are there any specific market keywords associated with the report?
Yes, the market keyword associated with the report is "APAC Ready-to-Drink Tea Industry," which aids in identifying and referencing the specific market segment covered.
12. How do I determine which pricing option suits my needs best?
The pricing options vary based on user requirements and access needs. Individual users may opt for single-user licenses, while businesses requiring broader access may choose multi-user or enterprise licenses for cost-effective access to the report.
13. Are there any additional resources or data provided in the APAC Ready-to-Drink Tea Industry report?
While the report offers comprehensive insights, it's advisable to review the specific contents or supplementary materials provided to ascertain if additional resources or data are available.
14. How can I stay updated on further developments or reports in the APAC Ready-to-Drink Tea Industry?
To stay informed about further developments, trends, and reports in the APAC Ready-to-Drink Tea Industry, consider subscribing to industry newsletters, following relevant companies and organizations, or regularly checking reputable industry news sources and publications.
Methodology
Step 1 - Identification of Relevant Samples Size from Population Database


Step 2 - Approaches for Defining Global Market Size (Value, Volume* & Price*)

Note*: In applicable scenarios
Step 3 - Data Sources
Primary Research
- Web Analytics
- Survey Reports
- Research Institute
- Latest Research Reports
- Opinion Leaders
Secondary Research
- Annual Reports
- White Paper
- Latest Press Release
- Industry Association
- Paid Database
- Investor Presentations

Step 4 - Data Triangulation
Involves using different sources of information in order to increase the validity of a study
These sources are likely to be stakeholders in a program - participants, other researchers, program staff, other community members, and so on.
Then we put all data in single framework & apply various statistical tools to find out the dynamic on the market.
During the analysis stage, feedback from the stakeholder groups would be compared to determine areas of agreement as well as areas of divergence