

Key Insights
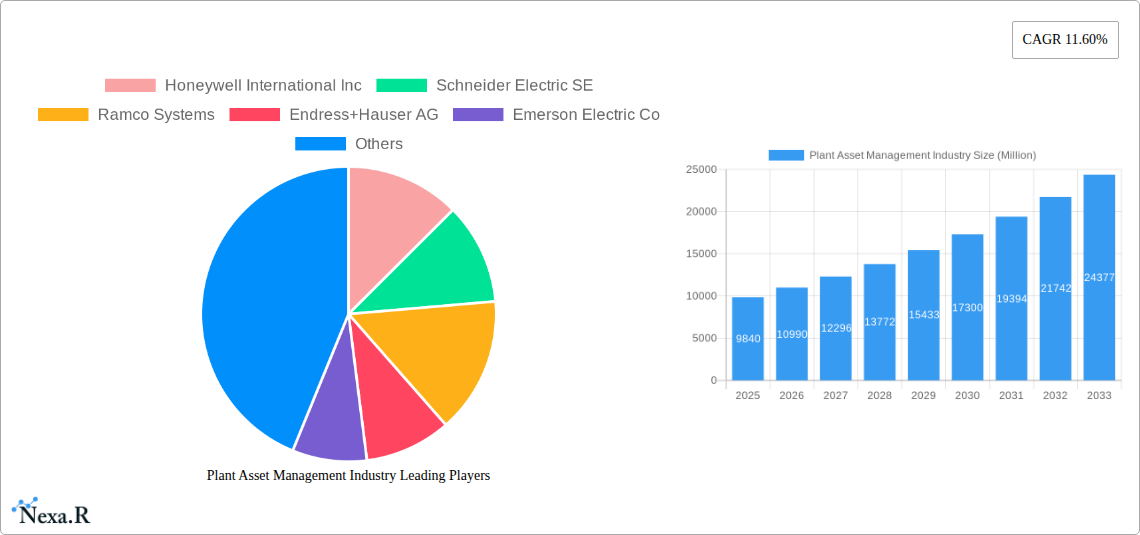
The Plant Asset Management (PAM) industry is experiencing robust growth, projected to reach a market size of $9.84 billion in 2025, expanding at a Compound Annual Growth Rate (CAGR) of 11.60%. This growth is driven by several key factors. Increasing pressure on industrial companies to optimize operational efficiency and reduce downtime is fueling adoption of advanced PAM solutions. The integration of IoT sensors, AI-powered predictive maintenance, and cloud-based platforms are enabling better asset tracking, performance monitoring, and proactive maintenance scheduling, leading to significant cost savings and improved operational reliability. Furthermore, stringent regulatory compliance requirements across sectors like energy, oil & gas, and manufacturing are driving the need for robust PAM systems to ensure safety, environmental protection, and regulatory adherence. The shift towards digital transformation and Industry 4.0 initiatives also significantly contributes to the market expansion. Growth is particularly strong in regions such as North America and Asia Pacific, driven by early adoption of new technologies and high concentration of industrial operations.
The PAM market is segmented by deployment (on-premise and cloud), end-user industry (energy & power, oil & gas, petrochemical, mining & metals, aerospace & defense, automotive, and others), and offerings (software and services). The cloud-based deployment model is gaining traction due to its scalability, flexibility, and reduced upfront investment costs. Within end-user industries, energy & power and oil & gas sectors are major drivers of growth, fueled by the increasing complexity of their assets and the need for improved operational efficiency. The services segment is experiencing faster growth compared to software, driven by the need for consulting, implementation, and maintenance support. Major players like Honeywell, Schneider Electric, and Siemens are actively expanding their PAM portfolios through strategic partnerships, acquisitions, and continuous innovation, further driving market competition and growth. While market growth faces potential restraints such as high initial implementation costs and the need for skilled personnel, the long-term benefits of improved asset performance and reduced operational expenses are expected to outweigh these challenges.
Plant Asset Management Industry Market Report: 2019-2033
This comprehensive report provides a detailed analysis of the Plant Asset Management (PAM) industry, encompassing market dynamics, growth trends, regional segmentation, product landscape, key players, and future outlook. With a study period spanning 2019-2033, a base year of 2025, and a forecast period of 2025-2033, this report offers invaluable insights for industry professionals, investors, and strategic decision-makers. The report segments the market by deployment (On-Premise, Cloud), end-user (Energy and Power, Oil & Gas, Petrochemical, Mining & Metal, Aerospace & Defense, Automotive, Other End-Users), and offerings (Software, Services). The total market size is predicted to reach xx Million by 2033.
Plant Asset Management Industry Market Dynamics & Structure
The Plant Asset Management market is characterized by a moderately concentrated landscape, with key players like Honeywell, Schneider Electric, and Siemens holding significant market share. Technological innovation, driven by advancements in IoT, AI, and cloud computing, is a primary growth driver. Stringent regulatory frameworks concerning asset safety and operational efficiency further shape market dynamics. Competitive substitutes, such as traditional manual asset tracking methods, are gradually being replaced by integrated PAM solutions. The end-user demographics are diverse, with a strong presence across energy, manufacturing, and infrastructure sectors. M&A activity is relatively high, with an estimated xx Million in deal value in 2024, reflecting industry consolidation and expansion efforts.
- Market Concentration: Moderately concentrated, with top 5 players holding approximately 55% market share in 2024.
- Technological Innovation: IoT, AI, and cloud technologies are driving adoption of advanced PAM solutions.
- Regulatory Frameworks: Stringent safety and efficiency regulations are boosting demand for compliant PAM systems.
- Competitive Substitutes: Traditional manual methods are being replaced by automated PAM solutions.
- M&A Trends: Significant M&A activity with an estimated xx Million in deal value in 2024.
Plant Asset Management Industry Growth Trends & Insights
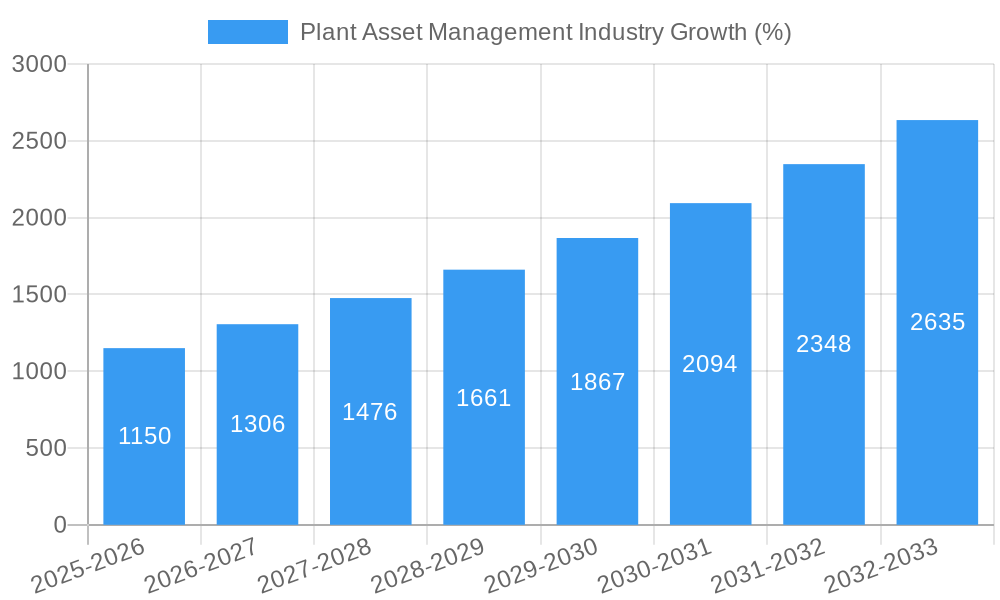
The PAM market experienced robust growth during the historical period (2019-2024), driven by increasing demand for optimized asset management across various industries. The market size reached xx Million in 2024, exhibiting a CAGR of xx% during this period. The cloud-based deployment segment is showing the fastest growth, driven by scalability, cost-effectiveness, and accessibility. Technological disruptions, including the rise of predictive maintenance and digital twins, are revolutionizing PAM practices. Shifting consumer behavior toward data-driven decision-making further fuels market growth. The forecast period (2025-2033) anticipates a continued expansion, reaching an estimated xx Million by 2033, with a projected CAGR of xx%. Market penetration is expected to increase significantly, particularly in emerging economies.
Dominant Regions, Countries, or Segments in Plant Asset Management Industry
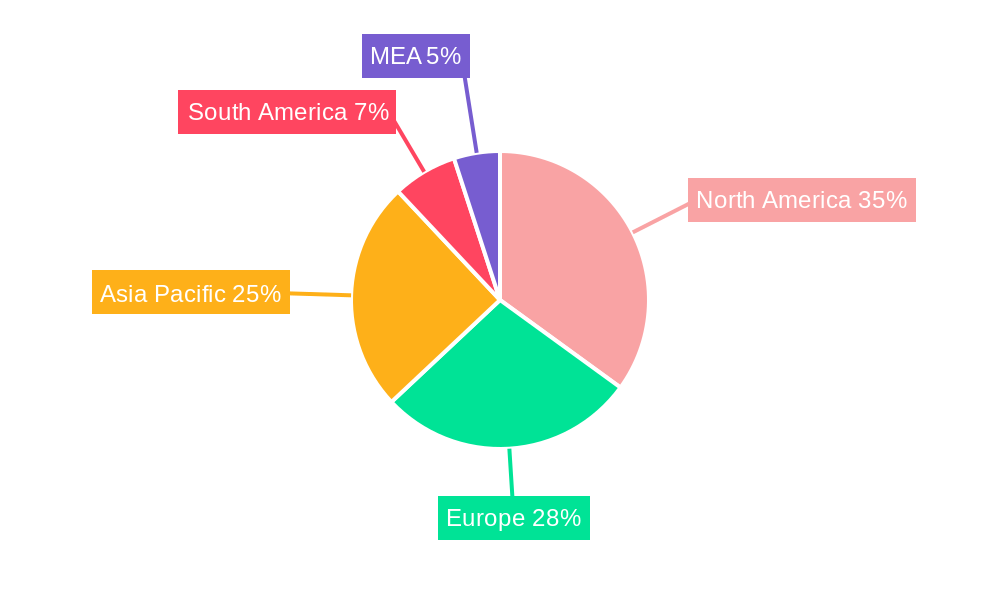
North America currently holds the largest market share in the PAM industry, driven by high technological adoption rates and a strong presence of key players. Within the deployment segment, the cloud-based PAM market is exhibiting the fastest growth rate globally, propelled by cost savings, enhanced accessibility, and improved collaboration features. The Energy and Power sector emerges as the leading end-user, due to the critical need for efficient asset management in power generation and distribution.
- Key Drivers: Strong government support for infrastructure development, increasing energy demand, and technological advancements.
- Dominance Factors: High technological adoption rates in North America and growing industrialization in Asia-Pacific.
- Growth Potential: Significant growth potential in developing economies driven by infrastructure investments.
Plant Asset Management Industry Product Landscape
The PAM product landscape is evolving rapidly, with a focus on integrated solutions incorporating IoT, AI, and advanced analytics. Products range from basic asset tracking systems to sophisticated platforms offering predictive maintenance, real-time monitoring, and performance optimization capabilities. Key features include enhanced data visualization, streamlined workflows, and robust reporting functionalities. Unique selling propositions often center on ease of integration, scalability, and cost-effectiveness.
Key Drivers, Barriers & Challenges in Plant Asset Management Industry
Key Drivers: The increasing need for operational efficiency, regulatory compliance, and reduced downtime are major drivers. Advancements in IoT, AI, and cloud technologies further propel market growth. Government initiatives promoting digital transformation in industries also contribute.
Challenges: High initial investment costs, integration complexities with existing systems, and cybersecurity concerns pose significant barriers to adoption. Supply chain disruptions and skill gaps in specialized workforce can also hamper market growth. The competitive landscape, with numerous established players and emerging startups, adds to the complexity.
Emerging Opportunities in Plant Asset Management Industry
Emerging opportunities lie in expanding into untapped markets like developing economies, integrating AR/VR technologies for enhanced asset visualization and maintenance, and developing specialized PAM solutions for specific industries such as renewable energy. The focus on sustainability and decarbonization creates further opportunities for developing green PAM solutions. The integration of advanced analytics and AI for predictive maintenance is also a major area of opportunity.
Growth Accelerators in the Plant Asset Management Industry
Technological advancements, particularly in AI and machine learning for predictive maintenance, are major catalysts for long-term growth. Strategic partnerships between PAM providers and industry players facilitate wider adoption. Government initiatives promoting digitalization across industries further accelerate market expansion.
Key Players Shaping the Plant Asset Management Industry Market
- Honeywell International Inc
- Schneider Electric SE
- Ramco Systems
- Endress+Hauser AG
- Emerson Electric Co
- Siemens AG
- General Electric Co
- SFK Group
- ABB Group
- Rockwell Automation Inc
Notable Milestones in Plant Asset Management Industry Sector
- December 2022: Amazon Web Services (AWS) launched Visual Asset Management System (VAMS).
- December 2022: Atrack Technology launched the AS500 asset tracker.
- February 2023: Fieldman introduced a GIS-based Work and Asset Management system.
In-Depth Plant Asset Management Industry Market Outlook
The PAM market is poised for significant growth in the coming years, driven by the convergence of technological advancements, increasing demand for operational efficiency, and supportive regulatory frameworks. Strategic partnerships and expansions into new markets will further fuel this growth, creating substantial opportunities for established players and new entrants alike. The focus on sustainability and digital transformation across industries will continue to shape the future of PAM, leading to the development of innovative and impactful solutions.
Plant Asset Management Industry Segmentation
-
1. Offerings
- 1.1. Software
- 1.2. Services
-
2. Deployment
- 2.1. On-Premise
- 2.2. Cloud
-
3. End-User
- 3.1. Energy and Power
- 3.2. Oil & Gas
- 3.3. Petrochemical
- 3.4. Mining & Metal
- 3.5. Aerospace & Defense
- 3.6. Automotive
- 3.7. Other End-Users
Plant Asset Management Industry Segmentation By Geography
- 1. North America
- 2. Europe
- 3. Asia Pacific
- 4. Latin America
- 5. Middle East and Africa
Plant Asset Management Industry REPORT HIGHLIGHTS
| Aspects | Details |
|---|---|
| Study Period | 2019-2033 |
| Base Year | 2024 |
| Estimated Year | 2025 |
| Forecast Period | 2025-2033 |
| Historical Period | 2019-2024 |
| Growth Rate | CAGR of 11.60% from 2019-2033 |
| Segmentation |
|
Table of Contents
- 1. Introduction
- 1.1. Research Scope
- 1.2. Market Segmentation
- 1.3. Research Methodology
- 1.4. Definitions and Assumptions
- 2. Executive Summary
- 2.1. Introduction
- 3. Market Dynamics
- 3.1. Introduction
- 3.2. Market Drivers
- 3.2.1. Adoption Of Real-Time Data Analytics; Adoption of Lean Manufacturing Practices
- 3.3. Market Restrains
- 3.3.1. Lack of Skilled Personnel
- 3.4. Market Trends
- 3.4.1. Oil and Gas Accounts For Significant Market Growth
- 4. Market Factor Analysis
- 4.1. Porters Five Forces
- 4.2. Supply/Value Chain
- 4.3. PESTEL analysis
- 4.4. Market Entropy
- 4.5. Patent/Trademark Analysis
- 5. Global Plant Asset Management Industry Analysis, Insights and Forecast, 2019-2031
- 5.1. Market Analysis, Insights and Forecast - by Offerings
- 5.1.1. Software
- 5.1.2. Services
- 5.2. Market Analysis, Insights and Forecast - by Deployment
- 5.2.1. On-Premise
- 5.2.2. Cloud
- 5.3. Market Analysis, Insights and Forecast - by End-User
- 5.3.1. Energy and Power
- 5.3.2. Oil & Gas
- 5.3.3. Petrochemical
- 5.3.4. Mining & Metal
- 5.3.5. Aerospace & Defense
- 5.3.6. Automotive
- 5.3.7. Other End-Users
- 5.4. Market Analysis, Insights and Forecast - by Region
- 5.4.1. North America
- 5.4.2. Europe
- 5.4.3. Asia Pacific
- 5.4.4. Latin America
- 5.4.5. Middle East and Africa
- 5.1. Market Analysis, Insights and Forecast - by Offerings
- 6. North America Plant Asset Management Industry Analysis, Insights and Forecast, 2019-2031
- 6.1. Market Analysis, Insights and Forecast - by Offerings
- 6.1.1. Software
- 6.1.2. Services
- 6.2. Market Analysis, Insights and Forecast - by Deployment
- 6.2.1. On-Premise
- 6.2.2. Cloud
- 6.3. Market Analysis, Insights and Forecast - by End-User
- 6.3.1. Energy and Power
- 6.3.2. Oil & Gas
- 6.3.3. Petrochemical
- 6.3.4. Mining & Metal
- 6.3.5. Aerospace & Defense
- 6.3.6. Automotive
- 6.3.7. Other End-Users
- 6.1. Market Analysis, Insights and Forecast - by Offerings
- 7. Europe Plant Asset Management Industry Analysis, Insights and Forecast, 2019-2031
- 7.1. Market Analysis, Insights and Forecast - by Offerings
- 7.1.1. Software
- 7.1.2. Services
- 7.2. Market Analysis, Insights and Forecast - by Deployment
- 7.2.1. On-Premise
- 7.2.2. Cloud
- 7.3. Market Analysis, Insights and Forecast - by End-User
- 7.3.1. Energy and Power
- 7.3.2. Oil & Gas
- 7.3.3. Petrochemical
- 7.3.4. Mining & Metal
- 7.3.5. Aerospace & Defense
- 7.3.6. Automotive
- 7.3.7. Other End-Users
- 7.1. Market Analysis, Insights and Forecast - by Offerings
- 8. Asia Pacific Plant Asset Management Industry Analysis, Insights and Forecast, 2019-2031
- 8.1. Market Analysis, Insights and Forecast - by Offerings
- 8.1.1. Software
- 8.1.2. Services
- 8.2. Market Analysis, Insights and Forecast - by Deployment
- 8.2.1. On-Premise
- 8.2.2. Cloud
- 8.3. Market Analysis, Insights and Forecast - by End-User
- 8.3.1. Energy and Power
- 8.3.2. Oil & Gas
- 8.3.3. Petrochemical
- 8.3.4. Mining & Metal
- 8.3.5. Aerospace & Defense
- 8.3.6. Automotive
- 8.3.7. Other End-Users
- 8.1. Market Analysis, Insights and Forecast - by Offerings
- 9. Latin America Plant Asset Management Industry Analysis, Insights and Forecast, 2019-2031
- 9.1. Market Analysis, Insights and Forecast - by Offerings
- 9.1.1. Software
- 9.1.2. Services
- 9.2. Market Analysis, Insights and Forecast - by Deployment
- 9.2.1. On-Premise
- 9.2.2. Cloud
- 9.3. Market Analysis, Insights and Forecast - by End-User
- 9.3.1. Energy and Power
- 9.3.2. Oil & Gas
- 9.3.3. Petrochemical
- 9.3.4. Mining & Metal
- 9.3.5. Aerospace & Defense
- 9.3.6. Automotive
- 9.3.7. Other End-Users
- 9.1. Market Analysis, Insights and Forecast - by Offerings
- 10. Middle East and Africa Plant Asset Management Industry Analysis, Insights and Forecast, 2019-2031
- 10.1. Market Analysis, Insights and Forecast - by Offerings
- 10.1.1. Software
- 10.1.2. Services
- 10.2. Market Analysis, Insights and Forecast - by Deployment
- 10.2.1. On-Premise
- 10.2.2. Cloud
- 10.3. Market Analysis, Insights and Forecast - by End-User
- 10.3.1. Energy and Power
- 10.3.2. Oil & Gas
- 10.3.3. Petrochemical
- 10.3.4. Mining & Metal
- 10.3.5. Aerospace & Defense
- 10.3.6. Automotive
- 10.3.7. Other End-Users
- 10.1. Market Analysis, Insights and Forecast - by Offerings
- 11. North America Plant Asset Management Industry Analysis, Insights and Forecast, 2019-2031
- 11.1. Market Analysis, Insights and Forecast - By Country/Sub-region
- 11.1.1 United States
- 11.1.2 Canada
- 11.1.3 Mexico
- 12. Europe Plant Asset Management Industry Analysis, Insights and Forecast, 2019-2031
- 12.1. Market Analysis, Insights and Forecast - By Country/Sub-region
- 12.1.1 Germany
- 12.1.2 United Kingdom
- 12.1.3 France
- 12.1.4 Spain
- 12.1.5 Italy
- 12.1.6 Spain
- 12.1.7 Belgium
- 12.1.8 Netherland
- 12.1.9 Nordics
- 12.1.10 Rest of Europe
- 13. Asia Pacific Plant Asset Management Industry Analysis, Insights and Forecast, 2019-2031
- 13.1. Market Analysis, Insights and Forecast - By Country/Sub-region
- 13.1.1 China
- 13.1.2 Japan
- 13.1.3 India
- 13.1.4 South Korea
- 13.1.5 Southeast Asia
- 13.1.6 Australia
- 13.1.7 Indonesia
- 13.1.8 Phillipes
- 13.1.9 Singapore
- 13.1.10 Thailandc
- 13.1.11 Rest of Asia Pacific
- 14. South America Plant Asset Management Industry Analysis, Insights and Forecast, 2019-2031
- 14.1. Market Analysis, Insights and Forecast - By Country/Sub-region
- 14.1.1 Brazil
- 14.1.2 Argentina
- 14.1.3 Peru
- 14.1.4 Chile
- 14.1.5 Colombia
- 14.1.6 Ecuador
- 14.1.7 Venezuela
- 14.1.8 Rest of South America
- 15. MEA Plant Asset Management Industry Analysis, Insights and Forecast, 2019-2031
- 15.1. Market Analysis, Insights and Forecast - By Country/Sub-region
- 15.1.1 United Arab Emirates
- 15.1.2 Saudi Arabia
- 15.1.3 South Africa
- 15.1.4 Rest of Middle East and Africa
- 16. Competitive Analysis
- 16.1. Global Market Share Analysis 2024
- 16.2. Company Profiles
- 16.2.1 Honeywell International Inc
- 16.2.1.1. Overview
- 16.2.1.2. Products
- 16.2.1.3. SWOT Analysis
- 16.2.1.4. Recent Developments
- 16.2.1.5. Financials (Based on Availability)
- 16.2.2 Schneider Electric SE
- 16.2.2.1. Overview
- 16.2.2.2. Products
- 16.2.2.3. SWOT Analysis
- 16.2.2.4. Recent Developments
- 16.2.2.5. Financials (Based on Availability)
- 16.2.3 Ramco Systems
- 16.2.3.1. Overview
- 16.2.3.2. Products
- 16.2.3.3. SWOT Analysis
- 16.2.3.4. Recent Developments
- 16.2.3.5. Financials (Based on Availability)
- 16.2.4 Endress+Hauser AG
- 16.2.4.1. Overview
- 16.2.4.2. Products
- 16.2.4.3. SWOT Analysis
- 16.2.4.4. Recent Developments
- 16.2.4.5. Financials (Based on Availability)
- 16.2.5 Emerson Electric Co
- 16.2.5.1. Overview
- 16.2.5.2. Products
- 16.2.5.3. SWOT Analysis
- 16.2.5.4. Recent Developments
- 16.2.5.5. Financials (Based on Availability)
- 16.2.6 Siemens AG
- 16.2.6.1. Overview
- 16.2.6.2. Products
- 16.2.6.3. SWOT Analysis
- 16.2.6.4. Recent Developments
- 16.2.6.5. Financials (Based on Availability)
- 16.2.7 General Electric Co
- 16.2.7.1. Overview
- 16.2.7.2. Products
- 16.2.7.3. SWOT Analysis
- 16.2.7.4. Recent Developments
- 16.2.7.5. Financials (Based on Availability)
- 16.2.8 SFK Group
- 16.2.8.1. Overview
- 16.2.8.2. Products
- 16.2.8.3. SWOT Analysis
- 16.2.8.4. Recent Developments
- 16.2.8.5. Financials (Based on Availability)
- 16.2.9 ABB Group
- 16.2.9.1. Overview
- 16.2.9.2. Products
- 16.2.9.3. SWOT Analysis
- 16.2.9.4. Recent Developments
- 16.2.9.5. Financials (Based on Availability)
- 16.2.10 Rockwell Automation Inc
- 16.2.10.1. Overview
- 16.2.10.2. Products
- 16.2.10.3. SWOT Analysis
- 16.2.10.4. Recent Developments
- 16.2.10.5. Financials (Based on Availability)
- 16.2.1 Honeywell International Inc
List of Figures
- Figure 1: Global Plant Asset Management Industry Revenue Breakdown (Million, %) by Region 2024 & 2032
- Figure 2: North America Plant Asset Management Industry Revenue (Million), by Country 2024 & 2032
- Figure 3: North America Plant Asset Management Industry Revenue Share (%), by Country 2024 & 2032
- Figure 4: Europe Plant Asset Management Industry Revenue (Million), by Country 2024 & 2032
- Figure 5: Europe Plant Asset Management Industry Revenue Share (%), by Country 2024 & 2032
- Figure 6: Asia Pacific Plant Asset Management Industry Revenue (Million), by Country 2024 & 2032
- Figure 7: Asia Pacific Plant Asset Management Industry Revenue Share (%), by Country 2024 & 2032
- Figure 8: South America Plant Asset Management Industry Revenue (Million), by Country 2024 & 2032
- Figure 9: South America Plant Asset Management Industry Revenue Share (%), by Country 2024 & 2032
- Figure 10: MEA Plant Asset Management Industry Revenue (Million), by Country 2024 & 2032
- Figure 11: MEA Plant Asset Management Industry Revenue Share (%), by Country 2024 & 2032
- Figure 12: North America Plant Asset Management Industry Revenue (Million), by Offerings 2024 & 2032
- Figure 13: North America Plant Asset Management Industry Revenue Share (%), by Offerings 2024 & 2032
- Figure 14: North America Plant Asset Management Industry Revenue (Million), by Deployment 2024 & 2032
- Figure 15: North America Plant Asset Management Industry Revenue Share (%), by Deployment 2024 & 2032
- Figure 16: North America Plant Asset Management Industry Revenue (Million), by End-User 2024 & 2032
- Figure 17: North America Plant Asset Management Industry Revenue Share (%), by End-User 2024 & 2032
- Figure 18: North America Plant Asset Management Industry Revenue (Million), by Country 2024 & 2032
- Figure 19: North America Plant Asset Management Industry Revenue Share (%), by Country 2024 & 2032
- Figure 20: Europe Plant Asset Management Industry Revenue (Million), by Offerings 2024 & 2032
- Figure 21: Europe Plant Asset Management Industry Revenue Share (%), by Offerings 2024 & 2032
- Figure 22: Europe Plant Asset Management Industry Revenue (Million), by Deployment 2024 & 2032
- Figure 23: Europe Plant Asset Management Industry Revenue Share (%), by Deployment 2024 & 2032
- Figure 24: Europe Plant Asset Management Industry Revenue (Million), by End-User 2024 & 2032
- Figure 25: Europe Plant Asset Management Industry Revenue Share (%), by End-User 2024 & 2032
- Figure 26: Europe Plant Asset Management Industry Revenue (Million), by Country 2024 & 2032
- Figure 27: Europe Plant Asset Management Industry Revenue Share (%), by Country 2024 & 2032
- Figure 28: Asia Pacific Plant Asset Management Industry Revenue (Million), by Offerings 2024 & 2032
- Figure 29: Asia Pacific Plant Asset Management Industry Revenue Share (%), by Offerings 2024 & 2032
- Figure 30: Asia Pacific Plant Asset Management Industry Revenue (Million), by Deployment 2024 & 2032
- Figure 31: Asia Pacific Plant Asset Management Industry Revenue Share (%), by Deployment 2024 & 2032
- Figure 32: Asia Pacific Plant Asset Management Industry Revenue (Million), by End-User 2024 & 2032
- Figure 33: Asia Pacific Plant Asset Management Industry Revenue Share (%), by End-User 2024 & 2032
- Figure 34: Asia Pacific Plant Asset Management Industry Revenue (Million), by Country 2024 & 2032
- Figure 35: Asia Pacific Plant Asset Management Industry Revenue Share (%), by Country 2024 & 2032
- Figure 36: Latin America Plant Asset Management Industry Revenue (Million), by Offerings 2024 & 2032
- Figure 37: Latin America Plant Asset Management Industry Revenue Share (%), by Offerings 2024 & 2032
- Figure 38: Latin America Plant Asset Management Industry Revenue (Million), by Deployment 2024 & 2032
- Figure 39: Latin America Plant Asset Management Industry Revenue Share (%), by Deployment 2024 & 2032
- Figure 40: Latin America Plant Asset Management Industry Revenue (Million), by End-User 2024 & 2032
- Figure 41: Latin America Plant Asset Management Industry Revenue Share (%), by End-User 2024 & 2032
- Figure 42: Latin America Plant Asset Management Industry Revenue (Million), by Country 2024 & 2032
- Figure 43: Latin America Plant Asset Management Industry Revenue Share (%), by Country 2024 & 2032
- Figure 44: Middle East and Africa Plant Asset Management Industry Revenue (Million), by Offerings 2024 & 2032
- Figure 45: Middle East and Africa Plant Asset Management Industry Revenue Share (%), by Offerings 2024 & 2032
- Figure 46: Middle East and Africa Plant Asset Management Industry Revenue (Million), by Deployment 2024 & 2032
- Figure 47: Middle East and Africa Plant Asset Management Industry Revenue Share (%), by Deployment 2024 & 2032
- Figure 48: Middle East and Africa Plant Asset Management Industry Revenue (Million), by End-User 2024 & 2032
- Figure 49: Middle East and Africa Plant Asset Management Industry Revenue Share (%), by End-User 2024 & 2032
- Figure 50: Middle East and Africa Plant Asset Management Industry Revenue (Million), by Country 2024 & 2032
- Figure 51: Middle East and Africa Plant Asset Management Industry Revenue Share (%), by Country 2024 & 2032
List of Tables
- Table 1: Global Plant Asset Management Industry Revenue Million Forecast, by Region 2019 & 2032
- Table 2: Global Plant Asset Management Industry Revenue Million Forecast, by Offerings 2019 & 2032
- Table 3: Global Plant Asset Management Industry Revenue Million Forecast, by Deployment 2019 & 2032
- Table 4: Global Plant Asset Management Industry Revenue Million Forecast, by End-User 2019 & 2032
- Table 5: Global Plant Asset Management Industry Revenue Million Forecast, by Region 2019 & 2032
- Table 6: Global Plant Asset Management Industry Revenue Million Forecast, by Country 2019 & 2032
- Table 7: United States Plant Asset Management Industry Revenue (Million) Forecast, by Application 2019 & 2032
- Table 8: Canada Plant Asset Management Industry Revenue (Million) Forecast, by Application 2019 & 2032
- Table 9: Mexico Plant Asset Management Industry Revenue (Million) Forecast, by Application 2019 & 2032
- Table 10: Global Plant Asset Management Industry Revenue Million Forecast, by Country 2019 & 2032
- Table 11: Germany Plant Asset Management Industry Revenue (Million) Forecast, by Application 2019 & 2032
- Table 12: United Kingdom Plant Asset Management Industry Revenue (Million) Forecast, by Application 2019 & 2032
- Table 13: France Plant Asset Management Industry Revenue (Million) Forecast, by Application 2019 & 2032
- Table 14: Spain Plant Asset Management Industry Revenue (Million) Forecast, by Application 2019 & 2032
- Table 15: Italy Plant Asset Management Industry Revenue (Million) Forecast, by Application 2019 & 2032
- Table 16: Spain Plant Asset Management Industry Revenue (Million) Forecast, by Application 2019 & 2032
- Table 17: Belgium Plant Asset Management Industry Revenue (Million) Forecast, by Application 2019 & 2032
- Table 18: Netherland Plant Asset Management Industry Revenue (Million) Forecast, by Application 2019 & 2032
- Table 19: Nordics Plant Asset Management Industry Revenue (Million) Forecast, by Application 2019 & 2032
- Table 20: Rest of Europe Plant Asset Management Industry Revenue (Million) Forecast, by Application 2019 & 2032
- Table 21: Global Plant Asset Management Industry Revenue Million Forecast, by Country 2019 & 2032
- Table 22: China Plant Asset Management Industry Revenue (Million) Forecast, by Application 2019 & 2032
- Table 23: Japan Plant Asset Management Industry Revenue (Million) Forecast, by Application 2019 & 2032
- Table 24: India Plant Asset Management Industry Revenue (Million) Forecast, by Application 2019 & 2032
- Table 25: South Korea Plant Asset Management Industry Revenue (Million) Forecast, by Application 2019 & 2032
- Table 26: Southeast Asia Plant Asset Management Industry Revenue (Million) Forecast, by Application 2019 & 2032
- Table 27: Australia Plant Asset Management Industry Revenue (Million) Forecast, by Application 2019 & 2032
- Table 28: Indonesia Plant Asset Management Industry Revenue (Million) Forecast, by Application 2019 & 2032
- Table 29: Phillipes Plant Asset Management Industry Revenue (Million) Forecast, by Application 2019 & 2032
- Table 30: Singapore Plant Asset Management Industry Revenue (Million) Forecast, by Application 2019 & 2032
- Table 31: Thailandc Plant Asset Management Industry Revenue (Million) Forecast, by Application 2019 & 2032
- Table 32: Rest of Asia Pacific Plant Asset Management Industry Revenue (Million) Forecast, by Application 2019 & 2032
- Table 33: Global Plant Asset Management Industry Revenue Million Forecast, by Country 2019 & 2032
- Table 34: Brazil Plant Asset Management Industry Revenue (Million) Forecast, by Application 2019 & 2032
- Table 35: Argentina Plant Asset Management Industry Revenue (Million) Forecast, by Application 2019 & 2032
- Table 36: Peru Plant Asset Management Industry Revenue (Million) Forecast, by Application 2019 & 2032
- Table 37: Chile Plant Asset Management Industry Revenue (Million) Forecast, by Application 2019 & 2032
- Table 38: Colombia Plant Asset Management Industry Revenue (Million) Forecast, by Application 2019 & 2032
- Table 39: Ecuador Plant Asset Management Industry Revenue (Million) Forecast, by Application 2019 & 2032
- Table 40: Venezuela Plant Asset Management Industry Revenue (Million) Forecast, by Application 2019 & 2032
- Table 41: Rest of South America Plant Asset Management Industry Revenue (Million) Forecast, by Application 2019 & 2032
- Table 42: Global Plant Asset Management Industry Revenue Million Forecast, by Country 2019 & 2032
- Table 43: United Arab Emirates Plant Asset Management Industry Revenue (Million) Forecast, by Application 2019 & 2032
- Table 44: Saudi Arabia Plant Asset Management Industry Revenue (Million) Forecast, by Application 2019 & 2032
- Table 45: South Africa Plant Asset Management Industry Revenue (Million) Forecast, by Application 2019 & 2032
- Table 46: Rest of Middle East and Africa Plant Asset Management Industry Revenue (Million) Forecast, by Application 2019 & 2032
- Table 47: Global Plant Asset Management Industry Revenue Million Forecast, by Offerings 2019 & 2032
- Table 48: Global Plant Asset Management Industry Revenue Million Forecast, by Deployment 2019 & 2032
- Table 49: Global Plant Asset Management Industry Revenue Million Forecast, by End-User 2019 & 2032
- Table 50: Global Plant Asset Management Industry Revenue Million Forecast, by Country 2019 & 2032
- Table 51: Global Plant Asset Management Industry Revenue Million Forecast, by Offerings 2019 & 2032
- Table 52: Global Plant Asset Management Industry Revenue Million Forecast, by Deployment 2019 & 2032
- Table 53: Global Plant Asset Management Industry Revenue Million Forecast, by End-User 2019 & 2032
- Table 54: Global Plant Asset Management Industry Revenue Million Forecast, by Country 2019 & 2032
- Table 55: Global Plant Asset Management Industry Revenue Million Forecast, by Offerings 2019 & 2032
- Table 56: Global Plant Asset Management Industry Revenue Million Forecast, by Deployment 2019 & 2032
- Table 57: Global Plant Asset Management Industry Revenue Million Forecast, by End-User 2019 & 2032
- Table 58: Global Plant Asset Management Industry Revenue Million Forecast, by Country 2019 & 2032
- Table 59: Global Plant Asset Management Industry Revenue Million Forecast, by Offerings 2019 & 2032
- Table 60: Global Plant Asset Management Industry Revenue Million Forecast, by Deployment 2019 & 2032
- Table 61: Global Plant Asset Management Industry Revenue Million Forecast, by End-User 2019 & 2032
- Table 62: Global Plant Asset Management Industry Revenue Million Forecast, by Country 2019 & 2032
- Table 63: Global Plant Asset Management Industry Revenue Million Forecast, by Offerings 2019 & 2032
- Table 64: Global Plant Asset Management Industry Revenue Million Forecast, by Deployment 2019 & 2032
- Table 65: Global Plant Asset Management Industry Revenue Million Forecast, by End-User 2019 & 2032
- Table 66: Global Plant Asset Management Industry Revenue Million Forecast, by Country 2019 & 2032
Frequently Asked Questions
1. What is the projected Compound Annual Growth Rate (CAGR) of the Plant Asset Management Industry?
The projected CAGR is approximately 11.60%.
2. Which companies are prominent players in the Plant Asset Management Industry?
Key companies in the market include Honeywell International Inc, Schneider Electric SE, Ramco Systems, Endress+Hauser AG, Emerson Electric Co, Siemens AG, General Electric Co, SFK Group, ABB Group, Rockwell Automation Inc.
3. What are the main segments of the Plant Asset Management Industry?
The market segments include Offerings, Deployment, End-User.
4. Can you provide details about the market size?
The market size is estimated to be USD 9.84 Million as of 2022.
5. What are some drivers contributing to market growth?
Adoption Of Real-Time Data Analytics; Adoption of Lean Manufacturing Practices.
6. What are the notable trends driving market growth?
Oil and Gas Accounts For Significant Market Growth.
7. Are there any restraints impacting market growth?
Lack of Skilled Personnel.
8. Can you provide examples of recent developments in the market?
February 2023 - Fieldman introduced a GIS-based Work and Asset Management system exclusively for utility companies and municipal and local governments. Fieldman is the provider of modern cloud software for mass meter deployment. The software developed by the brand will help its clients in efficient infrastructure condition assessment, regular maintenance planning and scheduling, real-time emergency response, and budget forecasting, ultimately reducing the lifecycle costs of their assets and modernizing infrastructure operations.
9. What pricing options are available for accessing the report?
Pricing options include single-user, multi-user, and enterprise licenses priced at USD 4750, USD 5250, and USD 8750 respectively.
10. Is the market size provided in terms of value or volume?
The market size is provided in terms of value, measured in Million.
11. Are there any specific market keywords associated with the report?
Yes, the market keyword associated with the report is "Plant Asset Management Industry," which aids in identifying and referencing the specific market segment covered.
12. How do I determine which pricing option suits my needs best?
The pricing options vary based on user requirements and access needs. Individual users may opt for single-user licenses, while businesses requiring broader access may choose multi-user or enterprise licenses for cost-effective access to the report.
13. Are there any additional resources or data provided in the Plant Asset Management Industry report?
While the report offers comprehensive insights, it's advisable to review the specific contents or supplementary materials provided to ascertain if additional resources or data are available.
14. How can I stay updated on further developments or reports in the Plant Asset Management Industry?
To stay informed about further developments, trends, and reports in the Plant Asset Management Industry, consider subscribing to industry newsletters, following relevant companies and organizations, or regularly checking reputable industry news sources and publications.
Methodology
Step 1 - Identification of Relevant Samples Size from Population Database


Step 2 - Approaches for Defining Global Market Size (Value, Volume* & Price*)

Note*: In applicable scenarios
Step 3 - Data Sources
Primary Research
- Web Analytics
- Survey Reports
- Research Institute
- Latest Research Reports
- Opinion Leaders
Secondary Research
- Annual Reports
- White Paper
- Latest Press Release
- Industry Association
- Paid Database
- Investor Presentations

Step 4 - Data Triangulation
Involves using different sources of information in order to increase the validity of a study
These sources are likely to be stakeholders in a program - participants, other researchers, program staff, other community members, and so on.
Then we put all data in single framework & apply various statistical tools to find out the dynamic on the market.
During the analysis stage, feedback from the stakeholder groups would be compared to determine areas of agreement as well as areas of divergence
