

Key Insights
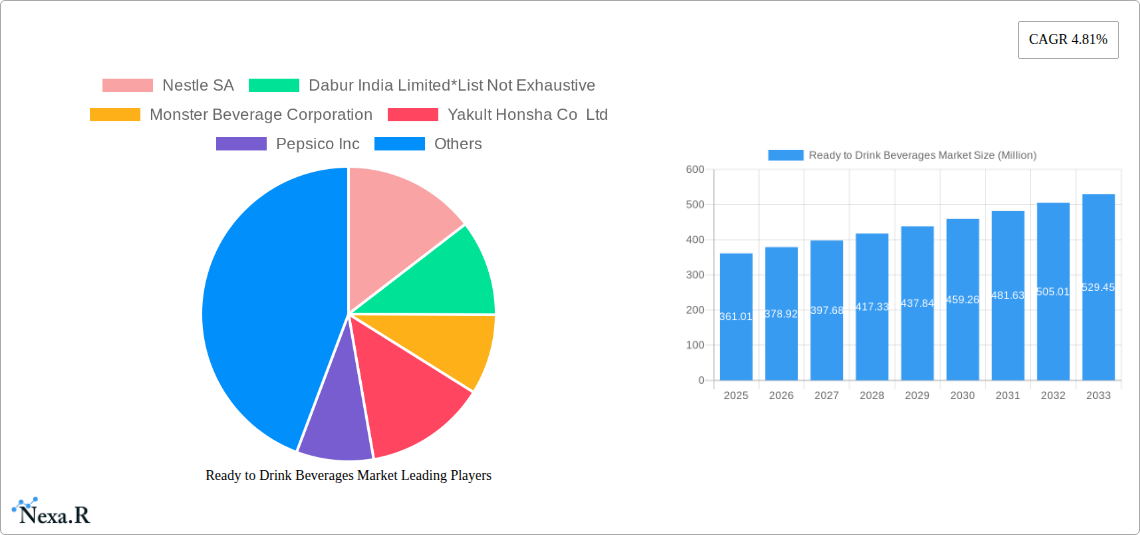
The Ready-to-Drink (RTD) beverage market, valued at $361.01 million in 2025, is projected to experience robust growth, driven by several key factors. The increasing demand for convenient and on-the-go consumption options fuels the market's expansion. Health-conscious consumers are driving the popularity of functional beverages like flavored and fortified water, yogurt drinks, and dairy alternatives, contributing significantly to market segmentation. The rising disposable incomes, particularly in developing economies within the Asia-Pacific region, further stimulate consumption. E-commerce platforms are also playing a crucial role, offering wider product choices and seamless delivery, enhancing the accessibility of RTD beverages. Furthermore, innovative product launches with unique flavors and functional benefits, coupled with effective marketing strategies by major players like Nestle, PepsiCo, and Coca-Cola, are shaping market trends and driving competitive intensity.
However, the market faces challenges. Fluctuating raw material prices and stringent regulatory frameworks regarding sugar content and artificial additives can impact profitability and product formulation. Furthermore, concerns about the environmental impact of packaging materials and the increasing preference for healthier alternatives necessitate sustainable practices and innovation within the industry. Despite these constraints, the market's growth trajectory remains positive, propelled by evolving consumer preferences, technological advancements, and increasing penetration in emerging markets. The diverse product portfolio, encompassing tea, coffee, energy drinks, and various functional beverages, ensures a broad appeal and caters to diverse consumer demographics. Future growth will likely be fueled by strategic partnerships, mergers and acquisitions, and the continuous development of innovative, healthier, and sustainably packaged RTD beverages.
Ready-to-Drink Beverages Market: A Comprehensive Market Report (2019-2033)
This comprehensive report provides an in-depth analysis of the Ready-to-Drink (RTD) Beverages market, encompassing historical data (2019-2024), current estimates (2025), and future forecasts (2025-2033). The study covers key segments, including Product Type (Tea, Coffee, Energy Drinks, Yogurt Drinks, Dairy & Dairy Alternative Beverages, Flavored & Fortified Water, Other Product Types) and Distribution Channel (Supermarkets/Hypermarkets, Convenience/Grocery Stores, Online Stores, Specialty Retail Stores, Other Distribution Channels), offering a granular understanding of market dynamics and growth potential. The report profiles leading players like Nestle SA, Dabur India Limited, Monster Beverage Corporation, Yakult Honsha Co Ltd, Pepsico Inc, Danone SA, Suntory Holdings Limited, Red Bull GmbH, Blue Diamond Growers, and The Coca-Cola Company, providing valuable insights for strategic decision-making.
Ready to Drink Beverages Market Dynamics & Structure
The RTD beverage market is characterized by a moderately concentrated landscape, with a few major players commanding significant market share. Technological innovation, particularly in packaging and flavor profiles, is a key driver, alongside evolving consumer preferences towards healthier and functional beverages. Regulatory frameworks concerning sugar content and labeling significantly impact market dynamics. Competitive pressures from substitute products, such as freshly squeezed juices, also play a role. Market consolidation through mergers and acquisitions (M&A) is expected to continue.
- Market Concentration: The top 5 players account for approximately xx% of the global market share (2024).
- Technological Innovation: Focus on sustainable packaging, innovative flavor combinations, and functional ingredients.
- Regulatory Frameworks: Stringent regulations on sugar content and labeling influence product formulation and marketing strategies.
- M&A Activity: An average of xx M&A deals per year were recorded between 2019 and 2024, indicating consolidation within the industry.
- Substitute Products: Competition from freshly squeezed juices and other homemade alternatives.
- End-User Demographics: Growing demand from health-conscious consumers and younger generations.
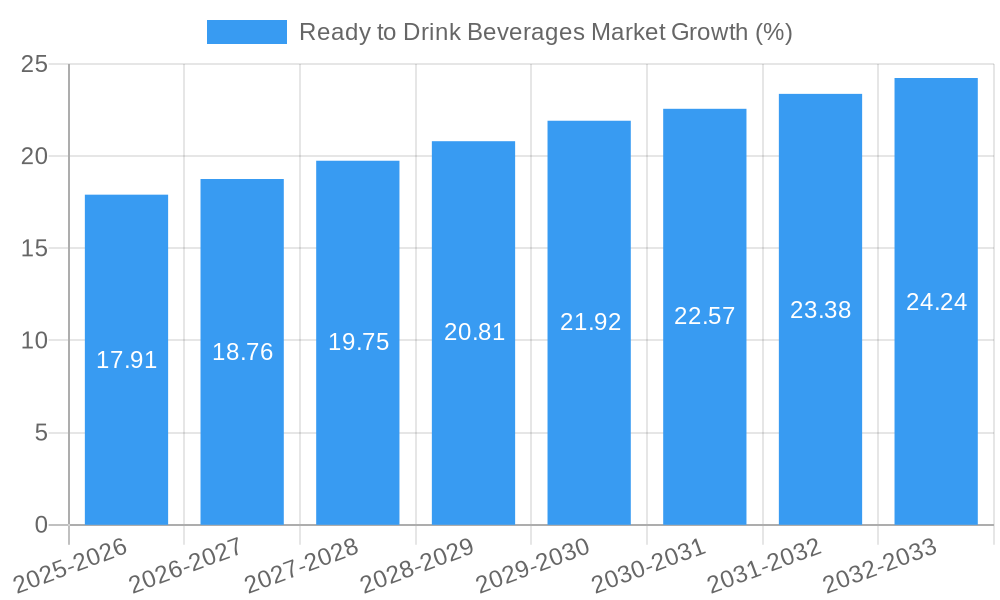
Ready to Drink Beverages Market Growth Trends & Insights
The RTD beverage market exhibited a CAGR of xx% during the historical period (2019-2024) and is projected to grow at a CAGR of xx% during the forecast period (2025-2033), reaching a market size of xx Million units by 2033. This growth is driven by several factors: rising disposable incomes, increasing urbanization, changing consumer lifestyles, and the growing popularity of convenient and on-the-go consumption patterns. Technological advancements, such as improved packaging and enhanced flavor profiles, are further fueling market expansion. Consumer behavior shifts towards healthier options and functional beverages are also significantly impacting market trends. The market penetration rate for RTD beverages is estimated to be xx% in 2025, with potential for further growth in emerging markets.
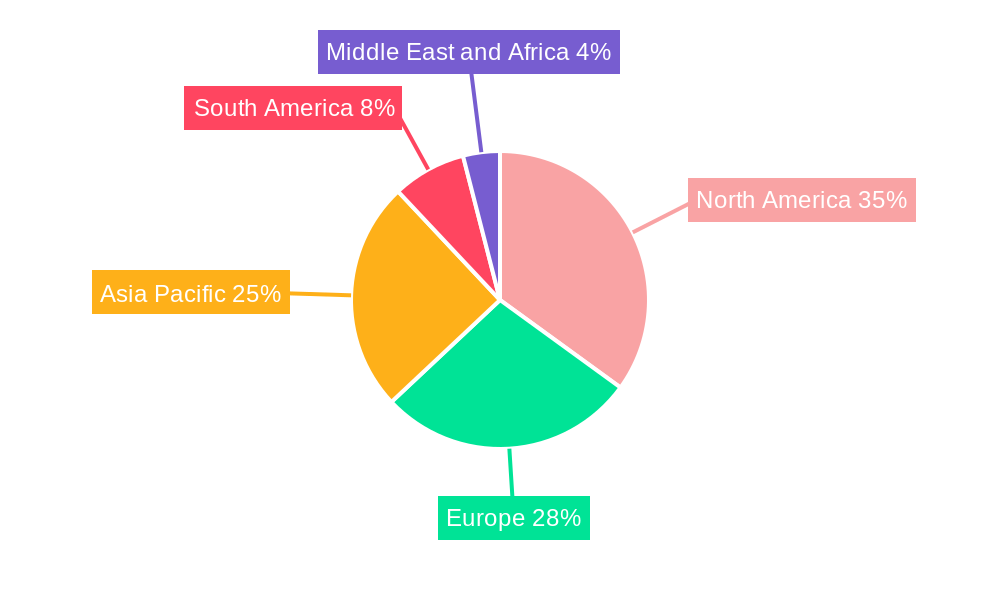
Dominant Regions, Countries, or Segments in Ready to Drink Beverages Market
North America and Europe currently dominate the RTD beverage market, primarily driven by high consumption rates and established distribution networks. However, Asia-Pacific is projected to witness significant growth in the coming years due to rapid economic development and rising disposable incomes. Within product types, energy drinks and flavored water segments are experiencing strong growth. Regarding distribution channels, supermarkets/hypermarkets maintain a leading position, while online stores are witnessing rapid growth, particularly in developed markets.
- Leading Regions: North America, Europe, and Asia-Pacific.
- Key Drivers (Asia-Pacific): Rising disposable incomes, increasing urbanization, and expanding retail infrastructure.
- Key Drivers (North America & Europe): Strong established distribution networks, high consumption rates, and diverse product offerings.
- Dominant Segment (Product): Energy drinks and Flavored & Fortified water demonstrate the highest growth potential.
- Dominant Segment (Distribution): Supermarkets/Hypermarkets remain the dominant distribution channel.
Ready to Drink Beverages Market Product Landscape
The RTD beverage market showcases continuous innovation, with manufacturers focusing on unique selling propositions like natural ingredients, functional benefits, and convenient packaging. Recent trends include the introduction of organic and plant-based beverages, catering to health-conscious consumers. Technological advancements in packaging, such as sustainable materials and improved shelf life, enhance product appeal and reduce environmental impact. The market is witnessing a trend toward personalized beverages with customized flavors and functional ingredients, aligning with consumer preferences for personalized experiences.
Key Drivers, Barriers & Challenges in Ready to Drink Beverages Market
Key Drivers:
- Growing demand for convenient and on-the-go beverages.
- Increasing health consciousness leading to demand for functional beverages.
- Technological advancements in packaging and flavor development.
- Expansion of distribution networks in emerging markets.
Challenges & Restraints:
- Intense competition from established players and new entrants.
- Fluctuations in raw material prices impacting profitability.
- Stringent regulations and evolving consumer preferences.
- Supply chain disruptions and logistics challenges. The impact of supply chain issues on profitability is estimated at xx% in 2024.
Emerging Opportunities in Ready to Drink Beverages Market
- Growing demand for functional beverages with added health benefits.
- Expansion into untapped markets in developing economies.
- Increasing popularity of sustainable and eco-friendly packaging.
- Growing demand for personalized and customized beverage options.
- Rise of direct-to-consumer models and online sales channels.
Growth Accelerators in the Ready to Drink Beverages Market Industry
The RTD beverage market is poised for substantial long-term growth, fueled by several factors. Technological advancements in beverage processing and packaging are continually enhancing product quality, shelf life, and convenience. Strategic partnerships and collaborations between beverage companies and ingredient suppliers drive innovation and market expansion. The increasing adoption of e-commerce platforms creates new opportunities for market penetration, reaching a wider consumer base.
Key Players Shaping the Ready to Drink Beverages Market Market
- Nestle SA
- Dabur India Limited
- Monster Beverage Corporation
- Yakult Honsha Co Ltd
- Pepsico Inc
- Danone SA
- Suntory Holdings Limited
- Red Bull GmbH
- Blue Diamond Growers
- The Coca-Cola Company
Notable Milestones in Ready to Drink Beverages Market Sector
- February 2023: PepsiCo launched marshmallow-flavored Cola in partnership with Peeps, showcasing innovative flavor combinations.
- September 2022: Honest Tea launched Just Iced Tea, highlighting the growing demand for organic and ethically sourced beverages.
- March 2022: Nirvana Water Sciences Inc. introduced Nirvana HMB spring water, demonstrating the rise of functional beverages.
In-Depth Ready to Drink Beverages Market Market Outlook
The future of the RTD beverage market is bright, with significant growth potential driven by evolving consumer preferences and technological advancements. Continued innovation in product development, sustainable packaging, and expansion into new markets will play crucial roles in shaping the industry’s trajectory. Strategic partnerships and acquisitions will further consolidate the market, creating larger players with greater reach and market dominance. The market's long-term prospects remain positive, with significant opportunities for growth and expansion.
Ready to Drink Beverages Market Segmentation
-
1. Product Type
- 1.1. Tea
- 1.2. Coffee
- 1.3. Energy Drinks
- 1.4. Yogurt Drinks
- 1.5. Dairy and Dairy Alternative Beverages
- 1.6. Flavored and Fortified Water
- 1.7. Other Product Types
-
2. Distribution Channel
- 2.1. Supermarkets/Hypermarkets
- 2.2. Convenience/Grocery Stores
- 2.3. Online Stores
- 2.4. Specialty Retail Stores
- 2.5. Other Distribution Channels
Ready to Drink Beverages Market Segmentation By Geography
-
1. North America
- 1.1. United States
- 1.2. Canada
- 1.3. Mexico
- 1.4. Rest of North America
-
2. Europe
- 2.1. Germany
- 2.2. United Kingdom
- 2.3. Italy
- 2.4. Spain
- 2.5. France
- 2.6. Russia
- 2.7. Rest of Europe
-
3. Asia Pacific
- 3.1. China
- 3.2. Japan
- 3.3. India
- 3.4. Australia
- 3.5. Rest of Asia Pacific
-
4. South America
- 4.1. Brazil
- 4.2. Argentina
- 4.3. Rest of South America
-
5. Middle East and Africa
- 5.1. South Africa
- 5.2. Saudi Arabia
- 5.3. Rest of Middle East and Africa
Ready to Drink Beverages Market REPORT HIGHLIGHTS
| Aspects | Details |
|---|---|
| Study Period | 2019-2033 |
| Base Year | 2024 |
| Estimated Year | 2025 |
| Forecast Period | 2025-2033 |
| Historical Period | 2019-2024 |
| Growth Rate | CAGR of 4.81% from 2019-2033 |
| Segmentation |
|
Table of Contents
- 1. Introduction
- 1.1. Research Scope
- 1.2. Market Segmentation
- 1.3. Research Methodology
- 1.4. Definitions and Assumptions
- 2. Executive Summary
- 2.1. Introduction
- 3. Market Dynamics
- 3.1. Introduction
- 3.2. Market Drivers
- 3.2.1. Inclination Toward Low-Sugar/Sugar-free Beverages
- 3.3. Market Restrains
- 3.3.1. Concerns Over Health Issues Associated with Functional Beverages
- 3.4. Market Trends
- 3.4.1. Augmented Expenditure on Advertisement and Promotional Activities Impel Market Growth
- 4. Market Factor Analysis
- 4.1. Porters Five Forces
- 4.2. Supply/Value Chain
- 4.3. PESTEL analysis
- 4.4. Market Entropy
- 4.5. Patent/Trademark Analysis
- 5. Global Ready to Drink Beverages Market Analysis, Insights and Forecast, 2019-2031
- 5.1. Market Analysis, Insights and Forecast - by Product Type
- 5.1.1. Tea
- 5.1.2. Coffee
- 5.1.3. Energy Drinks
- 5.1.4. Yogurt Drinks
- 5.1.5. Dairy and Dairy Alternative Beverages
- 5.1.6. Flavored and Fortified Water
- 5.1.7. Other Product Types
- 5.2. Market Analysis, Insights and Forecast - by Distribution Channel
- 5.2.1. Supermarkets/Hypermarkets
- 5.2.2. Convenience/Grocery Stores
- 5.2.3. Online Stores
- 5.2.4. Specialty Retail Stores
- 5.2.5. Other Distribution Channels
- 5.3. Market Analysis, Insights and Forecast - by Region
- 5.3.1. North America
- 5.3.2. Europe
- 5.3.3. Asia Pacific
- 5.3.4. South America
- 5.3.5. Middle East and Africa
- 5.1. Market Analysis, Insights and Forecast - by Product Type
- 6. North America Ready to Drink Beverages Market Analysis, Insights and Forecast, 2019-2031
- 6.1. Market Analysis, Insights and Forecast - by Product Type
- 6.1.1. Tea
- 6.1.2. Coffee
- 6.1.3. Energy Drinks
- 6.1.4. Yogurt Drinks
- 6.1.5. Dairy and Dairy Alternative Beverages
- 6.1.6. Flavored and Fortified Water
- 6.1.7. Other Product Types
- 6.2. Market Analysis, Insights and Forecast - by Distribution Channel
- 6.2.1. Supermarkets/Hypermarkets
- 6.2.2. Convenience/Grocery Stores
- 6.2.3. Online Stores
- 6.2.4. Specialty Retail Stores
- 6.2.5. Other Distribution Channels
- 6.1. Market Analysis, Insights and Forecast - by Product Type
- 7. Europe Ready to Drink Beverages Market Analysis, Insights and Forecast, 2019-2031
- 7.1. Market Analysis, Insights and Forecast - by Product Type
- 7.1.1. Tea
- 7.1.2. Coffee
- 7.1.3. Energy Drinks
- 7.1.4. Yogurt Drinks
- 7.1.5. Dairy and Dairy Alternative Beverages
- 7.1.6. Flavored and Fortified Water
- 7.1.7. Other Product Types
- 7.2. Market Analysis, Insights and Forecast - by Distribution Channel
- 7.2.1. Supermarkets/Hypermarkets
- 7.2.2. Convenience/Grocery Stores
- 7.2.3. Online Stores
- 7.2.4. Specialty Retail Stores
- 7.2.5. Other Distribution Channels
- 7.1. Market Analysis, Insights and Forecast - by Product Type
- 8. Asia Pacific Ready to Drink Beverages Market Analysis, Insights and Forecast, 2019-2031
- 8.1. Market Analysis, Insights and Forecast - by Product Type
- 8.1.1. Tea
- 8.1.2. Coffee
- 8.1.3. Energy Drinks
- 8.1.4. Yogurt Drinks
- 8.1.5. Dairy and Dairy Alternative Beverages
- 8.1.6. Flavored and Fortified Water
- 8.1.7. Other Product Types
- 8.2. Market Analysis, Insights and Forecast - by Distribution Channel
- 8.2.1. Supermarkets/Hypermarkets
- 8.2.2. Convenience/Grocery Stores
- 8.2.3. Online Stores
- 8.2.4. Specialty Retail Stores
- 8.2.5. Other Distribution Channels
- 8.1. Market Analysis, Insights and Forecast - by Product Type
- 9. South America Ready to Drink Beverages Market Analysis, Insights and Forecast, 2019-2031
- 9.1. Market Analysis, Insights and Forecast - by Product Type
- 9.1.1. Tea
- 9.1.2. Coffee
- 9.1.3. Energy Drinks
- 9.1.4. Yogurt Drinks
- 9.1.5. Dairy and Dairy Alternative Beverages
- 9.1.6. Flavored and Fortified Water
- 9.1.7. Other Product Types
- 9.2. Market Analysis, Insights and Forecast - by Distribution Channel
- 9.2.1. Supermarkets/Hypermarkets
- 9.2.2. Convenience/Grocery Stores
- 9.2.3. Online Stores
- 9.2.4. Specialty Retail Stores
- 9.2.5. Other Distribution Channels
- 9.1. Market Analysis, Insights and Forecast - by Product Type
- 10. Middle East and Africa Ready to Drink Beverages Market Analysis, Insights and Forecast, 2019-2031
- 10.1. Market Analysis, Insights and Forecast - by Product Type
- 10.1.1. Tea
- 10.1.2. Coffee
- 10.1.3. Energy Drinks
- 10.1.4. Yogurt Drinks
- 10.1.5. Dairy and Dairy Alternative Beverages
- 10.1.6. Flavored and Fortified Water
- 10.1.7. Other Product Types
- 10.2. Market Analysis, Insights and Forecast - by Distribution Channel
- 10.2.1. Supermarkets/Hypermarkets
- 10.2.2. Convenience/Grocery Stores
- 10.2.3. Online Stores
- 10.2.4. Specialty Retail Stores
- 10.2.5. Other Distribution Channels
- 10.1. Market Analysis, Insights and Forecast - by Product Type
- 11. North America Ready to Drink Beverages Market Analysis, Insights and Forecast, 2019-2031
- 11.1. Market Analysis, Insights and Forecast - By Country/Sub-region
- 11.1.1 United States
- 11.1.2 Canada
- 11.1.3 Mexico
- 11.1.4 Rest of North America
- 12. Europe Ready to Drink Beverages Market Analysis, Insights and Forecast, 2019-2031
- 12.1. Market Analysis, Insights and Forecast - By Country/Sub-region
- 12.1.1 Germany
- 12.1.2 United Kingdom
- 12.1.3 Italy
- 12.1.4 Spain
- 12.1.5 France
- 12.1.6 Russia
- 12.1.7 Rest of Europe
- 13. Asia Pacific Ready to Drink Beverages Market Analysis, Insights and Forecast, 2019-2031
- 13.1. Market Analysis, Insights and Forecast - By Country/Sub-region
- 13.1.1 China
- 13.1.2 Japan
- 13.1.3 India
- 13.1.4 Australia
- 13.1.5 Rest of Asia Pacific
- 14. South America Ready to Drink Beverages Market Analysis, Insights and Forecast, 2019-2031
- 14.1. Market Analysis, Insights and Forecast - By Country/Sub-region
- 14.1.1 Brazil
- 14.1.2 Argentina
- 14.1.3 Rest of South America
- 15. Middle East and Africa Ready to Drink Beverages Market Analysis, Insights and Forecast, 2019-2031
- 15.1. Market Analysis, Insights and Forecast - By Country/Sub-region
- 15.1.1 South Africa
- 15.1.2 Saudi Arabia
- 15.1.3 Rest of Middle East and Africa
- 16. Competitive Analysis
- 16.1. Global Market Share Analysis 2024
- 16.2. Company Profiles
- 16.2.1 Nestle SA
- 16.2.1.1. Overview
- 16.2.1.2. Products
- 16.2.1.3. SWOT Analysis
- 16.2.1.4. Recent Developments
- 16.2.1.5. Financials (Based on Availability)
- 16.2.2 Dabur India Limited*List Not Exhaustive
- 16.2.2.1. Overview
- 16.2.2.2. Products
- 16.2.2.3. SWOT Analysis
- 16.2.2.4. Recent Developments
- 16.2.2.5. Financials (Based on Availability)
- 16.2.3 Monster Beverage Corporation
- 16.2.3.1. Overview
- 16.2.3.2. Products
- 16.2.3.3. SWOT Analysis
- 16.2.3.4. Recent Developments
- 16.2.3.5. Financials (Based on Availability)
- 16.2.4 Yakult Honsha Co Ltd
- 16.2.4.1. Overview
- 16.2.4.2. Products
- 16.2.4.3. SWOT Analysis
- 16.2.4.4. Recent Developments
- 16.2.4.5. Financials (Based on Availability)
- 16.2.5 Pepsico Inc
- 16.2.5.1. Overview
- 16.2.5.2. Products
- 16.2.5.3. SWOT Analysis
- 16.2.5.4. Recent Developments
- 16.2.5.5. Financials (Based on Availability)
- 16.2.6 Danone SA
- 16.2.6.1. Overview
- 16.2.6.2. Products
- 16.2.6.3. SWOT Analysis
- 16.2.6.4. Recent Developments
- 16.2.6.5. Financials (Based on Availability)
- 16.2.7 Suntory Holdings Limited
- 16.2.7.1. Overview
- 16.2.7.2. Products
- 16.2.7.3. SWOT Analysis
- 16.2.7.4. Recent Developments
- 16.2.7.5. Financials (Based on Availability)
- 16.2.8 Red Bull GmbH
- 16.2.8.1. Overview
- 16.2.8.2. Products
- 16.2.8.3. SWOT Analysis
- 16.2.8.4. Recent Developments
- 16.2.8.5. Financials (Based on Availability)
- 16.2.9 Blue Diamond Growers
- 16.2.9.1. Overview
- 16.2.9.2. Products
- 16.2.9.3. SWOT Analysis
- 16.2.9.4. Recent Developments
- 16.2.9.5. Financials (Based on Availability)
- 16.2.10 The Coca-Cola Company
- 16.2.10.1. Overview
- 16.2.10.2. Products
- 16.2.10.3. SWOT Analysis
- 16.2.10.4. Recent Developments
- 16.2.10.5. Financials (Based on Availability)
- 16.2.1 Nestle SA
List of Figures
- Figure 1: Global Ready to Drink Beverages Market Revenue Breakdown (Million, %) by Region 2024 & 2032
- Figure 2: North America Ready to Drink Beverages Market Revenue (Million), by Country 2024 & 2032
- Figure 3: North America Ready to Drink Beverages Market Revenue Share (%), by Country 2024 & 2032
- Figure 4: Europe Ready to Drink Beverages Market Revenue (Million), by Country 2024 & 2032
- Figure 5: Europe Ready to Drink Beverages Market Revenue Share (%), by Country 2024 & 2032
- Figure 6: Asia Pacific Ready to Drink Beverages Market Revenue (Million), by Country 2024 & 2032
- Figure 7: Asia Pacific Ready to Drink Beverages Market Revenue Share (%), by Country 2024 & 2032
- Figure 8: South America Ready to Drink Beverages Market Revenue (Million), by Country 2024 & 2032
- Figure 9: South America Ready to Drink Beverages Market Revenue Share (%), by Country 2024 & 2032
- Figure 10: Middle East and Africa Ready to Drink Beverages Market Revenue (Million), by Country 2024 & 2032
- Figure 11: Middle East and Africa Ready to Drink Beverages Market Revenue Share (%), by Country 2024 & 2032
- Figure 12: North America Ready to Drink Beverages Market Revenue (Million), by Product Type 2024 & 2032
- Figure 13: North America Ready to Drink Beverages Market Revenue Share (%), by Product Type 2024 & 2032
- Figure 14: North America Ready to Drink Beverages Market Revenue (Million), by Distribution Channel 2024 & 2032
- Figure 15: North America Ready to Drink Beverages Market Revenue Share (%), by Distribution Channel 2024 & 2032
- Figure 16: North America Ready to Drink Beverages Market Revenue (Million), by Country 2024 & 2032
- Figure 17: North America Ready to Drink Beverages Market Revenue Share (%), by Country 2024 & 2032
- Figure 18: Europe Ready to Drink Beverages Market Revenue (Million), by Product Type 2024 & 2032
- Figure 19: Europe Ready to Drink Beverages Market Revenue Share (%), by Product Type 2024 & 2032
- Figure 20: Europe Ready to Drink Beverages Market Revenue (Million), by Distribution Channel 2024 & 2032
- Figure 21: Europe Ready to Drink Beverages Market Revenue Share (%), by Distribution Channel 2024 & 2032
- Figure 22: Europe Ready to Drink Beverages Market Revenue (Million), by Country 2024 & 2032
- Figure 23: Europe Ready to Drink Beverages Market Revenue Share (%), by Country 2024 & 2032
- Figure 24: Asia Pacific Ready to Drink Beverages Market Revenue (Million), by Product Type 2024 & 2032
- Figure 25: Asia Pacific Ready to Drink Beverages Market Revenue Share (%), by Product Type 2024 & 2032
- Figure 26: Asia Pacific Ready to Drink Beverages Market Revenue (Million), by Distribution Channel 2024 & 2032
- Figure 27: Asia Pacific Ready to Drink Beverages Market Revenue Share (%), by Distribution Channel 2024 & 2032
- Figure 28: Asia Pacific Ready to Drink Beverages Market Revenue (Million), by Country 2024 & 2032
- Figure 29: Asia Pacific Ready to Drink Beverages Market Revenue Share (%), by Country 2024 & 2032
- Figure 30: South America Ready to Drink Beverages Market Revenue (Million), by Product Type 2024 & 2032
- Figure 31: South America Ready to Drink Beverages Market Revenue Share (%), by Product Type 2024 & 2032
- Figure 32: South America Ready to Drink Beverages Market Revenue (Million), by Distribution Channel 2024 & 2032
- Figure 33: South America Ready to Drink Beverages Market Revenue Share (%), by Distribution Channel 2024 & 2032
- Figure 34: South America Ready to Drink Beverages Market Revenue (Million), by Country 2024 & 2032
- Figure 35: South America Ready to Drink Beverages Market Revenue Share (%), by Country 2024 & 2032
- Figure 36: Middle East and Africa Ready to Drink Beverages Market Revenue (Million), by Product Type 2024 & 2032
- Figure 37: Middle East and Africa Ready to Drink Beverages Market Revenue Share (%), by Product Type 2024 & 2032
- Figure 38: Middle East and Africa Ready to Drink Beverages Market Revenue (Million), by Distribution Channel 2024 & 2032
- Figure 39: Middle East and Africa Ready to Drink Beverages Market Revenue Share (%), by Distribution Channel 2024 & 2032
- Figure 40: Middle East and Africa Ready to Drink Beverages Market Revenue (Million), by Country 2024 & 2032
- Figure 41: Middle East and Africa Ready to Drink Beverages Market Revenue Share (%), by Country 2024 & 2032
List of Tables
- Table 1: Global Ready to Drink Beverages Market Revenue Million Forecast, by Region 2019 & 2032
- Table 2: Global Ready to Drink Beverages Market Revenue Million Forecast, by Product Type 2019 & 2032
- Table 3: Global Ready to Drink Beverages Market Revenue Million Forecast, by Distribution Channel 2019 & 2032
- Table 4: Global Ready to Drink Beverages Market Revenue Million Forecast, by Region 2019 & 2032
- Table 5: Global Ready to Drink Beverages Market Revenue Million Forecast, by Country 2019 & 2032
- Table 6: United States Ready to Drink Beverages Market Revenue (Million) Forecast, by Application 2019 & 2032
- Table 7: Canada Ready to Drink Beverages Market Revenue (Million) Forecast, by Application 2019 & 2032
- Table 8: Mexico Ready to Drink Beverages Market Revenue (Million) Forecast, by Application 2019 & 2032
- Table 9: Rest of North America Ready to Drink Beverages Market Revenue (Million) Forecast, by Application 2019 & 2032
- Table 10: Global Ready to Drink Beverages Market Revenue Million Forecast, by Country 2019 & 2032
- Table 11: Germany Ready to Drink Beverages Market Revenue (Million) Forecast, by Application 2019 & 2032
- Table 12: United Kingdom Ready to Drink Beverages Market Revenue (Million) Forecast, by Application 2019 & 2032
- Table 13: Italy Ready to Drink Beverages Market Revenue (Million) Forecast, by Application 2019 & 2032
- Table 14: Spain Ready to Drink Beverages Market Revenue (Million) Forecast, by Application 2019 & 2032
- Table 15: France Ready to Drink Beverages Market Revenue (Million) Forecast, by Application 2019 & 2032
- Table 16: Russia Ready to Drink Beverages Market Revenue (Million) Forecast, by Application 2019 & 2032
- Table 17: Rest of Europe Ready to Drink Beverages Market Revenue (Million) Forecast, by Application 2019 & 2032
- Table 18: Global Ready to Drink Beverages Market Revenue Million Forecast, by Country 2019 & 2032
- Table 19: China Ready to Drink Beverages Market Revenue (Million) Forecast, by Application 2019 & 2032
- Table 20: Japan Ready to Drink Beverages Market Revenue (Million) Forecast, by Application 2019 & 2032
- Table 21: India Ready to Drink Beverages Market Revenue (Million) Forecast, by Application 2019 & 2032
- Table 22: Australia Ready to Drink Beverages Market Revenue (Million) Forecast, by Application 2019 & 2032
- Table 23: Rest of Asia Pacific Ready to Drink Beverages Market Revenue (Million) Forecast, by Application 2019 & 2032
- Table 24: Global Ready to Drink Beverages Market Revenue Million Forecast, by Country 2019 & 2032
- Table 25: Brazil Ready to Drink Beverages Market Revenue (Million) Forecast, by Application 2019 & 2032
- Table 26: Argentina Ready to Drink Beverages Market Revenue (Million) Forecast, by Application 2019 & 2032
- Table 27: Rest of South America Ready to Drink Beverages Market Revenue (Million) Forecast, by Application 2019 & 2032
- Table 28: Global Ready to Drink Beverages Market Revenue Million Forecast, by Country 2019 & 2032
- Table 29: South Africa Ready to Drink Beverages Market Revenue (Million) Forecast, by Application 2019 & 2032
- Table 30: Saudi Arabia Ready to Drink Beverages Market Revenue (Million) Forecast, by Application 2019 & 2032
- Table 31: Rest of Middle East and Africa Ready to Drink Beverages Market Revenue (Million) Forecast, by Application 2019 & 2032
- Table 32: Global Ready to Drink Beverages Market Revenue Million Forecast, by Product Type 2019 & 2032
- Table 33: Global Ready to Drink Beverages Market Revenue Million Forecast, by Distribution Channel 2019 & 2032
- Table 34: Global Ready to Drink Beverages Market Revenue Million Forecast, by Country 2019 & 2032
- Table 35: United States Ready to Drink Beverages Market Revenue (Million) Forecast, by Application 2019 & 2032
- Table 36: Canada Ready to Drink Beverages Market Revenue (Million) Forecast, by Application 2019 & 2032
- Table 37: Mexico Ready to Drink Beverages Market Revenue (Million) Forecast, by Application 2019 & 2032
- Table 38: Rest of North America Ready to Drink Beverages Market Revenue (Million) Forecast, by Application 2019 & 2032
- Table 39: Global Ready to Drink Beverages Market Revenue Million Forecast, by Product Type 2019 & 2032
- Table 40: Global Ready to Drink Beverages Market Revenue Million Forecast, by Distribution Channel 2019 & 2032
- Table 41: Global Ready to Drink Beverages Market Revenue Million Forecast, by Country 2019 & 2032
- Table 42: Germany Ready to Drink Beverages Market Revenue (Million) Forecast, by Application 2019 & 2032
- Table 43: United Kingdom Ready to Drink Beverages Market Revenue (Million) Forecast, by Application 2019 & 2032
- Table 44: Italy Ready to Drink Beverages Market Revenue (Million) Forecast, by Application 2019 & 2032
- Table 45: Spain Ready to Drink Beverages Market Revenue (Million) Forecast, by Application 2019 & 2032
- Table 46: France Ready to Drink Beverages Market Revenue (Million) Forecast, by Application 2019 & 2032
- Table 47: Russia Ready to Drink Beverages Market Revenue (Million) Forecast, by Application 2019 & 2032
- Table 48: Rest of Europe Ready to Drink Beverages Market Revenue (Million) Forecast, by Application 2019 & 2032
- Table 49: Global Ready to Drink Beverages Market Revenue Million Forecast, by Product Type 2019 & 2032
- Table 50: Global Ready to Drink Beverages Market Revenue Million Forecast, by Distribution Channel 2019 & 2032
- Table 51: Global Ready to Drink Beverages Market Revenue Million Forecast, by Country 2019 & 2032
- Table 52: China Ready to Drink Beverages Market Revenue (Million) Forecast, by Application 2019 & 2032
- Table 53: Japan Ready to Drink Beverages Market Revenue (Million) Forecast, by Application 2019 & 2032
- Table 54: India Ready to Drink Beverages Market Revenue (Million) Forecast, by Application 2019 & 2032
- Table 55: Australia Ready to Drink Beverages Market Revenue (Million) Forecast, by Application 2019 & 2032
- Table 56: Rest of Asia Pacific Ready to Drink Beverages Market Revenue (Million) Forecast, by Application 2019 & 2032
- Table 57: Global Ready to Drink Beverages Market Revenue Million Forecast, by Product Type 2019 & 2032
- Table 58: Global Ready to Drink Beverages Market Revenue Million Forecast, by Distribution Channel 2019 & 2032
- Table 59: Global Ready to Drink Beverages Market Revenue Million Forecast, by Country 2019 & 2032
- Table 60: Brazil Ready to Drink Beverages Market Revenue (Million) Forecast, by Application 2019 & 2032
- Table 61: Argentina Ready to Drink Beverages Market Revenue (Million) Forecast, by Application 2019 & 2032
- Table 62: Rest of South America Ready to Drink Beverages Market Revenue (Million) Forecast, by Application 2019 & 2032
- Table 63: Global Ready to Drink Beverages Market Revenue Million Forecast, by Product Type 2019 & 2032
- Table 64: Global Ready to Drink Beverages Market Revenue Million Forecast, by Distribution Channel 2019 & 2032
- Table 65: Global Ready to Drink Beverages Market Revenue Million Forecast, by Country 2019 & 2032
- Table 66: South Africa Ready to Drink Beverages Market Revenue (Million) Forecast, by Application 2019 & 2032
- Table 67: Saudi Arabia Ready to Drink Beverages Market Revenue (Million) Forecast, by Application 2019 & 2032
- Table 68: Rest of Middle East and Africa Ready to Drink Beverages Market Revenue (Million) Forecast, by Application 2019 & 2032
Frequently Asked Questions
1. What is the projected Compound Annual Growth Rate (CAGR) of the Ready to Drink Beverages Market?
The projected CAGR is approximately 4.81%.
2. Which companies are prominent players in the Ready to Drink Beverages Market?
Key companies in the market include Nestle SA, Dabur India Limited*List Not Exhaustive, Monster Beverage Corporation, Yakult Honsha Co Ltd, Pepsico Inc, Danone SA, Suntory Holdings Limited, Red Bull GmbH, Blue Diamond Growers, The Coca-Cola Company.
3. What are the main segments of the Ready to Drink Beverages Market?
The market segments include Product Type, Distribution Channel.
4. Can you provide details about the market size?
The market size is estimated to be USD 361.01 Million as of 2022.
5. What are some drivers contributing to market growth?
Inclination Toward Low-Sugar/Sugar-free Beverages.
6. What are the notable trends driving market growth?
Augmented Expenditure on Advertisement and Promotional Activities Impel Market Growth.
7. Are there any restraints impacting market growth?
Concerns Over Health Issues Associated with Functional Beverages.
8. Can you provide examples of recent developments in the market?
February 2023: Pepsi Co. launched marshmallow-flavored Cola in partnership with Peeps. The pillowy-soft marshmallow cola flavor, paired with the instantly recognizable PEEPS®, comes in vibrant yellow packaging.
9. What pricing options are available for accessing the report?
Pricing options include single-user, multi-user, and enterprise licenses priced at USD 4750, USD 5250, and USD 8750 respectively.
10. Is the market size provided in terms of value or volume?
The market size is provided in terms of value, measured in Million.
11. Are there any specific market keywords associated with the report?
Yes, the market keyword associated with the report is "Ready to Drink Beverages Market," which aids in identifying and referencing the specific market segment covered.
12. How do I determine which pricing option suits my needs best?
The pricing options vary based on user requirements and access needs. Individual users may opt for single-user licenses, while businesses requiring broader access may choose multi-user or enterprise licenses for cost-effective access to the report.
13. Are there any additional resources or data provided in the Ready to Drink Beverages Market report?
While the report offers comprehensive insights, it's advisable to review the specific contents or supplementary materials provided to ascertain if additional resources or data are available.
14. How can I stay updated on further developments or reports in the Ready to Drink Beverages Market?
To stay informed about further developments, trends, and reports in the Ready to Drink Beverages Market, consider subscribing to industry newsletters, following relevant companies and organizations, or regularly checking reputable industry news sources and publications.
Methodology
Step 1 - Identification of Relevant Samples Size from Population Database


Step 2 - Approaches for Defining Global Market Size (Value, Volume* & Price*)

Note*: In applicable scenarios
Step 3 - Data Sources
Primary Research
- Web Analytics
- Survey Reports
- Research Institute
- Latest Research Reports
- Opinion Leaders
Secondary Research
- Annual Reports
- White Paper
- Latest Press Release
- Industry Association
- Paid Database
- Investor Presentations

Step 4 - Data Triangulation
Involves using different sources of information in order to increase the validity of a study
These sources are likely to be stakeholders in a program - participants, other researchers, program staff, other community members, and so on.
Then we put all data in single framework & apply various statistical tools to find out the dynamic on the market.
During the analysis stage, feedback from the stakeholder groups would be compared to determine areas of agreement as well as areas of divergence
