

Key Insights
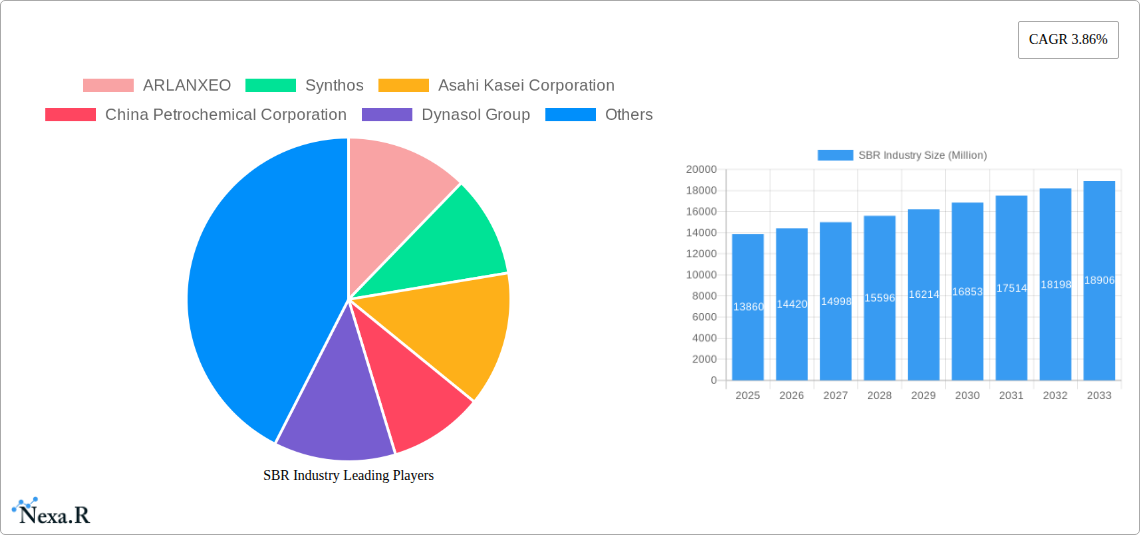
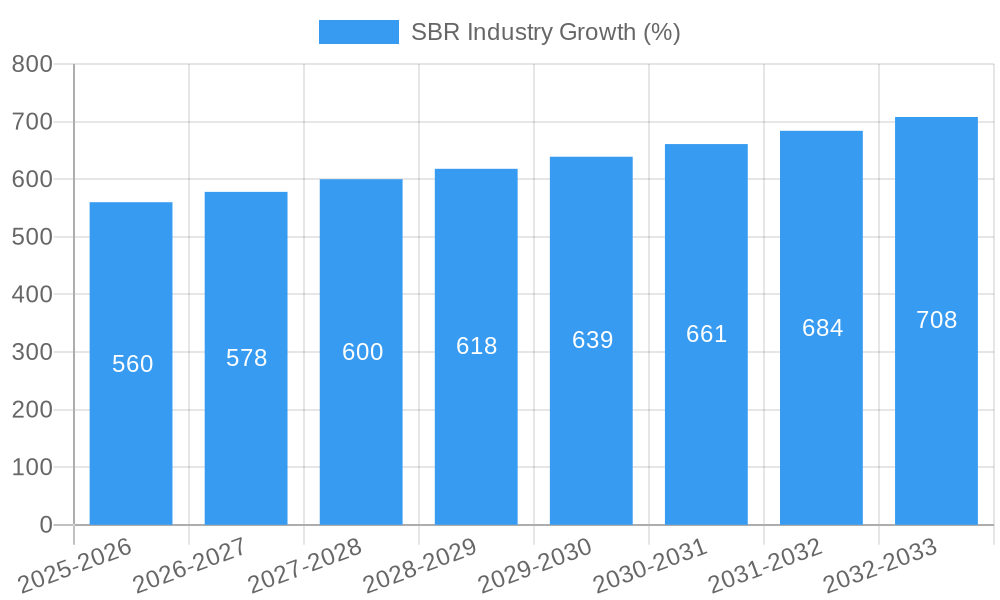
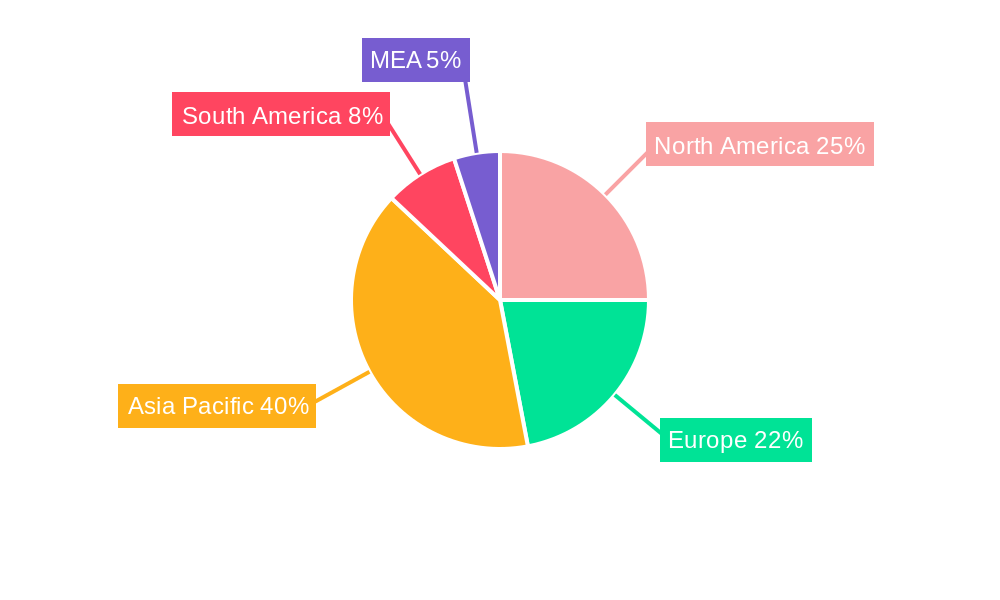
The global styrene-butadiene rubber (SBR) market, valued at $13.86 billion in 2025, is projected to experience steady growth, driven by robust demand from key application sectors. The compound annual growth rate (CAGR) of 3.86% from 2025 to 2033 reflects a continuous expansion, fueled primarily by the thriving automotive and construction industries. Growth within the tire segment remains a significant driver, with increasing vehicle production globally contributing to heightened SBR demand. The adhesives sector also presents a substantial market opportunity, leveraging SBR's excellent bonding properties in various applications. Furthermore, the footwear industry's ongoing reliance on SBR for sole manufacturing contributes to consistent market growth. The market is segmented by type into emulsion SBR and solution SBR, with emulsion SBR currently holding a larger market share due to its cost-effectiveness and versatility. Regional analysis reveals strong market presence in Asia-Pacific, driven by rapid industrialization and infrastructure development in countries like China and India. North America and Europe also contribute significantly, owing to established automotive and manufacturing sectors. However, fluctuating raw material prices and stringent environmental regulations pose challenges to market expansion. Competitive dynamics are characterized by the presence of major players like ARLANXEO, Synthos, and Asahi Kasei Corporation, among others, engaging in strategic partnerships, capacity expansions, and product innovation to maintain their market share.
The forecast period (2025-2033) anticipates continued growth, albeit at a moderate pace, influenced by factors such as economic fluctuations and advancements in alternative materials. However, the long-term outlook remains positive, bolstered by increasing infrastructure development globally, particularly in emerging economies. Specific growth within segments like solution SBR is anticipated, driven by the need for improved performance characteristics in high-performance applications. Continuous innovation in SBR technology, focusing on sustainability and enhanced properties, will play a crucial role in shaping future market dynamics. The industry is also likely to witness increased focus on regional diversification to mitigate risks associated with geopolitical factors and supply chain disruptions. Overall, the SBR market demonstrates resilience and potential for sustained expansion throughout the forecast period.
SBR Industry Market Report: 2019-2033
A Comprehensive Analysis of the Styrene-Butadiene Rubber (SBR) Market, encompassing its dynamics, growth trends, key players, and future outlook. This report provides in-depth insights into the global SBR industry, examining its historical performance (2019-2024), current state (2025), and future projections (2025-2033). We analyze key market segments (Emulsion SBR, Solution SBR) and applications (Tyres, Adhesives, Footwear, Construction Materials), identifying dominant regions and uncovering emerging opportunities. The report features detailed profiles of key players such as ARLANXEO, Synthos, Asahi Kasei Corporation, and more, and includes analysis of recent industry developments. This is an indispensable resource for industry professionals, investors, and anyone seeking a comprehensive understanding of the SBR market.
SBR Industry Market Dynamics & Structure
The global SBR market, valued at xx Million in 2024, exhibits a moderately consolidated structure with several large players holding significant market shares. Technological innovation, particularly in sustainable SBR production, is a key driver, alongside evolving regulatory frameworks promoting environmentally friendly materials. Competition from alternative materials, including natural rubber and other synthetic rubbers, presents a challenge. End-user demographics, especially the growing demand from the automotive and construction sectors, significantly influence market growth. M&A activity within the industry has been moderate in recent years, with a total deal volume of xx in the last five years.
- Market Concentration: Moderately consolidated, with top 5 players holding approximately xx% market share.
- Technological Innovation: Focus on sustainable SBR production and improved performance characteristics.
- Regulatory Landscape: Stringent environmental regulations influencing material selection and production methods.
- Competitive Substitutes: Natural rubber and other synthetic rubbers pose a competitive threat.
- End-User Demographics: Growing demand from automotive, construction, and footwear industries.
- M&A Trends: Moderate activity in recent years, driven by consolidation and expansion strategies. Innovation barriers include high R&D costs and the need for specialized expertise.
SBR Industry Growth Trends & Insights
The SBR market experienced a CAGR of xx% during the historical period (2019-2024), driven by strong demand from the tire industry and increasing adoption in other applications. Market size is projected to reach xx Million in 2025 and xx Million by 2033, exhibiting a CAGR of xx% during the forecast period (2025-2033). Technological advancements in SBR production, leading to enhanced product performance and sustainability, are accelerating market growth. Consumer preferences towards eco-friendly and high-performance products are further boosting the market. Market penetration in emerging economies remains relatively low, presenting significant growth opportunities.
Dominant Regions, Countries, or Segments in SBR Industry
Asia Pacific is the leading region in the SBR market, driven by significant production capacity and high demand from the automotive and construction industries. China, in particular, plays a crucial role due to its robust manufacturing base and expanding infrastructure projects. Within the application segments, the tire industry is the largest consumer of SBR, representing approximately xx% of total market demand. The Emulsion SBR type holds the largest market share compared to Solution SBR due to its cost-effectiveness and versatility.
- Key Drivers in Asia Pacific: Robust economic growth, expanding automotive and construction sectors, and increasing infrastructure development.
- China's dominance: Large production capacity, substantial domestic demand, and strategic government initiatives.
- Tire Industry's leading role: High SBR consumption in tire manufacturing, driven by rising vehicle production.
- Emulsion SBR's market leadership: Cost-effectiveness and versatile applications drive its dominance.
SBR Industry Product Landscape
SBR products are continually evolving, with a focus on enhancing performance characteristics such as abrasion resistance, tensile strength, and processability. Innovations in polymer chemistry and manufacturing processes are resulting in new grades of SBR with improved sustainability profiles. Manufacturers are emphasizing unique selling propositions such as reduced environmental impact and enhanced product durability to cater to the changing market demands. Technological advancements are aimed at producing SBR with superior properties, better suited to demanding applications.
Key Drivers, Barriers & Challenges in SBR Industry
Key Drivers:
- Growing demand from the automotive and construction industries.
- Technological advancements leading to improved product properties and sustainability.
- Expanding infrastructure projects in developing economies.
Challenges and Restraints:
- Fluctuations in raw material prices (e.g., styrene and butadiene).
- Stringent environmental regulations impacting production costs.
- Competition from substitute materials and technological advancements. This leads to approximately xx Million in annual revenue loss.
Emerging Opportunities in SBR Industry
- Growing demand for sustainable and bio-based SBR.
- Expansion into new applications, such as in renewable energy technologies.
- Penetration of emerging markets in Asia, Africa, and Latin America.
Growth Accelerators in the SBR Industry
Technological advancements in SBR production, fostering improvements in performance, sustainability, and cost-effectiveness, are key drivers of long-term growth. Strategic partnerships between SBR manufacturers and downstream industries are enabling the development of innovative solutions and expanding market reach. The expansion of the automotive and construction industries in developing economies will continue to fuel market growth.
Key Players Shaping the SBR Industry Market
- ARLANXEO
- Synthos
- Asahi Kasei Corporation
- China Petrochemical Corporation
- Dynasol Group
- Versalis SpA
- KUMHO PETROCHEMICAL
- ENEOS Corporation
- LANXESS
- Kemipex
- Trinseo
- LG Chem
- Sumitomo Chemical Asia Pte Ltd
Notable Milestones in SBR Industry Sector
- December 2023: Synthos signed an MOU with Kumho Tire to develop sustainable tire raw materials.
- April 2023: Hainan Baling Chemical (subsidiary of China Petroleum & Chemical Corporation) commenced SBR production in Hainan, China, with an annual capacity of 170,000 tons, representing a USD 279.74 Million investment.
In-Depth SBR Industry Market Outlook
The SBR market is poised for continued growth, driven by technological innovations, expanding applications, and increasing demand from key end-use sectors. Strategic partnerships, investments in sustainable production, and expansion into new geographical markets will be crucial for achieving long-term success in this dynamic industry. The market exhibits significant potential for further expansion, especially in emerging economies.
SBR Industry Segmentation
-
1. Type
- 1.1. Emulsion SBR
- 1.2. Solution SBR
-
2. Application
- 2.1. Tyres
- 2.2. Adhesives
- 2.3. Footwear
- 2.4. Other Applications (Construction Materials)
SBR Industry Segmentation By Geography
-
1. Asia Pacific
- 1.1. China
- 1.2. India
- 1.3. Japan
- 1.4. South Korea
- 1.5. Thailand
- 1.6. Malaysia
- 1.7. Vietnam
- 1.8. Indonesia
- 1.9. Rest of Asia Pacific
-
2. North America
- 2.1. United States
- 2.2. Canada
- 2.3. Mexico
-
3. Europe
- 3.1. United Kingdom
- 3.2. France
- 3.3. Germany
- 3.4. Italy
- 3.5. Spain
- 3.6. Turkey
- 3.7. Russia
- 3.8. NORDIC
- 3.9. Rest of Europe
-
4. South America
- 4.1. Brazil
- 4.2. Argentina
- 4.3. Colombia
- 4.4. Rest of South America
- 5. Middle East
-
6. South Africa
- 6.1. Saudi Arabia
- 6.2. Nigeria
- 6.3. Egypt
- 6.4. Qatar
- 6.5. United Arab Emirates
- 6.6. Rest of Middle East
SBR Industry REPORT HIGHLIGHTS
| Aspects | Details |
|---|---|
| Study Period | 2019-2033 |
| Base Year | 2024 |
| Estimated Year | 2025 |
| Forecast Period | 2025-2033 |
| Historical Period | 2019-2024 |
| Growth Rate | CAGR of 3.86% from 2019-2033 |
| Segmentation |
|
Table of Contents
- 1. Introduction
- 1.1. Research Scope
- 1.2. Market Segmentation
- 1.3. Research Methodology
- 1.4. Definitions and Assumptions
- 2. Executive Summary
- 2.1. Introduction
- 3. Market Dynamics
- 3.1. Introduction
- 3.2. Market Drivers
- 3.2.1. Increasing Usage of Natural Rubber and SBR Crossover Products; Increasing Demand from Adhesives and Sealants Industry
- 3.3. Market Restrains
- 3.3.1. Volatile Raw Material Prices; Substitution by Sustainable Materials
- 3.4. Market Trends
- 3.4.1. Adhesives Segment to Dominate the Market
- 4. Market Factor Analysis
- 4.1. Porters Five Forces
- 4.2. Supply/Value Chain
- 4.3. PESTEL analysis
- 4.4. Market Entropy
- 4.5. Patent/Trademark Analysis
- 5. Global SBR Industry Analysis, Insights and Forecast, 2019-2031
- 5.1. Market Analysis, Insights and Forecast - by Type
- 5.1.1. Emulsion SBR
- 5.1.2. Solution SBR
- 5.2. Market Analysis, Insights and Forecast - by Application
- 5.2.1. Tyres
- 5.2.2. Adhesives
- 5.2.3. Footwear
- 5.2.4. Other Applications (Construction Materials)
- 5.3. Market Analysis, Insights and Forecast - by Region
- 5.3.1. Asia Pacific
- 5.3.2. North America
- 5.3.3. Europe
- 5.3.4. South America
- 5.3.5. Middle East
- 5.3.6. South Africa
- 5.1. Market Analysis, Insights and Forecast - by Type
- 6. Asia Pacific SBR Industry Analysis, Insights and Forecast, 2019-2031
- 6.1. Market Analysis, Insights and Forecast - by Type
- 6.1.1. Emulsion SBR
- 6.1.2. Solution SBR
- 6.2. Market Analysis, Insights and Forecast - by Application
- 6.2.1. Tyres
- 6.2.2. Adhesives
- 6.2.3. Footwear
- 6.2.4. Other Applications (Construction Materials)
- 6.1. Market Analysis, Insights and Forecast - by Type
- 7. North America SBR Industry Analysis, Insights and Forecast, 2019-2031
- 7.1. Market Analysis, Insights and Forecast - by Type
- 7.1.1. Emulsion SBR
- 7.1.2. Solution SBR
- 7.2. Market Analysis, Insights and Forecast - by Application
- 7.2.1. Tyres
- 7.2.2. Adhesives
- 7.2.3. Footwear
- 7.2.4. Other Applications (Construction Materials)
- 7.1. Market Analysis, Insights and Forecast - by Type
- 8. Europe SBR Industry Analysis, Insights and Forecast, 2019-2031
- 8.1. Market Analysis, Insights and Forecast - by Type
- 8.1.1. Emulsion SBR
- 8.1.2. Solution SBR
- 8.2. Market Analysis, Insights and Forecast - by Application
- 8.2.1. Tyres
- 8.2.2. Adhesives
- 8.2.3. Footwear
- 8.2.4. Other Applications (Construction Materials)
- 8.1. Market Analysis, Insights and Forecast - by Type
- 9. South America SBR Industry Analysis, Insights and Forecast, 2019-2031
- 9.1. Market Analysis, Insights and Forecast - by Type
- 9.1.1. Emulsion SBR
- 9.1.2. Solution SBR
- 9.2. Market Analysis, Insights and Forecast - by Application
- 9.2.1. Tyres
- 9.2.2. Adhesives
- 9.2.3. Footwear
- 9.2.4. Other Applications (Construction Materials)
- 9.1. Market Analysis, Insights and Forecast - by Type
- 10. Middle East SBR Industry Analysis, Insights and Forecast, 2019-2031
- 10.1. Market Analysis, Insights and Forecast - by Type
- 10.1.1. Emulsion SBR
- 10.1.2. Solution SBR
- 10.2. Market Analysis, Insights and Forecast - by Application
- 10.2.1. Tyres
- 10.2.2. Adhesives
- 10.2.3. Footwear
- 10.2.4. Other Applications (Construction Materials)
- 10.1. Market Analysis, Insights and Forecast - by Type
- 11. South Africa SBR Industry Analysis, Insights and Forecast, 2019-2031
- 11.1. Market Analysis, Insights and Forecast - by Type
- 11.1.1. Emulsion SBR
- 11.1.2. Solution SBR
- 11.2. Market Analysis, Insights and Forecast - by Application
- 11.2.1. Tyres
- 11.2.2. Adhesives
- 11.2.3. Footwear
- 11.2.4. Other Applications (Construction Materials)
- 11.1. Market Analysis, Insights and Forecast - by Type
- 12. Europe SBR Industry Analysis, Insights and Forecast, 2019-2031
- 12.1. Market Analysis, Insights and Forecast - By Country/Sub-region
- 12.1.1 Germany
- 12.1.2 United Kingdom
- 12.1.3 France
- 12.1.4 Spain
- 12.1.5 Italy
- 12.1.6 Spain
- 12.1.7 Belgium
- 12.1.8 Netherland
- 12.1.9 Nordics
- 12.1.10 Rest of Europe
- 13. Asia Pacific SBR Industry Analysis, Insights and Forecast, 2019-2031
- 13.1. Market Analysis, Insights and Forecast - By Country/Sub-region
- 13.1.1 China
- 13.1.2 Japan
- 13.1.3 India
- 13.1.4 South Korea
- 13.1.5 Southeast Asia
- 13.1.6 Australia
- 13.1.7 Indonesia
- 13.1.8 Phillipes
- 13.1.9 Singapore
- 13.1.10 Thailandc
- 13.1.11 Rest of Asia Pacific
- 14. South America SBR Industry Analysis, Insights and Forecast, 2019-2031
- 14.1. Market Analysis, Insights and Forecast - By Country/Sub-region
- 14.1.1 Brazil
- 14.1.2 Argentina
- 14.1.3 Peru
- 14.1.4 Chile
- 14.1.5 Colombia
- 14.1.6 Ecuador
- 14.1.7 Venezuela
- 14.1.8 Rest of South America
- 15. North America SBR Industry Analysis, Insights and Forecast, 2019-2031
- 15.1. Market Analysis, Insights and Forecast - By Country/Sub-region
- 15.1.1 United States
- 15.1.2 Canada
- 15.1.3 Mexico
- 16. MEA SBR Industry Analysis, Insights and Forecast, 2019-2031
- 16.1. Market Analysis, Insights and Forecast - By Country/Sub-region
- 16.1.1 United Arab Emirates
- 16.1.2 Saudi Arabia
- 16.1.3 South Africa
- 16.1.4 Rest of Middle East and Africa
- 17. Competitive Analysis
- 17.1. Global Market Share Analysis 2024
- 17.2. Company Profiles
- 17.2.1 ARLANXEO
- 17.2.1.1. Overview
- 17.2.1.2. Products
- 17.2.1.3. SWOT Analysis
- 17.2.1.4. Recent Developments
- 17.2.1.5. Financials (Based on Availability)
- 17.2.2 Synthos
- 17.2.2.1. Overview
- 17.2.2.2. Products
- 17.2.2.3. SWOT Analysis
- 17.2.2.4. Recent Developments
- 17.2.2.5. Financials (Based on Availability)
- 17.2.3 Asahi Kasei Corporation
- 17.2.3.1. Overview
- 17.2.3.2. Products
- 17.2.3.3. SWOT Analysis
- 17.2.3.4. Recent Developments
- 17.2.3.5. Financials (Based on Availability)
- 17.2.4 China Petrochemical Corporation
- 17.2.4.1. Overview
- 17.2.4.2. Products
- 17.2.4.3. SWOT Analysis
- 17.2.4.4. Recent Developments
- 17.2.4.5. Financials (Based on Availability)
- 17.2.5 Dynasol Group
- 17.2.5.1. Overview
- 17.2.5.2. Products
- 17.2.5.3. SWOT Analysis
- 17.2.5.4. Recent Developments
- 17.2.5.5. Financials (Based on Availability)
- 17.2.6 Versalis SpA*List Not Exhaustive
- 17.2.6.1. Overview
- 17.2.6.2. Products
- 17.2.6.3. SWOT Analysis
- 17.2.6.4. Recent Developments
- 17.2.6.5. Financials (Based on Availability)
- 17.2.7 KUMHO PETROCHEMICAL
- 17.2.7.1. Overview
- 17.2.7.2. Products
- 17.2.7.3. SWOT Analysis
- 17.2.7.4. Recent Developments
- 17.2.7.5. Financials (Based on Availability)
- 17.2.8 ENEOS Corporation
- 17.2.8.1. Overview
- 17.2.8.2. Products
- 17.2.8.3. SWOT Analysis
- 17.2.8.4. Recent Developments
- 17.2.8.5. Financials (Based on Availability)
- 17.2.9 LANXESS
- 17.2.9.1. Overview
- 17.2.9.2. Products
- 17.2.9.3. SWOT Analysis
- 17.2.9.4. Recent Developments
- 17.2.9.5. Financials (Based on Availability)
- 17.2.10 Kemipex
- 17.2.10.1. Overview
- 17.2.10.2. Products
- 17.2.10.3. SWOT Analysis
- 17.2.10.4. Recent Developments
- 17.2.10.5. Financials (Based on Availability)
- 17.2.11 Trinseo
- 17.2.11.1. Overview
- 17.2.11.2. Products
- 17.2.11.3. SWOT Analysis
- 17.2.11.4. Recent Developments
- 17.2.11.5. Financials (Based on Availability)
- 17.2.12 LG Chem
- 17.2.12.1. Overview
- 17.2.12.2. Products
- 17.2.12.3. SWOT Analysis
- 17.2.12.4. Recent Developments
- 17.2.12.5. Financials (Based on Availability)
- 17.2.13 Sumitomo Chemical Asia Pte Ltd
- 17.2.13.1. Overview
- 17.2.13.2. Products
- 17.2.13.3. SWOT Analysis
- 17.2.13.4. Recent Developments
- 17.2.13.5. Financials (Based on Availability)
- 17.2.1 ARLANXEO
List of Figures
- Figure 1: Global SBR Industry Revenue Breakdown (Million, %) by Region 2024 & 2032
- Figure 2: Europe SBR Industry Revenue (Million), by Country 2024 & 2032
- Figure 3: Europe SBR Industry Revenue Share (%), by Country 2024 & 2032
- Figure 4: Asia Pacific SBR Industry Revenue (Million), by Country 2024 & 2032
- Figure 5: Asia Pacific SBR Industry Revenue Share (%), by Country 2024 & 2032
- Figure 6: South America SBR Industry Revenue (Million), by Country 2024 & 2032
- Figure 7: South America SBR Industry Revenue Share (%), by Country 2024 & 2032
- Figure 8: North America SBR Industry Revenue (Million), by Country 2024 & 2032
- Figure 9: North America SBR Industry Revenue Share (%), by Country 2024 & 2032
- Figure 10: MEA SBR Industry Revenue (Million), by Country 2024 & 2032
- Figure 11: MEA SBR Industry Revenue Share (%), by Country 2024 & 2032
- Figure 12: Asia Pacific SBR Industry Revenue (Million), by Type 2024 & 2032
- Figure 13: Asia Pacific SBR Industry Revenue Share (%), by Type 2024 & 2032
- Figure 14: Asia Pacific SBR Industry Revenue (Million), by Application 2024 & 2032
- Figure 15: Asia Pacific SBR Industry Revenue Share (%), by Application 2024 & 2032
- Figure 16: Asia Pacific SBR Industry Revenue (Million), by Country 2024 & 2032
- Figure 17: Asia Pacific SBR Industry Revenue Share (%), by Country 2024 & 2032
- Figure 18: North America SBR Industry Revenue (Million), by Type 2024 & 2032
- Figure 19: North America SBR Industry Revenue Share (%), by Type 2024 & 2032
- Figure 20: North America SBR Industry Revenue (Million), by Application 2024 & 2032
- Figure 21: North America SBR Industry Revenue Share (%), by Application 2024 & 2032
- Figure 22: North America SBR Industry Revenue (Million), by Country 2024 & 2032
- Figure 23: North America SBR Industry Revenue Share (%), by Country 2024 & 2032
- Figure 24: Europe SBR Industry Revenue (Million), by Type 2024 & 2032
- Figure 25: Europe SBR Industry Revenue Share (%), by Type 2024 & 2032
- Figure 26: Europe SBR Industry Revenue (Million), by Application 2024 & 2032
- Figure 27: Europe SBR Industry Revenue Share (%), by Application 2024 & 2032
- Figure 28: Europe SBR Industry Revenue (Million), by Country 2024 & 2032
- Figure 29: Europe SBR Industry Revenue Share (%), by Country 2024 & 2032
- Figure 30: South America SBR Industry Revenue (Million), by Type 2024 & 2032
- Figure 31: South America SBR Industry Revenue Share (%), by Type 2024 & 2032
- Figure 32: South America SBR Industry Revenue (Million), by Application 2024 & 2032
- Figure 33: South America SBR Industry Revenue Share (%), by Application 2024 & 2032
- Figure 34: South America SBR Industry Revenue (Million), by Country 2024 & 2032
- Figure 35: South America SBR Industry Revenue Share (%), by Country 2024 & 2032
- Figure 36: Middle East SBR Industry Revenue (Million), by Type 2024 & 2032
- Figure 37: Middle East SBR Industry Revenue Share (%), by Type 2024 & 2032
- Figure 38: Middle East SBR Industry Revenue (Million), by Application 2024 & 2032
- Figure 39: Middle East SBR Industry Revenue Share (%), by Application 2024 & 2032
- Figure 40: Middle East SBR Industry Revenue (Million), by Country 2024 & 2032
- Figure 41: Middle East SBR Industry Revenue Share (%), by Country 2024 & 2032
- Figure 42: South Africa SBR Industry Revenue (Million), by Type 2024 & 2032
- Figure 43: South Africa SBR Industry Revenue Share (%), by Type 2024 & 2032
- Figure 44: South Africa SBR Industry Revenue (Million), by Application 2024 & 2032
- Figure 45: South Africa SBR Industry Revenue Share (%), by Application 2024 & 2032
- Figure 46: South Africa SBR Industry Revenue (Million), by Country 2024 & 2032
- Figure 47: South Africa SBR Industry Revenue Share (%), by Country 2024 & 2032
List of Tables
- Table 1: Global SBR Industry Revenue Million Forecast, by Region 2019 & 2032
- Table 2: Global SBR Industry Revenue Million Forecast, by Type 2019 & 2032
- Table 3: Global SBR Industry Revenue Million Forecast, by Application 2019 & 2032
- Table 4: Global SBR Industry Revenue Million Forecast, by Region 2019 & 2032
- Table 5: Global SBR Industry Revenue Million Forecast, by Country 2019 & 2032
- Table 6: Germany SBR Industry Revenue (Million) Forecast, by Application 2019 & 2032
- Table 7: United Kingdom SBR Industry Revenue (Million) Forecast, by Application 2019 & 2032
- Table 8: France SBR Industry Revenue (Million) Forecast, by Application 2019 & 2032
- Table 9: Spain SBR Industry Revenue (Million) Forecast, by Application 2019 & 2032
- Table 10: Italy SBR Industry Revenue (Million) Forecast, by Application 2019 & 2032
- Table 11: Spain SBR Industry Revenue (Million) Forecast, by Application 2019 & 2032
- Table 12: Belgium SBR Industry Revenue (Million) Forecast, by Application 2019 & 2032
- Table 13: Netherland SBR Industry Revenue (Million) Forecast, by Application 2019 & 2032
- Table 14: Nordics SBR Industry Revenue (Million) Forecast, by Application 2019 & 2032
- Table 15: Rest of Europe SBR Industry Revenue (Million) Forecast, by Application 2019 & 2032
- Table 16: Global SBR Industry Revenue Million Forecast, by Country 2019 & 2032
- Table 17: China SBR Industry Revenue (Million) Forecast, by Application 2019 & 2032
- Table 18: Japan SBR Industry Revenue (Million) Forecast, by Application 2019 & 2032
- Table 19: India SBR Industry Revenue (Million) Forecast, by Application 2019 & 2032
- Table 20: South Korea SBR Industry Revenue (Million) Forecast, by Application 2019 & 2032
- Table 21: Southeast Asia SBR Industry Revenue (Million) Forecast, by Application 2019 & 2032
- Table 22: Australia SBR Industry Revenue (Million) Forecast, by Application 2019 & 2032
- Table 23: Indonesia SBR Industry Revenue (Million) Forecast, by Application 2019 & 2032
- Table 24: Phillipes SBR Industry Revenue (Million) Forecast, by Application 2019 & 2032
- Table 25: Singapore SBR Industry Revenue (Million) Forecast, by Application 2019 & 2032
- Table 26: Thailandc SBR Industry Revenue (Million) Forecast, by Application 2019 & 2032
- Table 27: Rest of Asia Pacific SBR Industry Revenue (Million) Forecast, by Application 2019 & 2032
- Table 28: Global SBR Industry Revenue Million Forecast, by Country 2019 & 2032
- Table 29: Brazil SBR Industry Revenue (Million) Forecast, by Application 2019 & 2032
- Table 30: Argentina SBR Industry Revenue (Million) Forecast, by Application 2019 & 2032
- Table 31: Peru SBR Industry Revenue (Million) Forecast, by Application 2019 & 2032
- Table 32: Chile SBR Industry Revenue (Million) Forecast, by Application 2019 & 2032
- Table 33: Colombia SBR Industry Revenue (Million) Forecast, by Application 2019 & 2032
- Table 34: Ecuador SBR Industry Revenue (Million) Forecast, by Application 2019 & 2032
- Table 35: Venezuela SBR Industry Revenue (Million) Forecast, by Application 2019 & 2032
- Table 36: Rest of South America SBR Industry Revenue (Million) Forecast, by Application 2019 & 2032
- Table 37: Global SBR Industry Revenue Million Forecast, by Country 2019 & 2032
- Table 38: United States SBR Industry Revenue (Million) Forecast, by Application 2019 & 2032
- Table 39: Canada SBR Industry Revenue (Million) Forecast, by Application 2019 & 2032
- Table 40: Mexico SBR Industry Revenue (Million) Forecast, by Application 2019 & 2032
- Table 41: Global SBR Industry Revenue Million Forecast, by Country 2019 & 2032
- Table 42: United Arab Emirates SBR Industry Revenue (Million) Forecast, by Application 2019 & 2032
- Table 43: Saudi Arabia SBR Industry Revenue (Million) Forecast, by Application 2019 & 2032
- Table 44: South Africa SBR Industry Revenue (Million) Forecast, by Application 2019 & 2032
- Table 45: Rest of Middle East and Africa SBR Industry Revenue (Million) Forecast, by Application 2019 & 2032
- Table 46: Global SBR Industry Revenue Million Forecast, by Type 2019 & 2032
- Table 47: Global SBR Industry Revenue Million Forecast, by Application 2019 & 2032
- Table 48: Global SBR Industry Revenue Million Forecast, by Country 2019 & 2032
- Table 49: China SBR Industry Revenue (Million) Forecast, by Application 2019 & 2032
- Table 50: India SBR Industry Revenue (Million) Forecast, by Application 2019 & 2032
- Table 51: Japan SBR Industry Revenue (Million) Forecast, by Application 2019 & 2032
- Table 52: South Korea SBR Industry Revenue (Million) Forecast, by Application 2019 & 2032
- Table 53: Thailand SBR Industry Revenue (Million) Forecast, by Application 2019 & 2032
- Table 54: Malaysia SBR Industry Revenue (Million) Forecast, by Application 2019 & 2032
- Table 55: Vietnam SBR Industry Revenue (Million) Forecast, by Application 2019 & 2032
- Table 56: Indonesia SBR Industry Revenue (Million) Forecast, by Application 2019 & 2032
- Table 57: Rest of Asia Pacific SBR Industry Revenue (Million) Forecast, by Application 2019 & 2032
- Table 58: Global SBR Industry Revenue Million Forecast, by Type 2019 & 2032
- Table 59: Global SBR Industry Revenue Million Forecast, by Application 2019 & 2032
- Table 60: Global SBR Industry Revenue Million Forecast, by Country 2019 & 2032
- Table 61: United States SBR Industry Revenue (Million) Forecast, by Application 2019 & 2032
- Table 62: Canada SBR Industry Revenue (Million) Forecast, by Application 2019 & 2032
- Table 63: Mexico SBR Industry Revenue (Million) Forecast, by Application 2019 & 2032
- Table 64: Global SBR Industry Revenue Million Forecast, by Type 2019 & 2032
- Table 65: Global SBR Industry Revenue Million Forecast, by Application 2019 & 2032
- Table 66: Global SBR Industry Revenue Million Forecast, by Country 2019 & 2032
- Table 67: United Kingdom SBR Industry Revenue (Million) Forecast, by Application 2019 & 2032
- Table 68: France SBR Industry Revenue (Million) Forecast, by Application 2019 & 2032
- Table 69: Germany SBR Industry Revenue (Million) Forecast, by Application 2019 & 2032
- Table 70: Italy SBR Industry Revenue (Million) Forecast, by Application 2019 & 2032
- Table 71: Spain SBR Industry Revenue (Million) Forecast, by Application 2019 & 2032
- Table 72: Turkey SBR Industry Revenue (Million) Forecast, by Application 2019 & 2032
- Table 73: Russia SBR Industry Revenue (Million) Forecast, by Application 2019 & 2032
- Table 74: NORDIC SBR Industry Revenue (Million) Forecast, by Application 2019 & 2032
- Table 75: Rest of Europe SBR Industry Revenue (Million) Forecast, by Application 2019 & 2032
- Table 76: Global SBR Industry Revenue Million Forecast, by Type 2019 & 2032
- Table 77: Global SBR Industry Revenue Million Forecast, by Application 2019 & 2032
- Table 78: Global SBR Industry Revenue Million Forecast, by Country 2019 & 2032
- Table 79: Brazil SBR Industry Revenue (Million) Forecast, by Application 2019 & 2032
- Table 80: Argentina SBR Industry Revenue (Million) Forecast, by Application 2019 & 2032
- Table 81: Colombia SBR Industry Revenue (Million) Forecast, by Application 2019 & 2032
- Table 82: Rest of South America SBR Industry Revenue (Million) Forecast, by Application 2019 & 2032
- Table 83: Global SBR Industry Revenue Million Forecast, by Type 2019 & 2032
- Table 84: Global SBR Industry Revenue Million Forecast, by Application 2019 & 2032
- Table 85: Global SBR Industry Revenue Million Forecast, by Country 2019 & 2032
- Table 86: Global SBR Industry Revenue Million Forecast, by Type 2019 & 2032
- Table 87: Global SBR Industry Revenue Million Forecast, by Application 2019 & 2032
- Table 88: Global SBR Industry Revenue Million Forecast, by Country 2019 & 2032
- Table 89: Saudi Arabia SBR Industry Revenue (Million) Forecast, by Application 2019 & 2032
- Table 90: Nigeria SBR Industry Revenue (Million) Forecast, by Application 2019 & 2032
- Table 91: Egypt SBR Industry Revenue (Million) Forecast, by Application 2019 & 2032
- Table 92: Qatar SBR Industry Revenue (Million) Forecast, by Application 2019 & 2032
- Table 93: United Arab Emirates SBR Industry Revenue (Million) Forecast, by Application 2019 & 2032
- Table 94: Rest of Middle East SBR Industry Revenue (Million) Forecast, by Application 2019 & 2032
Frequently Asked Questions
1. What is the projected Compound Annual Growth Rate (CAGR) of the SBR Industry?
The projected CAGR is approximately 3.86%.
2. Which companies are prominent players in the SBR Industry?
Key companies in the market include ARLANXEO, Synthos, Asahi Kasei Corporation, China Petrochemical Corporation, Dynasol Group, Versalis SpA*List Not Exhaustive, KUMHO PETROCHEMICAL, ENEOS Corporation, LANXESS, Kemipex, Trinseo, LG Chem, Sumitomo Chemical Asia Pte Ltd.
3. What are the main segments of the SBR Industry?
The market segments include Type, Application.
4. Can you provide details about the market size?
The market size is estimated to be USD 13.86 Million as of 2022.
5. What are some drivers contributing to market growth?
Increasing Usage of Natural Rubber and SBR Crossover Products; Increasing Demand from Adhesives and Sealants Industry.
6. What are the notable trends driving market growth?
Adhesives Segment to Dominate the Market.
7. Are there any restraints impacting market growth?
Volatile Raw Material Prices; Substitution by Sustainable Materials.
8. Can you provide examples of recent developments in the market?
December 2023: Synthos signed a Memorandum of Understanding (MOU) with Kumho Tire - a leading South Korean tire manufacturer. This collaboration is intended to develop sustainable raw materials for tires.
9. What pricing options are available for accessing the report?
Pricing options include single-user, multi-user, and enterprise licenses priced at USD 4750, USD 5250, and USD 8750 respectively.
10. Is the market size provided in terms of value or volume?
The market size is provided in terms of value, measured in Million.
11. Are there any specific market keywords associated with the report?
Yes, the market keyword associated with the report is "SBR Industry," which aids in identifying and referencing the specific market segment covered.
12. How do I determine which pricing option suits my needs best?
The pricing options vary based on user requirements and access needs. Individual users may opt for single-user licenses, while businesses requiring broader access may choose multi-user or enterprise licenses for cost-effective access to the report.
13. Are there any additional resources or data provided in the SBR Industry report?
While the report offers comprehensive insights, it's advisable to review the specific contents or supplementary materials provided to ascertain if additional resources or data are available.
14. How can I stay updated on further developments or reports in the SBR Industry?
To stay informed about further developments, trends, and reports in the SBR Industry, consider subscribing to industry newsletters, following relevant companies and organizations, or regularly checking reputable industry news sources and publications.
Methodology
Step 1 - Identification of Relevant Samples Size from Population Database


Step 2 - Approaches for Defining Global Market Size (Value, Volume* & Price*)

Note*: In applicable scenarios
Step 3 - Data Sources
Primary Research
- Web Analytics
- Survey Reports
- Research Institute
- Latest Research Reports
- Opinion Leaders
Secondary Research
- Annual Reports
- White Paper
- Latest Press Release
- Industry Association
- Paid Database
- Investor Presentations

Step 4 - Data Triangulation
Involves using different sources of information in order to increase the validity of a study
These sources are likely to be stakeholders in a program - participants, other researchers, program staff, other community members, and so on.
Then we put all data in single framework & apply various statistical tools to find out the dynamic on the market.
During the analysis stage, feedback from the stakeholder groups would be compared to determine areas of agreement as well as areas of divergence
