

Key Insights
The North American oil and gas lubricants market is poised for significant expansion, driven by intensified exploration and production activities. The market is projected to reach $7.29 billion by 2033, exhibiting a Compound Annual Growth Rate (CAGR) of 16% from the base year 2025. Key growth accelerators include the increasing adoption of enhanced oil recovery (EOR) techniques, the demand for eco-friendly and biodegradable lubricants in response to stringent environmental regulations, and the need for specialized lubricants to optimize performance in complex extraction processes. Major industry players are investing in R&D to develop advanced lubricant formulations addressing evolving industry demands. The market is segmented by lubricant type, application (onshore, offshore), and end-user (upstream, midstream, downstream). High competitive intensity is characterized by product innovation, strategic alliances, and technological advancements.
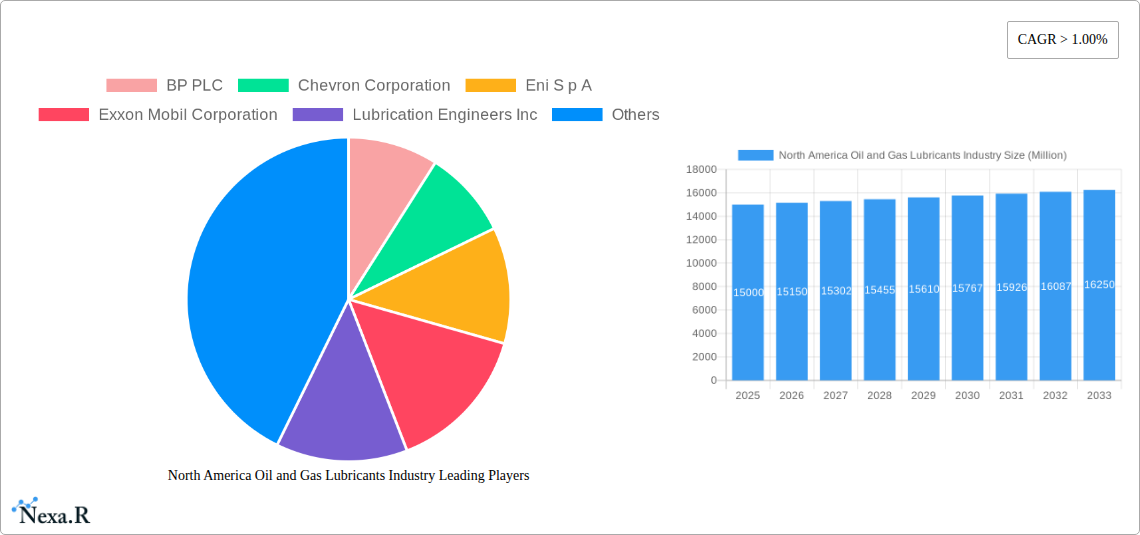
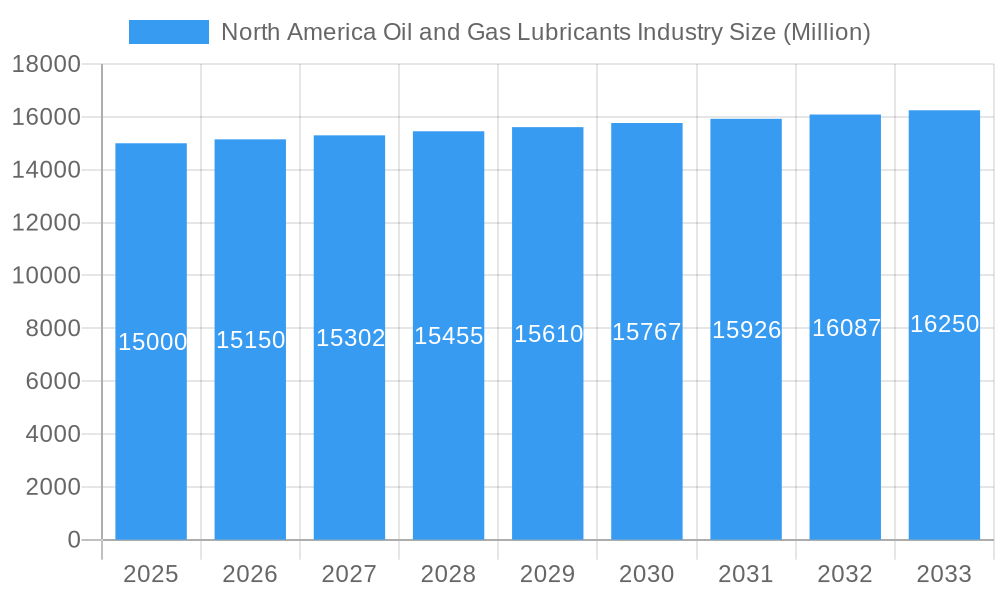
North America Oil and Gas Lubricants Industry Market Size (In Billion)
The forecast period, 2025-2033, offers substantial growth opportunities, especially within the shale gas and unconventional oil extraction sectors. Investment in pipeline infrastructure and refining capacity will further fuel lubricant demand. Potential challenges include oil price volatility and the cyclical nature of the oil and gas industry. Sustainable lubricant management and disposal practices will be critical for long-term success. Future market development will depend on technological innovation, regulatory adherence, and the overall energy sector's vitality. Companies are focusing on high-performance lubricants with extended drain intervals and enhanced efficiency to improve cost-effectiveness and environmental sustainability. Geographic expansion and strategic acquisitions will also shape the competitive landscape.
North America Oil and Gas Lubricants Industry Company Market Share
North America Oil and Gas Lubricants Industry Market Report: 2019-2033
This comprehensive report provides an in-depth analysis of the North American oil and gas lubricants market, covering market dynamics, growth trends, regional analysis, product landscape, key players, and future outlook. The study period spans from 2019 to 2033, with 2025 serving as the base and estimated year. The report is invaluable for industry professionals, investors, and strategic decision-makers seeking a clear understanding of this dynamic sector.
North America Oil and Gas Lubricants Industry Market Dynamics & Structure
This section delves into the intricate structure of the North American oil and gas lubricants market. We analyze market concentration, revealing the dominance of major players like ExxonMobil and Shell, alongside the competitive landscape shaped by regional players and specialized lubricant providers. The report examines technological innovation drivers, focusing on the shift towards environmentally friendly lubricants and the increasing adoption of advanced lubricant analysis technologies. Further, we explore the regulatory frameworks governing lubricant production and usage, considering the impact of emission standards and safety regulations. The analysis also covers competitive product substitutes, such as bio-based lubricants, and the changing end-user demographics, particularly the growing demand from the industrial and transportation sectors. Finally, the report explores M&A trends, including recent significant transactions and their influence on market consolidation.
- Market Concentration: xx% market share held by top 5 players (2024).
- Technological Innovation: Focus on bio-based lubricants and advanced additive technologies.
- Regulatory Landscape: Stringent emission norms impacting lubricant formulation.
- M&A Activity: xx deals in the last 5 years, with an average deal value of $xx million.
- Competitive Substitutes: Growing adoption of bio-based and synthetic lubricants.
North America Oil and Gas Lubricants Industry Growth Trends & Insights
This section leverages extensive data analysis to provide a comprehensive overview of the market's growth trajectory. We examine the historical market size evolution (2019-2024) and project future growth (2025-2033) using robust forecasting methodologies. Key factors influencing adoption rates are detailed, including technological advancements, changing industry standards, and evolving consumer preferences for higher-performance and environmentally friendly lubricants. The analysis also pinpoints disruptive technologies, such as nanolubricants and smart lubricants, and their potential impact on market dynamics. The report explores shifts in consumer behavior, considering the increasing focus on sustainability and the growing demand for specialized lubricant solutions for specific oil and gas applications. Specific metrics like CAGR and market penetration rates for key segments are included.
- Historical Market Size (2019-2024): Growth from $xx million to $xx million.
- Projected Market Size (2025-2033): Projected CAGR of xx%.
- Market Penetration: xx% penetration in key segments by 2033.
- Technological Disruptions: Impact of nanolubricants and smart lubricants.
Dominant Regions, Countries, or Segments in North America Oil and Gas Lubricants Industry
This section identifies the leading regions, countries, and segments driving market growth in North America. We analyze the dominance factors of these key areas, using market share data and growth potential forecasts. Key drivers such as economic policies that incentivize energy production and robust infrastructure supporting oil and gas operations are highlighted through detailed bullet points.
- Leading Region: Texas (due to high concentration of oil and gas activities).
- Key Country Drivers: United States (largest market), Canada (significant oil sands production).
- Dominant Segment: Industrial lubricants (due to high demand from manufacturing and power generation).
- Growth Drivers: Strong economic growth in certain regions, expansion of oil and gas infrastructure.
North America Oil and Gas Lubricants Industry Product Landscape
The North American oil and gas lubricants market showcases a diverse product portfolio catering to varied applications. Innovations focus on enhancing lubricant performance, extending equipment lifespan, and minimizing environmental impact. These advancements include the development of high-performance synthetic lubricants, bio-based alternatives, and specialized formulations designed to optimize specific equipment operations. Furthermore, the industry continuously enhances product testing and quality control measures, ensuring reliability and longevity. Unique selling propositions center around superior performance, extended service intervals, and improved fuel efficiency.
Key Drivers, Barriers & Challenges in North America Oil and Gas Lubricants Industry
Key Drivers: Growing oil and gas production, increasing demand for industrial lubricants, technological advancements in lubricant formulations, and government regulations promoting energy efficiency.
Key Challenges: Fluctuations in crude oil prices, environmental regulations, stringent quality standards, and the increasing competition from both domestic and international players. Supply chain disruptions have resulted in xx% increase in lubricant costs in the past year.
Emerging Opportunities in North America Oil and Gas Lubricants Industry
Emerging opportunities lie in the increasing adoption of sustainable lubricants, growth in specialized lubricant applications for advanced oil and gas extraction technologies, and expansion into new markets through strategic partnerships. The focus on environmentally friendly lubricants presents significant growth potential, especially with the rising demand for reduced carbon emissions.
Growth Accelerators in the North America Oil and Gas Lubricants Industry Industry
Long-term growth in this market will be propelled by continued investments in research and development of advanced lubricant technologies, strategic alliances and partnerships among lubricant producers and oil and gas companies, and expansion into new geographic markets and emerging applications within the energy sector. Technological breakthroughs leading to improved performance and efficiency will be key drivers.
Key Players Shaping the North America Oil and Gas Lubricants Industry Market
- BP PLC
- Chevron Corporation
- Eni S p A
- Exxon Mobil Corporation
- Lubrication Engineers Inc
- LUKOIL
- Petro-Canada Lubricants Inc
- Shell PLC
- Schlumberger Limited
- SKF
- TotalEnergies SE
- Valvoline Inc
- List Not Exhaustive
Notable Milestones in North America Oil and Gas Lubricants Industry Sector
- December 2022: Shell acquired Allied Reliability, expanding its North American lubricants business.
- August 2022: Valvoline Inc. sold its global products business (including lubricants) to Saudi Aramco for USD 2.65 billion.
In-Depth North America Oil and Gas Lubricants Industry Market Outlook
The North American oil and gas lubricants market is poised for robust growth in the coming years, driven by technological advancements, strategic partnerships, and the expanding oil and gas sector. The focus on sustainability and the development of environmentally friendly lubricants will create significant opportunities for market players. Strategic investments in research and development will be crucial for companies to remain competitive and capture market share in this dynamic and evolving landscape.
North America Oil and Gas Lubricants Industry Segmentation
-
1. Location
- 1.1. Onshore
- 1.2. Offshore
-
2. Product Type
- 2.1. Grease
- 2.2. Coolant/Anti-freezer
- 2.3. Engine Oils
- 2.4. Hydraulic Fluids
- 2.5. Other Product Types
-
3. Sector
- 3.1. Upstream
- 3.2. Midstream
- 3.3. Downstream
-
4. Geography
- 4.1. United States
- 4.2. Canada
- 4.3. Mexico
North America Oil and Gas Lubricants Industry Segmentation By Geography
- 1. United States
- 2. Canada
- 3. Mexico
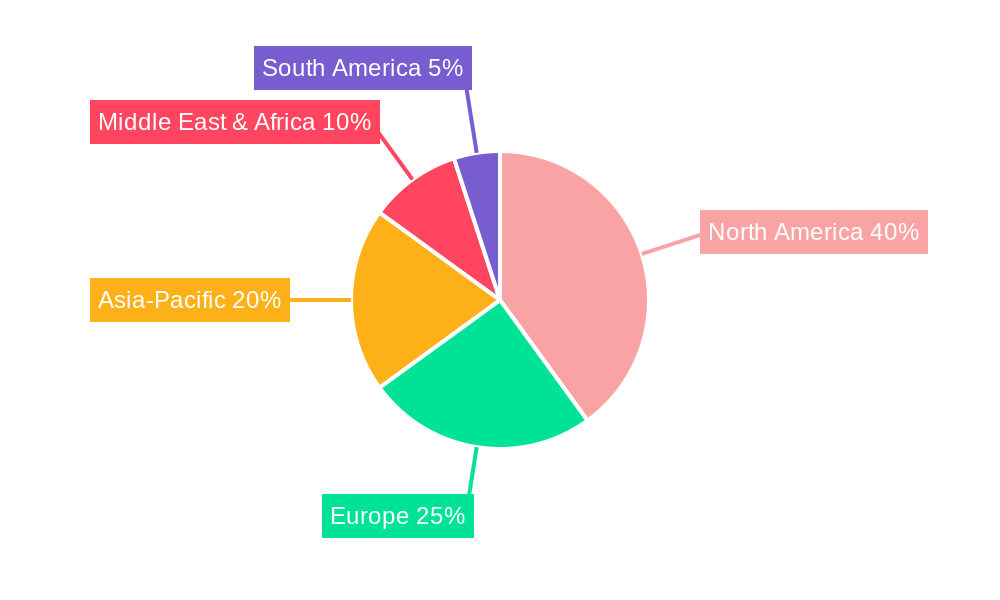
North America Oil and Gas Lubricants Industry Regional Market Share
Geographic Coverage of North America Oil and Gas Lubricants Industry
North America Oil and Gas Lubricants Industry REPORT HIGHLIGHTS
| Aspects | Details |
|---|---|
| Study Period | 2020-2034 |
| Base Year | 2025 |
| Estimated Year | 2026 |
| Forecast Period | 2026-2034 |
| Historical Period | 2020-2025 |
| Growth Rate | CAGR of 3.7% from 2020-2034 |
| Segmentation |
|
Table of Contents
- 1. Introduction
- 1.1. Research Scope
- 1.2. Market Segmentation
- 1.3. Research Objective
- 1.4. Definitions and Assumptions
- 2. Executive Summary
- 2.1. Market Snapshot
- 3. Market Dynamics
- 3.1. Market Drivers
- 3.2. Market Restrains
- 3.3. Market Trends
- 3.4. Market Opportunities
- 4. Market Factor Analysis
- 4.1. Porters Five Forces
- 4.1.1. Bargaining Power of Suppliers
- 4.1.2. Bargaining Power of Buyers
- 4.1.3. Threat of New Entrants
- 4.1.4. Threat of Substitutes
- 4.1.5. Competitive Rivalry
- 4.2. PESTEL analysis
- 4.3. BCG Analysis
- 4.3.1. Stars (High Growth, High Market Share)
- 4.3.2. Cash Cows (Low Growth, High Market Share)
- 4.3.3. Question Mark (High Growth, Low Market Share)
- 4.3.4. Dogs (Low Growth, Low Market Share)
- 4.4. Ansoff Matrix Analysis
- 4.5. Supply Chain Analysis
- 4.6. Regulatory Landscape
- 4.7. Current Market Potential and Opportunity Assessment (TAM–SAM–SOM Framework)
- 4.8. NRP Analyst Note
- 4.1. Porters Five Forces
- 5. Market Analysis, Insights and Forecast 2021-2033
- 5.1. Market Analysis, Insights and Forecast - by Location
- 5.1.1. Onshore
- 5.1.2. Offshore
- 5.2. Market Analysis, Insights and Forecast - by Product Type
- 5.2.1. Grease
- 5.2.2. Coolant/Anti-freezer
- 5.2.3. Engine Oils
- 5.2.4. Hydraulic Fluids
- 5.2.5. Other Product Types
- 5.3. Market Analysis, Insights and Forecast - by Sector
- 5.3.1. Upstream
- 5.3.2. Midstream
- 5.3.3. Downstream
- 5.4. Market Analysis, Insights and Forecast - by Geography
- 5.4.1. United States
- 5.4.2. Canada
- 5.4.3. Mexico
- 5.5. Market Analysis, Insights and Forecast - by Region
- 5.5.1. United States
- 5.5.2. Canada
- 5.5.3. Mexico
- 5.1. Market Analysis, Insights and Forecast - by Location
- 6. Global North America Oil and Gas Lubricants Industry Analysis, Insights and Forecast, 2021-2033
- 6.1. Market Analysis, Insights and Forecast - by Location
- 6.1.1. Onshore
- 6.1.2. Offshore
- 6.2. Market Analysis, Insights and Forecast - by Product Type
- 6.2.1. Grease
- 6.2.2. Coolant/Anti-freezer
- 6.2.3. Engine Oils
- 6.2.4. Hydraulic Fluids
- 6.2.5. Other Product Types
- 6.3. Market Analysis, Insights and Forecast - by Sector
- 6.3.1. Upstream
- 6.3.2. Midstream
- 6.3.3. Downstream
- 6.4. Market Analysis, Insights and Forecast - by Geography
- 6.4.1. United States
- 6.4.2. Canada
- 6.4.3. Mexico
- 6.1. Market Analysis, Insights and Forecast - by Location
- 7. United States North America Oil and Gas Lubricants Industry Analysis, Insights and Forecast, 2020-2032
- 7.1. Market Analysis, Insights and Forecast - by Location
- 7.1.1. Onshore
- 7.1.2. Offshore
- 7.2. Market Analysis, Insights and Forecast - by Product Type
- 7.2.1. Grease
- 7.2.2. Coolant/Anti-freezer
- 7.2.3. Engine Oils
- 7.2.4. Hydraulic Fluids
- 7.2.5. Other Product Types
- 7.3. Market Analysis, Insights and Forecast - by Sector
- 7.3.1. Upstream
- 7.3.2. Midstream
- 7.3.3. Downstream
- 7.4. Market Analysis, Insights and Forecast - by Geography
- 7.4.1. United States
- 7.4.2. Canada
- 7.4.3. Mexico
- 7.1. Market Analysis, Insights and Forecast - by Location
- 8. Canada North America Oil and Gas Lubricants Industry Analysis, Insights and Forecast, 2020-2032
- 8.1. Market Analysis, Insights and Forecast - by Location
- 8.1.1. Onshore
- 8.1.2. Offshore
- 8.2. Market Analysis, Insights and Forecast - by Product Type
- 8.2.1. Grease
- 8.2.2. Coolant/Anti-freezer
- 8.2.3. Engine Oils
- 8.2.4. Hydraulic Fluids
- 8.2.5. Other Product Types
- 8.3. Market Analysis, Insights and Forecast - by Sector
- 8.3.1. Upstream
- 8.3.2. Midstream
- 8.3.3. Downstream
- 8.4. Market Analysis, Insights and Forecast - by Geography
- 8.4.1. United States
- 8.4.2. Canada
- 8.4.3. Mexico
- 8.1. Market Analysis, Insights and Forecast - by Location
- 9. Mexico North America Oil and Gas Lubricants Industry Analysis, Insights and Forecast, 2020-2032
- 9.1. Market Analysis, Insights and Forecast - by Location
- 9.1.1. Onshore
- 9.1.2. Offshore
- 9.2. Market Analysis, Insights and Forecast - by Product Type
- 9.2.1. Grease
- 9.2.2. Coolant/Anti-freezer
- 9.2.3. Engine Oils
- 9.2.4. Hydraulic Fluids
- 9.2.5. Other Product Types
- 9.3. Market Analysis, Insights and Forecast - by Sector
- 9.3.1. Upstream
- 9.3.2. Midstream
- 9.3.3. Downstream
- 9.4. Market Analysis, Insights and Forecast - by Geography
- 9.4.1. United States
- 9.4.2. Canada
- 9.4.3. Mexico
- 9.1. Market Analysis, Insights and Forecast - by Location
- 10. Competitive Analysis
- 10.1. Company Profiles
- 10.1.1 BP PLC
- 10.1.1.1. Company Overview
- 10.1.1.2. Products
- 10.1.1.3. Company Financials
- 10.1.1.4. SWOT Analysis
- 10.1.2 Chevron Corporation
- 10.1.2.1. Company Overview
- 10.1.2.2. Products
- 10.1.2.3. Company Financials
- 10.1.2.4. SWOT Analysis
- 10.1.3 Eni S p A
- 10.1.3.1. Company Overview
- 10.1.3.2. Products
- 10.1.3.3. Company Financials
- 10.1.3.4. SWOT Analysis
- 10.1.4 Exxon Mobil Corporation
- 10.1.4.1. Company Overview
- 10.1.4.2. Products
- 10.1.4.3. Company Financials
- 10.1.4.4. SWOT Analysis
- 10.1.5 Lubrication Engineers Inc
- 10.1.5.1. Company Overview
- 10.1.5.2. Products
- 10.1.5.3. Company Financials
- 10.1.5.4. SWOT Analysis
- 10.1.6 LUKOIL
- 10.1.6.1. Company Overview
- 10.1.6.2. Products
- 10.1.6.3. Company Financials
- 10.1.6.4. SWOT Analysis
- 10.1.7 Petro-Canada Lubricants Inc
- 10.1.7.1. Company Overview
- 10.1.7.2. Products
- 10.1.7.3. Company Financials
- 10.1.7.4. SWOT Analysis
- 10.1.8 Shell PLC
- 10.1.8.1. Company Overview
- 10.1.8.2. Products
- 10.1.8.3. Company Financials
- 10.1.8.4. SWOT Analysis
- 10.1.9 Schlumberger Limited
- 10.1.9.1. Company Overview
- 10.1.9.2. Products
- 10.1.9.3. Company Financials
- 10.1.9.4. SWOT Analysis
- 10.1.10 SKF
- 10.1.10.1. Company Overview
- 10.1.10.2. Products
- 10.1.10.3. Company Financials
- 10.1.10.4. SWOT Analysis
- 10.1.11 TotalEnergies SE
- 10.1.11.1. Company Overview
- 10.1.11.2. Products
- 10.1.11.3. Company Financials
- 10.1.11.4. SWOT Analysis
- 10.1.12 Valvoline Inc *List Not Exhaustive
- 10.1.12.1. Company Overview
- 10.1.12.2. Products
- 10.1.12.3. Company Financials
- 10.1.12.4. SWOT Analysis
- 10.1.1 BP PLC
- 10.2. Market Entropy
- 10.2.1 Company's Key Areas Served
- 10.2.2 Recent Developments
- 10.3. Company Market Share Analysis 2025
- 10.3.1 Top 5 Companies Market Share Analysis
- 10.3.2 Top 3 Companies Market Share Analysis
- 10.4. List of Potential Customers
- 11. Research Methodology
List of Figures
- Figure 1: Global North America Oil and Gas Lubricants Industry Revenue Breakdown (million, %) by Region 2025 & 2033
- Figure 2: United States North America Oil and Gas Lubricants Industry Revenue (million), by Location 2025 & 2033
- Figure 3: United States North America Oil and Gas Lubricants Industry Revenue Share (%), by Location 2025 & 2033
- Figure 4: United States North America Oil and Gas Lubricants Industry Revenue (million), by Product Type 2025 & 2033
- Figure 5: United States North America Oil and Gas Lubricants Industry Revenue Share (%), by Product Type 2025 & 2033
- Figure 6: United States North America Oil and Gas Lubricants Industry Revenue (million), by Sector 2025 & 2033
- Figure 7: United States North America Oil and Gas Lubricants Industry Revenue Share (%), by Sector 2025 & 2033
- Figure 8: United States North America Oil and Gas Lubricants Industry Revenue (million), by Geography 2025 & 2033
- Figure 9: United States North America Oil and Gas Lubricants Industry Revenue Share (%), by Geography 2025 & 2033
- Figure 10: United States North America Oil and Gas Lubricants Industry Revenue (million), by Country 2025 & 2033
- Figure 11: United States North America Oil and Gas Lubricants Industry Revenue Share (%), by Country 2025 & 2033
- Figure 12: Canada North America Oil and Gas Lubricants Industry Revenue (million), by Location 2025 & 2033
- Figure 13: Canada North America Oil and Gas Lubricants Industry Revenue Share (%), by Location 2025 & 2033
- Figure 14: Canada North America Oil and Gas Lubricants Industry Revenue (million), by Product Type 2025 & 2033
- Figure 15: Canada North America Oil and Gas Lubricants Industry Revenue Share (%), by Product Type 2025 & 2033
- Figure 16: Canada North America Oil and Gas Lubricants Industry Revenue (million), by Sector 2025 & 2033
- Figure 17: Canada North America Oil and Gas Lubricants Industry Revenue Share (%), by Sector 2025 & 2033
- Figure 18: Canada North America Oil and Gas Lubricants Industry Revenue (million), by Geography 2025 & 2033
- Figure 19: Canada North America Oil and Gas Lubricants Industry Revenue Share (%), by Geography 2025 & 2033
- Figure 20: Canada North America Oil and Gas Lubricants Industry Revenue (million), by Country 2025 & 2033
- Figure 21: Canada North America Oil and Gas Lubricants Industry Revenue Share (%), by Country 2025 & 2033
- Figure 22: Mexico North America Oil and Gas Lubricants Industry Revenue (million), by Location 2025 & 2033
- Figure 23: Mexico North America Oil and Gas Lubricants Industry Revenue Share (%), by Location 2025 & 2033
- Figure 24: Mexico North America Oil and Gas Lubricants Industry Revenue (million), by Product Type 2025 & 2033
- Figure 25: Mexico North America Oil and Gas Lubricants Industry Revenue Share (%), by Product Type 2025 & 2033
- Figure 26: Mexico North America Oil and Gas Lubricants Industry Revenue (million), by Sector 2025 & 2033
- Figure 27: Mexico North America Oil and Gas Lubricants Industry Revenue Share (%), by Sector 2025 & 2033
- Figure 28: Mexico North America Oil and Gas Lubricants Industry Revenue (million), by Geography 2025 & 2033
- Figure 29: Mexico North America Oil and Gas Lubricants Industry Revenue Share (%), by Geography 2025 & 2033
- Figure 30: Mexico North America Oil and Gas Lubricants Industry Revenue (million), by Country 2025 & 2033
- Figure 31: Mexico North America Oil and Gas Lubricants Industry Revenue Share (%), by Country 2025 & 2033
List of Tables
- Table 1: Global North America Oil and Gas Lubricants Industry Revenue million Forecast, by Location 2020 & 2033
- Table 2: Global North America Oil and Gas Lubricants Industry Revenue million Forecast, by Product Type 2020 & 2033
- Table 3: Global North America Oil and Gas Lubricants Industry Revenue million Forecast, by Sector 2020 & 2033
- Table 4: Global North America Oil and Gas Lubricants Industry Revenue million Forecast, by Geography 2020 & 2033
- Table 5: Global North America Oil and Gas Lubricants Industry Revenue million Forecast, by Region 2020 & 2033
- Table 6: Global North America Oil and Gas Lubricants Industry Revenue million Forecast, by Location 2020 & 2033
- Table 7: Global North America Oil and Gas Lubricants Industry Revenue million Forecast, by Product Type 2020 & 2033
- Table 8: Global North America Oil and Gas Lubricants Industry Revenue million Forecast, by Sector 2020 & 2033
- Table 9: Global North America Oil and Gas Lubricants Industry Revenue million Forecast, by Geography 2020 & 2033
- Table 10: Global North America Oil and Gas Lubricants Industry Revenue million Forecast, by Country 2020 & 2033
- Table 11: Global North America Oil and Gas Lubricants Industry Revenue million Forecast, by Location 2020 & 2033
- Table 12: Global North America Oil and Gas Lubricants Industry Revenue million Forecast, by Product Type 2020 & 2033
- Table 13: Global North America Oil and Gas Lubricants Industry Revenue million Forecast, by Sector 2020 & 2033
- Table 14: Global North America Oil and Gas Lubricants Industry Revenue million Forecast, by Geography 2020 & 2033
- Table 15: Global North America Oil and Gas Lubricants Industry Revenue million Forecast, by Country 2020 & 2033
- Table 16: Global North America Oil and Gas Lubricants Industry Revenue million Forecast, by Location 2020 & 2033
- Table 17: Global North America Oil and Gas Lubricants Industry Revenue million Forecast, by Product Type 2020 & 2033
- Table 18: Global North America Oil and Gas Lubricants Industry Revenue million Forecast, by Sector 2020 & 2033
- Table 19: Global North America Oil and Gas Lubricants Industry Revenue million Forecast, by Geography 2020 & 2033
- Table 20: Global North America Oil and Gas Lubricants Industry Revenue million Forecast, by Country 2020 & 2033
Frequently Asked Questions
1. What is the projected Compound Annual Growth Rate (CAGR) of the North America Oil and Gas Lubricants Industry?
The projected CAGR is approximately 3.7%.
2. Which companies are prominent players in the North America Oil and Gas Lubricants Industry?
Key companies in the market include BP PLC, Chevron Corporation, Eni S p A, Exxon Mobil Corporation, Lubrication Engineers Inc, LUKOIL, Petro-Canada Lubricants Inc, Shell PLC, Schlumberger Limited, SKF, TotalEnergies SE, Valvoline Inc *List Not Exhaustive.
3. What are the main segments of the North America Oil and Gas Lubricants Industry?
The market segments include Location, Product Type, Sector, Geography.
4. Can you provide details about the market size?
The market size is estimated to be USD 186.1 million as of 2022.
5. What are some drivers contributing to market growth?
Growing Interest towards Unconventional Reserves; Technological Advancement Leading to Higher Well Production Rates.
6. What are the notable trends driving market growth?
Offshore Exploration is Expected to Experience the Highest Growth.
7. Are there any restraints impacting market growth?
Growing Interest towards Unconventional Reserves; Technological Advancement Leading to Higher Well Production Rates.
8. Can you provide examples of recent developments in the market?
In December 2022, Shell acquired Allied Reliability, expanding its North American lubricants business. This is in line with its global lubricants strategy of expanding its premium product offering and presence in the industrial sector and providing complementary services to provide a strong value proposition to its customers.
9. What pricing options are available for accessing the report?
Pricing options include single-user, multi-user, and enterprise licenses priced at USD 4750, USD 5250, and USD 8750 respectively.
10. Is the market size provided in terms of value or volume?
The market size is provided in terms of value, measured in million.
11. Are there any specific market keywords associated with the report?
Yes, the market keyword associated with the report is "North America Oil and Gas Lubricants Industry," which aids in identifying and referencing the specific market segment covered.
12. How do I determine which pricing option suits my needs best?
The pricing options vary based on user requirements and access needs. Individual users may opt for single-user licenses, while businesses requiring broader access may choose multi-user or enterprise licenses for cost-effective access to the report.
13. Are there any additional resources or data provided in the North America Oil and Gas Lubricants Industry report?
While the report offers comprehensive insights, it's advisable to review the specific contents or supplementary materials provided to ascertain if additional resources or data are available.
14. How can I stay updated on further developments or reports in the North America Oil and Gas Lubricants Industry?
To stay informed about further developments, trends, and reports in the North America Oil and Gas Lubricants Industry, consider subscribing to industry newsletters, following relevant companies and organizations, or regularly checking reputable industry news sources and publications.
Methodology
Step 1 - Identification of Relevant Samples Size from Population Database


Step 2 - Approaches for Defining Global Market Size (Value, Volume* & Price*)

Note*: In applicable scenarios
Step 3 - Data Sources
Primary Research
- Web Analytics
- Survey Reports
- Research Institute
- Latest Research Reports
- Opinion Leaders
Secondary Research
- Annual Reports
- White Paper
- Latest Press Release
- Industry Association
- Paid Database
- Investor Presentations

Step 4 - Data Triangulation
Involves using different sources of information in order to increase the validity of a study
These sources are likely to be stakeholders in a program - participants, other researchers, program staff, other community members, and so on.
Then we put all data in single framework & apply various statistical tools to find out the dynamic on the market.
During the analysis stage, feedback from the stakeholder groups would be compared to determine areas of agreement as well as areas of divergence