

Key Insights
The screen printing mesh market for solar cells is experiencing robust growth, driven by the escalating demand for renewable energy sources and continuous advancements in solar cell technology. The market's expansion is fueled by the increasing efficiency of solar cells, leading to higher energy output and reduced production costs. Government incentives and subsidies aimed at promoting solar energy adoption further bolster market growth. Technological advancements in mesh materials, including the development of finer meshes with improved precision and durability, are also key drivers. While the precise market size fluctuates depending on factors such as raw material costs and global economic conditions, a reasonable estimate for 2025 would be around $800 million, projecting a compound annual growth rate (CAGR) of approximately 7% to $1.2 billion by 2033. This growth, however, is not without its challenges. Fluctuations in raw material prices, particularly for metals used in mesh production, pose a significant restraint. Furthermore, competition from alternative printing technologies and the potential for supply chain disruptions represent ongoing hurdles for market players. Segmentation within the market involves various mesh materials (e.g., stainless steel, polyester), weave patterns, and mesh counts, each catering to specific solar cell production requirements. Key players like Asada Mesh, NBC, Bopp, Haver & Boecker, and Sefar AG are actively engaged in innovation and expansion to capitalize on the market's potential.
The competitive landscape is characterized by both established industry giants and emerging players striving for market share. Companies are focusing on strategic partnerships and collaborations to enhance their technological capabilities and expand their geographical reach. The regional distribution of the market likely reflects global solar energy adoption rates, with North America, Europe, and Asia-Pacific being prominent regions. Future growth will depend on continued technological advancements, supportive government policies, and a sustained global push towards renewable energy adoption. Further market penetration in developing economies presents a significant opportunity for growth. Companies should concentrate on delivering high-quality, durable products at competitive prices while emphasizing sustainability initiatives to maintain their competitive edge.

Screen Printing Mesh for Solar Cells Market Report: 2019-2033
This comprehensive report provides an in-depth analysis of the screen printing mesh for solar cells market, encompassing market dynamics, growth trends, regional dominance, product landscape, challenges, opportunities, and key players. The study period covers 2019-2033, with a base year of 2025 and a forecast period of 2025-2033. The report leverages extensive primary and secondary research to deliver actionable insights for industry professionals, investors, and strategic decision-makers within the renewable energy and materials science sectors. Market size is expressed in millions of units.
Screen Printing Mesh for Solar Cells Market Dynamics & Structure
This section analyzes the competitive landscape, technological advancements, and regulatory influences shaping the screen printing mesh market for solar cells. The market is characterized by a moderately concentrated structure, with key players such as ASADA MESH, NBC, BOPP, Haver & Boecker, Nippon Tokushu Fabric, MAISHI MFG, Sefar AG, MITANI MICRO, Hebei Anping Printing Screen, and Fratelli Mariani vying for market share. The global market size in 2025 is estimated at xx million units.
- Market Concentration: The top 5 players hold approximately xx% of the market share in 2025, indicating a moderate level of consolidation.
- Technological Innovation: Ongoing R&D focuses on enhancing mesh durability, increasing throughput, and improving printing precision. Innovation barriers include high R&D costs and the need for specialized manufacturing processes.
- Regulatory Framework: Government incentives and renewable energy mandates are significant drivers, while environmental regulations impact material sourcing and production processes.
- Competitive Substitutes: Other printing techniques, such as inkjet printing and laser scribing, pose some competition, but screen printing remains dominant due to its cost-effectiveness and established infrastructure.
- End-User Demographics: The primary end-users are solar cell manufacturers, with growing demand from emerging markets driving market expansion.
- M&A Trends: The past five years have witnessed xx M&A deals in the screen printing mesh sector, primarily driven by strategic expansion and technology acquisition. This trend is projected to continue, with an estimated xx deals predicted for the forecast period.
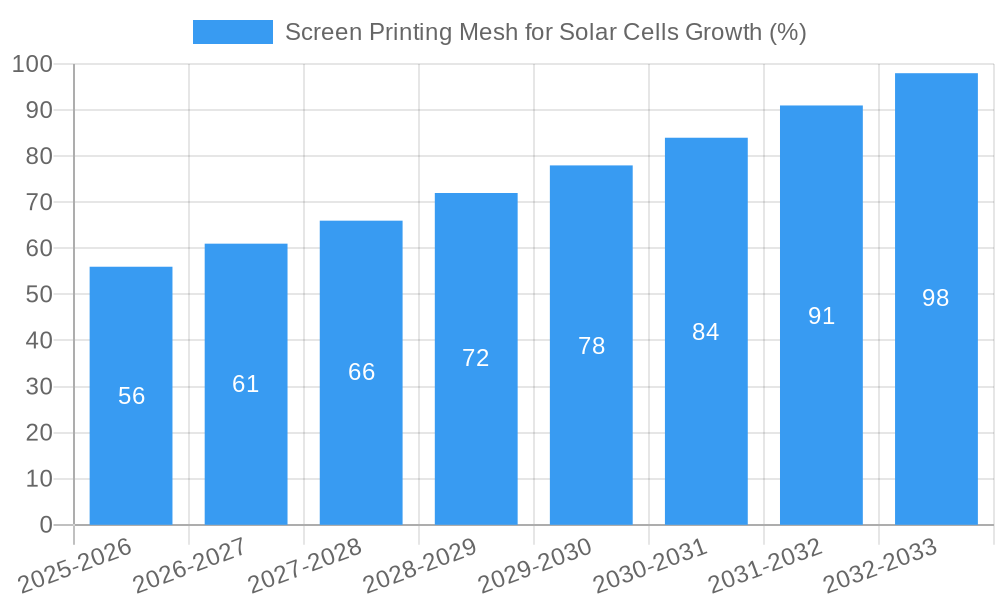
Screen Printing Mesh for Solar Cells Growth Trends & Insights
The screen printing mesh for solar cells market has experienced robust growth over the historical period (2019-2024), driven by the global surge in solar energy adoption. The market size expanded from xx million units in 2019 to xx million units in 2024, exhibiting a CAGR of xx%. This growth trajectory is expected to continue throughout the forecast period (2025-2033), with a projected CAGR of xx%, reaching xx million units by 2033. Technological disruptions, such as the introduction of advanced mesh materials and automation in production processes, are key growth catalysts. Furthermore, evolving consumer preferences towards sustainable energy solutions are further bolstering market expansion. Market penetration is currently estimated at xx% globally and is projected to reach xx% by 2033.
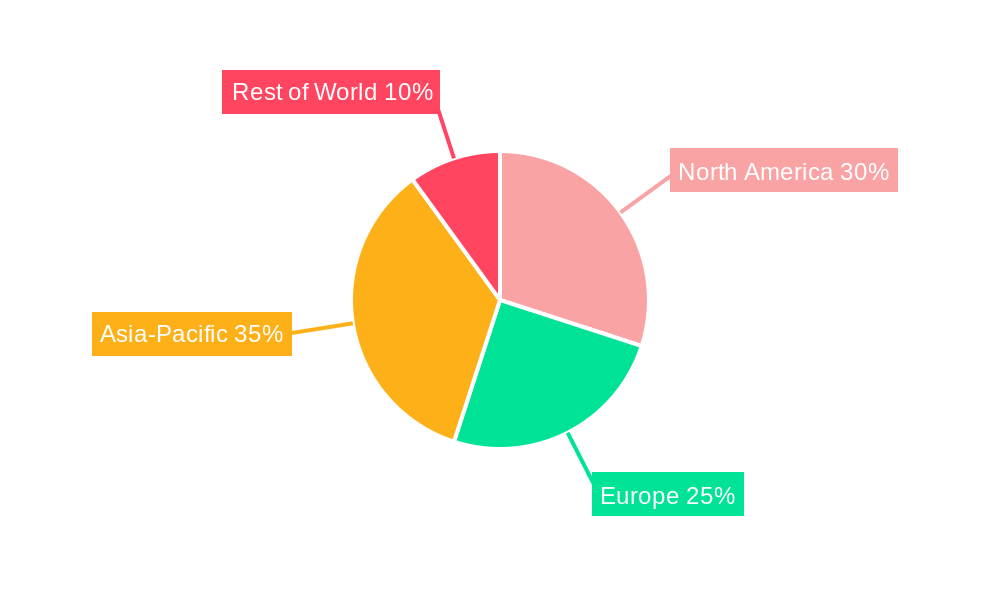
Dominant Regions, Countries, or Segments in Screen Printing Mesh for Solar Cells
The Asia-Pacific region, particularly China, dominates the screen printing mesh for solar cells market, accounting for approximately xx% of the global market share in 2025. This dominance is attributed to:
- Robust Solar Energy Industry: China's substantial investments in renewable energy infrastructure have fueled significant demand for screen printing mesh.
- Cost-Competitive Manufacturing: The region boasts a large manufacturing base, offering cost-effective production of screen printing mesh.
- Government Support: Favorable government policies and subsidies for solar energy projects further stimulate market growth.
Other significant regions include North America and Europe, exhibiting strong growth potential due to increasing solar energy adoption and supportive regulatory frameworks. The growth in these regions is driven by:
- Stringent Emission Regulations: Stringent emission regulations are pushing energy transition towards renewable sources.
- Growing Awareness of Sustainability: Consumers are increasingly aware of sustainability issues leading them to choose clean and green energy options.
Screen Printing Mesh for Solar Cells Product Landscape
The product landscape features a range of mesh materials, including stainless steel, nickel, and other specialized alloys, each offering unique properties in terms of durability, precision, and compatibility with different solar cell technologies. Recent innovations focus on enhancing mesh longevity, improving printing accuracy, and optimizing mesh designs for specific solar cell architectures. Key selling propositions include high throughput, reduced defects, and compatibility with diverse printing processes.
Key Drivers, Barriers & Challenges in Screen Printing Mesh for Solar Cells
Key Drivers:
- Growth of Solar Energy Market: The global expansion of the solar energy industry is the primary driver.
- Technological Advancements: Innovations in mesh materials and printing technologies are boosting efficiency and productivity.
- Government Incentives: Government policies promoting renewable energy significantly impact market growth.
Key Challenges:
- Supply Chain Disruptions: Geopolitical factors and material shortages can lead to supply chain instability.
- Price Fluctuations of Raw Materials: Fluctuations in raw material prices (e.g., stainless steel) can affect production costs.
- Intense Competition: The presence of numerous players leads to intense competition, putting pressure on pricing.
Emerging Opportunities in Screen Printing Mesh for Solar Cells
Emerging opportunities include:
- High-Efficiency Solar Cells: Development of screen printing mesh for high-efficiency perovskite and tandem solar cells.
- Large-Scale Solar Projects: Meeting the growing demand from large-scale utility-scale solar power plants.
- Innovative Mesh Materials: Exploring new materials with enhanced properties for improved printing quality and durability.
Growth Accelerators in the Screen Printing Mesh for Solar Cells Industry
Long-term growth will be fueled by technological breakthroughs leading to higher efficiency and lower costs, strategic partnerships between mesh manufacturers and solar cell producers, and market expansion into emerging economies with high solar irradiation.
Key Players Shaping the Screen Printing Mesh for Solar Cells Market
- ASADA MESH
- NBC
- BOPP
- Haver & Boecker
- Nippon Tokushu Fabric
- MAISHI MFG
- Sefar AG
- MITANI MICRO
- Hebei Anping Printing Screen
- Fratelli Mariani
Notable Milestones in Screen Printing Mesh for Solar Cells Sector
- 2020: Introduction of a new high-precision stainless steel mesh by Sefar AG.
- 2021: Partnership between Haver & Boecker and a major solar cell manufacturer for joint R&D.
- 2022: Acquisition of a smaller mesh producer by ASADA MESH.
- 2023: Launch of a new nickel-based mesh with enhanced durability by MITANI MICRO.
- 2024: Significant investment in automated production lines by several key players.
In-Depth Screen Printing Mesh for Solar Cells Market Outlook
The screen printing mesh for solar cells market is poised for continued strong growth, driven by the expanding solar energy sector, technological innovations, and supportive government policies. Strategic opportunities lie in developing advanced mesh materials, expanding into new markets, and forming strategic partnerships to capitalize on the long-term growth potential of this vital component in the renewable energy value chain.
Screen Printing Mesh for Solar Cells Segmentation
-
1. Application
- 1.1. PERC Components
- 1.2. TOPCON Components
- 1.3. HJT Components
-
2. Types
- 2.1. Stainless Steel
- 2.2. Polyester
Screen Printing Mesh for Solar Cells Segmentation By Geography
-
1. North America
- 1.1. United States
- 1.2. Canada
- 1.3. Mexico
-
2. South America
- 2.1. Brazil
- 2.2. Argentina
- 2.3. Rest of South America
-
3. Europe
- 3.1. United Kingdom
- 3.2. Germany
- 3.3. France
- 3.4. Italy
- 3.5. Spain
- 3.6. Russia
- 3.7. Benelux
- 3.8. Nordics
- 3.9. Rest of Europe
-
4. Middle East & Africa
- 4.1. Turkey
- 4.2. Israel
- 4.3. GCC
- 4.4. North Africa
- 4.5. South Africa
- 4.6. Rest of Middle East & Africa
-
5. Asia Pacific
- 5.1. China
- 5.2. India
- 5.3. Japan
- 5.4. South Korea
- 5.5. ASEAN
- 5.6. Oceania
- 5.7. Rest of Asia Pacific
Screen Printing Mesh for Solar Cells REPORT HIGHLIGHTS
| Aspects | Details |
|---|---|
| Study Period | 2019-2033 |
| Base Year | 2024 |
| Estimated Year | 2025 |
| Forecast Period | 2025-2033 |
| Historical Period | 2019-2024 |
| Growth Rate | CAGR of XX% from 2019-2033 |
| Segmentation |
|
Table of Contents
- 1. Introduction
- 1.1. Research Scope
- 1.2. Market Segmentation
- 1.3. Research Methodology
- 1.4. Definitions and Assumptions
- 2. Executive Summary
- 2.1. Introduction
- 3. Market Dynamics
- 3.1. Introduction
- 3.2. Market Drivers
- 3.3. Market Restrains
- 3.4. Market Trends
- 4. Market Factor Analysis
- 4.1. Porters Five Forces
- 4.2. Supply/Value Chain
- 4.3. PESTEL analysis
- 4.4. Market Entropy
- 4.5. Patent/Trademark Analysis
- 5. Global Screen Printing Mesh for Solar Cells Analysis, Insights and Forecast, 2019-2031
- 5.1. Market Analysis, Insights and Forecast - by Application
- 5.1.1. PERC Components
- 5.1.2. TOPCON Components
- 5.1.3. HJT Components
- 5.2. Market Analysis, Insights and Forecast - by Types
- 5.2.1. Stainless Steel
- 5.2.2. Polyester
- 5.3. Market Analysis, Insights and Forecast - by Region
- 5.3.1. North America
- 5.3.2. South America
- 5.3.3. Europe
- 5.3.4. Middle East & Africa
- 5.3.5. Asia Pacific
- 5.1. Market Analysis, Insights and Forecast - by Application
- 6. North America Screen Printing Mesh for Solar Cells Analysis, Insights and Forecast, 2019-2031
- 6.1. Market Analysis, Insights and Forecast - by Application
- 6.1.1. PERC Components
- 6.1.2. TOPCON Components
- 6.1.3. HJT Components
- 6.2. Market Analysis, Insights and Forecast - by Types
- 6.2.1. Stainless Steel
- 6.2.2. Polyester
- 6.1. Market Analysis, Insights and Forecast - by Application
- 7. South America Screen Printing Mesh for Solar Cells Analysis, Insights and Forecast, 2019-2031
- 7.1. Market Analysis, Insights and Forecast - by Application
- 7.1.1. PERC Components
- 7.1.2. TOPCON Components
- 7.1.3. HJT Components
- 7.2. Market Analysis, Insights and Forecast - by Types
- 7.2.1. Stainless Steel
- 7.2.2. Polyester
- 7.1. Market Analysis, Insights and Forecast - by Application
- 8. Europe Screen Printing Mesh for Solar Cells Analysis, Insights and Forecast, 2019-2031
- 8.1. Market Analysis, Insights and Forecast - by Application
- 8.1.1. PERC Components
- 8.1.2. TOPCON Components
- 8.1.3. HJT Components
- 8.2. Market Analysis, Insights and Forecast - by Types
- 8.2.1. Stainless Steel
- 8.2.2. Polyester
- 8.1. Market Analysis, Insights and Forecast - by Application
- 9. Middle East & Africa Screen Printing Mesh for Solar Cells Analysis, Insights and Forecast, 2019-2031
- 9.1. Market Analysis, Insights and Forecast - by Application
- 9.1.1. PERC Components
- 9.1.2. TOPCON Components
- 9.1.3. HJT Components
- 9.2. Market Analysis, Insights and Forecast - by Types
- 9.2.1. Stainless Steel
- 9.2.2. Polyester
- 9.1. Market Analysis, Insights and Forecast - by Application
- 10. Asia Pacific Screen Printing Mesh for Solar Cells Analysis, Insights and Forecast, 2019-2031
- 10.1. Market Analysis, Insights and Forecast - by Application
- 10.1.1. PERC Components
- 10.1.2. TOPCON Components
- 10.1.3. HJT Components
- 10.2. Market Analysis, Insights and Forecast - by Types
- 10.2.1. Stainless Steel
- 10.2.2. Polyester
- 10.1. Market Analysis, Insights and Forecast - by Application
- 11. Competitive Analysis
- 11.1. Global Market Share Analysis 2024
- 11.2. Company Profiles
- 11.2.1 ASADA MESH
- 11.2.1.1. Overview
- 11.2.1.2. Products
- 11.2.1.3. SWOT Analysis
- 11.2.1.4. Recent Developments
- 11.2.1.5. Financials (Based on Availability)
- 11.2.2 NBC
- 11.2.2.1. Overview
- 11.2.2.2. Products
- 11.2.2.3. SWOT Analysis
- 11.2.2.4. Recent Developments
- 11.2.2.5. Financials (Based on Availability)
- 11.2.3 BOPP
- 11.2.3.1. Overview
- 11.2.3.2. Products
- 11.2.3.3. SWOT Analysis
- 11.2.3.4. Recent Developments
- 11.2.3.5. Financials (Based on Availability)
- 11.2.4 Haver & Boecker
- 11.2.4.1. Overview
- 11.2.4.2. Products
- 11.2.4.3. SWOT Analysis
- 11.2.4.4. Recent Developments
- 11.2.4.5. Financials (Based on Availability)
- 11.2.5 Nippon Tokushu fabric
- 11.2.5.1. Overview
- 11.2.5.2. Products
- 11.2.5.3. SWOT Analysis
- 11.2.5.4. Recent Developments
- 11.2.5.5. Financials (Based on Availability)
- 11.2.6 MAISHI MFG
- 11.2.6.1. Overview
- 11.2.6.2. Products
- 11.2.6.3. SWOT Analysis
- 11.2.6.4. Recent Developments
- 11.2.6.5. Financials (Based on Availability)
- 11.2.7 Sefar AG
- 11.2.7.1. Overview
- 11.2.7.2. Products
- 11.2.7.3. SWOT Analysis
- 11.2.7.4. Recent Developments
- 11.2.7.5. Financials (Based on Availability)
- 11.2.8 MITANI MICRO
- 11.2.8.1. Overview
- 11.2.8.2. Products
- 11.2.8.3. SWOT Analysis
- 11.2.8.4. Recent Developments
- 11.2.8.5. Financials (Based on Availability)
- 11.2.9 Hebei Anping Printing Screen
- 11.2.9.1. Overview
- 11.2.9.2. Products
- 11.2.9.3. SWOT Analysis
- 11.2.9.4. Recent Developments
- 11.2.9.5. Financials (Based on Availability)
- 11.2.10 Fratelli Mariani
- 11.2.10.1. Overview
- 11.2.10.2. Products
- 11.2.10.3. SWOT Analysis
- 11.2.10.4. Recent Developments
- 11.2.10.5. Financials (Based on Availability)
- 11.2.1 ASADA MESH
List of Figures
- Figure 1: Global Screen Printing Mesh for Solar Cells Revenue Breakdown (million, %) by Region 2024 & 2032
- Figure 2: North America Screen Printing Mesh for Solar Cells Revenue (million), by Application 2024 & 2032
- Figure 3: North America Screen Printing Mesh for Solar Cells Revenue Share (%), by Application 2024 & 2032
- Figure 4: North America Screen Printing Mesh for Solar Cells Revenue (million), by Types 2024 & 2032
- Figure 5: North America Screen Printing Mesh for Solar Cells Revenue Share (%), by Types 2024 & 2032
- Figure 6: North America Screen Printing Mesh for Solar Cells Revenue (million), by Country 2024 & 2032
- Figure 7: North America Screen Printing Mesh for Solar Cells Revenue Share (%), by Country 2024 & 2032
- Figure 8: South America Screen Printing Mesh for Solar Cells Revenue (million), by Application 2024 & 2032
- Figure 9: South America Screen Printing Mesh for Solar Cells Revenue Share (%), by Application 2024 & 2032
- Figure 10: South America Screen Printing Mesh for Solar Cells Revenue (million), by Types 2024 & 2032
- Figure 11: South America Screen Printing Mesh for Solar Cells Revenue Share (%), by Types 2024 & 2032
- Figure 12: South America Screen Printing Mesh for Solar Cells Revenue (million), by Country 2024 & 2032
- Figure 13: South America Screen Printing Mesh for Solar Cells Revenue Share (%), by Country 2024 & 2032
- Figure 14: Europe Screen Printing Mesh for Solar Cells Revenue (million), by Application 2024 & 2032
- Figure 15: Europe Screen Printing Mesh for Solar Cells Revenue Share (%), by Application 2024 & 2032
- Figure 16: Europe Screen Printing Mesh for Solar Cells Revenue (million), by Types 2024 & 2032
- Figure 17: Europe Screen Printing Mesh for Solar Cells Revenue Share (%), by Types 2024 & 2032
- Figure 18: Europe Screen Printing Mesh for Solar Cells Revenue (million), by Country 2024 & 2032
- Figure 19: Europe Screen Printing Mesh for Solar Cells Revenue Share (%), by Country 2024 & 2032
- Figure 20: Middle East & Africa Screen Printing Mesh for Solar Cells Revenue (million), by Application 2024 & 2032
- Figure 21: Middle East & Africa Screen Printing Mesh for Solar Cells Revenue Share (%), by Application 2024 & 2032
- Figure 22: Middle East & Africa Screen Printing Mesh for Solar Cells Revenue (million), by Types 2024 & 2032
- Figure 23: Middle East & Africa Screen Printing Mesh for Solar Cells Revenue Share (%), by Types 2024 & 2032
- Figure 24: Middle East & Africa Screen Printing Mesh for Solar Cells Revenue (million), by Country 2024 & 2032
- Figure 25: Middle East & Africa Screen Printing Mesh for Solar Cells Revenue Share (%), by Country 2024 & 2032
- Figure 26: Asia Pacific Screen Printing Mesh for Solar Cells Revenue (million), by Application 2024 & 2032
- Figure 27: Asia Pacific Screen Printing Mesh for Solar Cells Revenue Share (%), by Application 2024 & 2032
- Figure 28: Asia Pacific Screen Printing Mesh for Solar Cells Revenue (million), by Types 2024 & 2032
- Figure 29: Asia Pacific Screen Printing Mesh for Solar Cells Revenue Share (%), by Types 2024 & 2032
- Figure 30: Asia Pacific Screen Printing Mesh for Solar Cells Revenue (million), by Country 2024 & 2032
- Figure 31: Asia Pacific Screen Printing Mesh for Solar Cells Revenue Share (%), by Country 2024 & 2032
List of Tables
- Table 1: Global Screen Printing Mesh for Solar Cells Revenue million Forecast, by Region 2019 & 2032
- Table 2: Global Screen Printing Mesh for Solar Cells Revenue million Forecast, by Application 2019 & 2032
- Table 3: Global Screen Printing Mesh for Solar Cells Revenue million Forecast, by Types 2019 & 2032
- Table 4: Global Screen Printing Mesh for Solar Cells Revenue million Forecast, by Region 2019 & 2032
- Table 5: Global Screen Printing Mesh for Solar Cells Revenue million Forecast, by Application 2019 & 2032
- Table 6: Global Screen Printing Mesh for Solar Cells Revenue million Forecast, by Types 2019 & 2032
- Table 7: Global Screen Printing Mesh for Solar Cells Revenue million Forecast, by Country 2019 & 2032
- Table 8: United States Screen Printing Mesh for Solar Cells Revenue (million) Forecast, by Application 2019 & 2032
- Table 9: Canada Screen Printing Mesh for Solar Cells Revenue (million) Forecast, by Application 2019 & 2032
- Table 10: Mexico Screen Printing Mesh for Solar Cells Revenue (million) Forecast, by Application 2019 & 2032
- Table 11: Global Screen Printing Mesh for Solar Cells Revenue million Forecast, by Application 2019 & 2032
- Table 12: Global Screen Printing Mesh for Solar Cells Revenue million Forecast, by Types 2019 & 2032
- Table 13: Global Screen Printing Mesh for Solar Cells Revenue million Forecast, by Country 2019 & 2032
- Table 14: Brazil Screen Printing Mesh for Solar Cells Revenue (million) Forecast, by Application 2019 & 2032
- Table 15: Argentina Screen Printing Mesh for Solar Cells Revenue (million) Forecast, by Application 2019 & 2032
- Table 16: Rest of South America Screen Printing Mesh for Solar Cells Revenue (million) Forecast, by Application 2019 & 2032
- Table 17: Global Screen Printing Mesh for Solar Cells Revenue million Forecast, by Application 2019 & 2032
- Table 18: Global Screen Printing Mesh for Solar Cells Revenue million Forecast, by Types 2019 & 2032
- Table 19: Global Screen Printing Mesh for Solar Cells Revenue million Forecast, by Country 2019 & 2032
- Table 20: United Kingdom Screen Printing Mesh for Solar Cells Revenue (million) Forecast, by Application 2019 & 2032
- Table 21: Germany Screen Printing Mesh for Solar Cells Revenue (million) Forecast, by Application 2019 & 2032
- Table 22: France Screen Printing Mesh for Solar Cells Revenue (million) Forecast, by Application 2019 & 2032
- Table 23: Italy Screen Printing Mesh for Solar Cells Revenue (million) Forecast, by Application 2019 & 2032
- Table 24: Spain Screen Printing Mesh for Solar Cells Revenue (million) Forecast, by Application 2019 & 2032
- Table 25: Russia Screen Printing Mesh for Solar Cells Revenue (million) Forecast, by Application 2019 & 2032
- Table 26: Benelux Screen Printing Mesh for Solar Cells Revenue (million) Forecast, by Application 2019 & 2032
- Table 27: Nordics Screen Printing Mesh for Solar Cells Revenue (million) Forecast, by Application 2019 & 2032
- Table 28: Rest of Europe Screen Printing Mesh for Solar Cells Revenue (million) Forecast, by Application 2019 & 2032
- Table 29: Global Screen Printing Mesh for Solar Cells Revenue million Forecast, by Application 2019 & 2032
- Table 30: Global Screen Printing Mesh for Solar Cells Revenue million Forecast, by Types 2019 & 2032
- Table 31: Global Screen Printing Mesh for Solar Cells Revenue million Forecast, by Country 2019 & 2032
- Table 32: Turkey Screen Printing Mesh for Solar Cells Revenue (million) Forecast, by Application 2019 & 2032
- Table 33: Israel Screen Printing Mesh for Solar Cells Revenue (million) Forecast, by Application 2019 & 2032
- Table 34: GCC Screen Printing Mesh for Solar Cells Revenue (million) Forecast, by Application 2019 & 2032
- Table 35: North Africa Screen Printing Mesh for Solar Cells Revenue (million) Forecast, by Application 2019 & 2032
- Table 36: South Africa Screen Printing Mesh for Solar Cells Revenue (million) Forecast, by Application 2019 & 2032
- Table 37: Rest of Middle East & Africa Screen Printing Mesh for Solar Cells Revenue (million) Forecast, by Application 2019 & 2032
- Table 38: Global Screen Printing Mesh for Solar Cells Revenue million Forecast, by Application 2019 & 2032
- Table 39: Global Screen Printing Mesh for Solar Cells Revenue million Forecast, by Types 2019 & 2032
- Table 40: Global Screen Printing Mesh for Solar Cells Revenue million Forecast, by Country 2019 & 2032
- Table 41: China Screen Printing Mesh for Solar Cells Revenue (million) Forecast, by Application 2019 & 2032
- Table 42: India Screen Printing Mesh for Solar Cells Revenue (million) Forecast, by Application 2019 & 2032
- Table 43: Japan Screen Printing Mesh for Solar Cells Revenue (million) Forecast, by Application 2019 & 2032
- Table 44: South Korea Screen Printing Mesh for Solar Cells Revenue (million) Forecast, by Application 2019 & 2032
- Table 45: ASEAN Screen Printing Mesh for Solar Cells Revenue (million) Forecast, by Application 2019 & 2032
- Table 46: Oceania Screen Printing Mesh for Solar Cells Revenue (million) Forecast, by Application 2019 & 2032
- Table 47: Rest of Asia Pacific Screen Printing Mesh for Solar Cells Revenue (million) Forecast, by Application 2019 & 2032
Frequently Asked Questions
1. What is the projected Compound Annual Growth Rate (CAGR) of the Screen Printing Mesh for Solar Cells?
The projected CAGR is approximately XX%.
2. Which companies are prominent players in the Screen Printing Mesh for Solar Cells?
Key companies in the market include ASADA MESH, NBC, BOPP, Haver & Boecker, Nippon Tokushu fabric, MAISHI MFG, Sefar AG, MITANI MICRO, Hebei Anping Printing Screen, Fratelli Mariani.
3. What are the main segments of the Screen Printing Mesh for Solar Cells?
The market segments include Application, Types.
4. Can you provide details about the market size?
The market size is estimated to be USD XXX million as of 2022.
5. What are some drivers contributing to market growth?
N/A
6. What are the notable trends driving market growth?
N/A
7. Are there any restraints impacting market growth?
N/A
8. Can you provide examples of recent developments in the market?
N/A
9. What pricing options are available for accessing the report?
Pricing options include single-user, multi-user, and enterprise licenses priced at USD 2900.00, USD 4350.00, and USD 5800.00 respectively.
10. Is the market size provided in terms of value or volume?
The market size is provided in terms of value, measured in million.
11. Are there any specific market keywords associated with the report?
Yes, the market keyword associated with the report is "Screen Printing Mesh for Solar Cells," which aids in identifying and referencing the specific market segment covered.
12. How do I determine which pricing option suits my needs best?
The pricing options vary based on user requirements and access needs. Individual users may opt for single-user licenses, while businesses requiring broader access may choose multi-user or enterprise licenses for cost-effective access to the report.
13. Are there any additional resources or data provided in the Screen Printing Mesh for Solar Cells report?
While the report offers comprehensive insights, it's advisable to review the specific contents or supplementary materials provided to ascertain if additional resources or data are available.
14. How can I stay updated on further developments or reports in the Screen Printing Mesh for Solar Cells?
To stay informed about further developments, trends, and reports in the Screen Printing Mesh for Solar Cells, consider subscribing to industry newsletters, following relevant companies and organizations, or regularly checking reputable industry news sources and publications.
Methodology
Step 1 - Identification of Relevant Samples Size from Population Database


Step 2 - Approaches for Defining Global Market Size (Value, Volume* & Price*)

Note*: In applicable scenarios
Step 3 - Data Sources
Primary Research
- Web Analytics
- Survey Reports
- Research Institute
- Latest Research Reports
- Opinion Leaders
Secondary Research
- Annual Reports
- White Paper
- Latest Press Release
- Industry Association
- Paid Database
- Investor Presentations

Step 4 - Data Triangulation
Involves using different sources of information in order to increase the validity of a study
These sources are likely to be stakeholders in a program - participants, other researchers, program staff, other community members, and so on.
Then we put all data in single framework & apply various statistical tools to find out the dynamic on the market.
During the analysis stage, feedback from the stakeholder groups would be compared to determine areas of agreement as well as areas of divergence
