

Key Insights
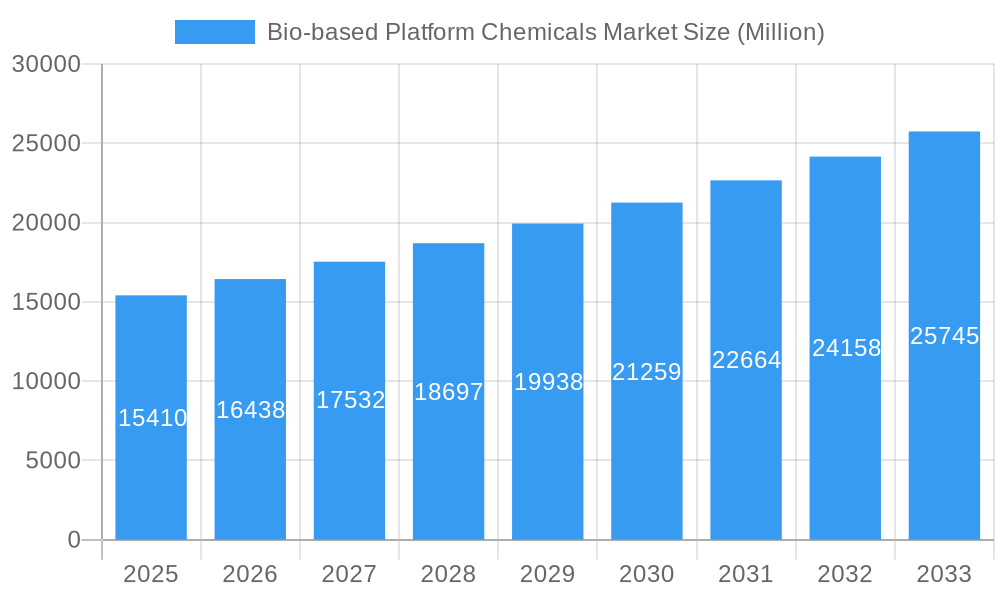
The bio-based platform chemicals market, valued at $15.41 billion in 2025, is projected to experience robust growth, driven by increasing demand for sustainable and renewable alternatives to petrochemical-based products. A compound annual growth rate (CAGR) of 6.61% from 2025 to 2033 forecasts a significant market expansion. This growth is fueled by several key factors. Firstly, the rising global awareness of environmental concerns and the need to reduce carbon emissions is pushing industries to adopt bio-based alternatives. Secondly, supportive government policies and incentives promoting bio-based chemical production are accelerating market adoption. Furthermore, ongoing technological advancements are enhancing the efficiency and cost-effectiveness of bio-based chemical production, making them increasingly competitive with traditional petrochemicals. The market's segmentation, with key products like bio-glycerol, bio-glutamic acid, and bio-succinic acid leading the charge, indicates diverse applications across various industries, including food and beverages, pharmaceuticals, and plastics. Major players like Cargill, Novozymes, and BASF are actively investing in research and development, expanding production capacities, and forging strategic partnerships to solidify their market positions. The Asia-Pacific region, particularly China and India, is anticipated to witness the most substantial growth due to burgeoning industrialization and a strong focus on sustainable development.
Bio-based Platform Chemicals Market Market Size (In Billion)
The market's growth is, however, not without challenges. The relatively high cost of production compared to conventional petrochemicals remains a significant restraint. Fluctuations in raw material prices and the availability of sustainable feedstocks can also impact market dynamics. Additionally, scaling up production to meet the growing demand while maintaining sustainability requires further technological advancements and infrastructure development. Despite these challenges, the long-term outlook for the bio-based platform chemicals market remains positive. The growing awareness of environmental sustainability, coupled with technological advancements and supportive government policies, is poised to drive significant market expansion over the next decade. Competition among existing players and the entry of new players are also expected to intensify.
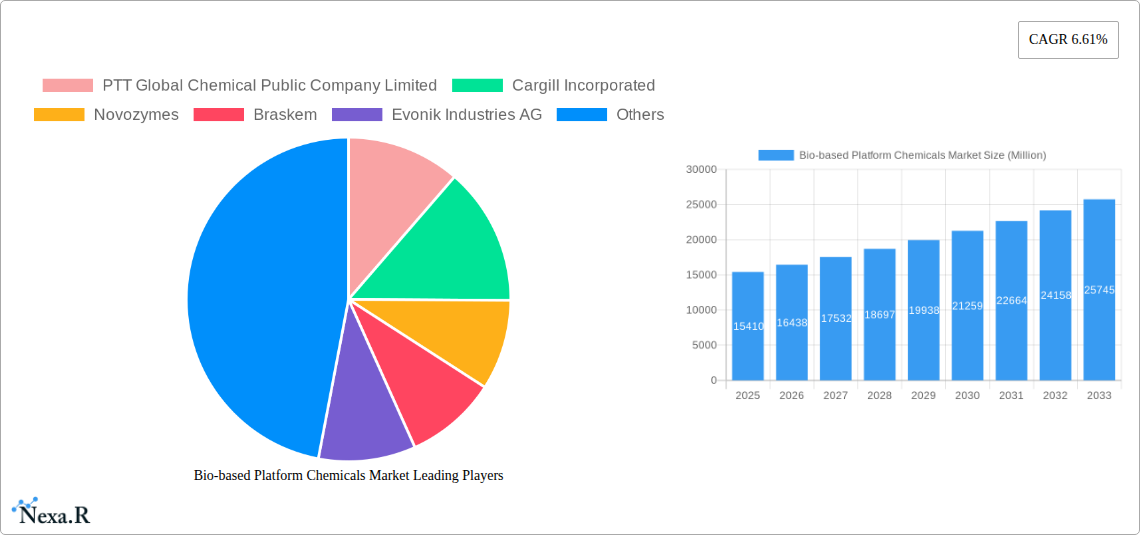
Bio-based Platform Chemicals Market Company Market Share
Bio-based Platform Chemicals Market: A Comprehensive Analysis (2019-2033)
This comprehensive report provides a detailed analysis of the Bio-based Platform Chemicals market, encompassing market dynamics, growth trends, regional segmentation, product landscape, key players, and future outlook. The study period spans from 2019 to 2033, with 2025 serving as the base and estimated year. The report focuses on key segments within the broader Chemicals market, specifically examining the Bio-based Platform Chemicals sub-sector and its contributing factors. The market is expected to reach xx Million by 2033, exhibiting a CAGR of xx% during the forecast period (2025-2033).
Bio-based Platform Chemicals Market Market Dynamics & Structure
This section analyzes the competitive landscape of the Bio-based Platform Chemicals market, considering market concentration, technological advancements, regulatory changes, substitute products, end-user demographics, and mergers and acquisitions (M&A) activities. The market exhibits a moderately concentrated structure, with key players holding significant market share. However, the entry of new players and technological disruptions are expected to reshape the market dynamics in the coming years.
- Market Concentration: The market is characterized by xx% market share held by the top 5 players.
- Technological Innovation: Ongoing research and development in biotechnology and bio-based chemistry are driving innovation, leading to the development of novel bio-based platform chemicals.
- Regulatory Frameworks: Government policies promoting sustainability and renewable resources are influencing market growth.
- Competitive Product Substitutes: Competition exists with traditional petroleum-based chemicals; however, the bio-based alternatives offer sustainability advantages.
- End-User Demographics: Key end-use industries include food & beverage, plastics, pharmaceuticals, and personal care.
- M&A Trends: The number of M&A deals in the bio-based platform chemicals sector averaged xx per year during the historical period (2019-2024).
Bio-based Platform Chemicals Market Growth Trends & Insights
The Bio-based Platform Chemicals market has witnessed significant growth driven by increasing demand for sustainable and renewable alternatives to petroleum-based chemicals. The market size has expanded from xx Million in 2019 to an estimated xx Million in 2025. This growth trajectory is anticipated to continue, with a projected market value of xx Million by 2033. Several factors contribute to this growth, including technological advancements resulting in cost reductions and improved efficiency of production processes, changing consumer preferences towards eco-friendly products, and supportive government regulations. The market penetration of bio-based platform chemicals is steadily increasing across various end-use industries.
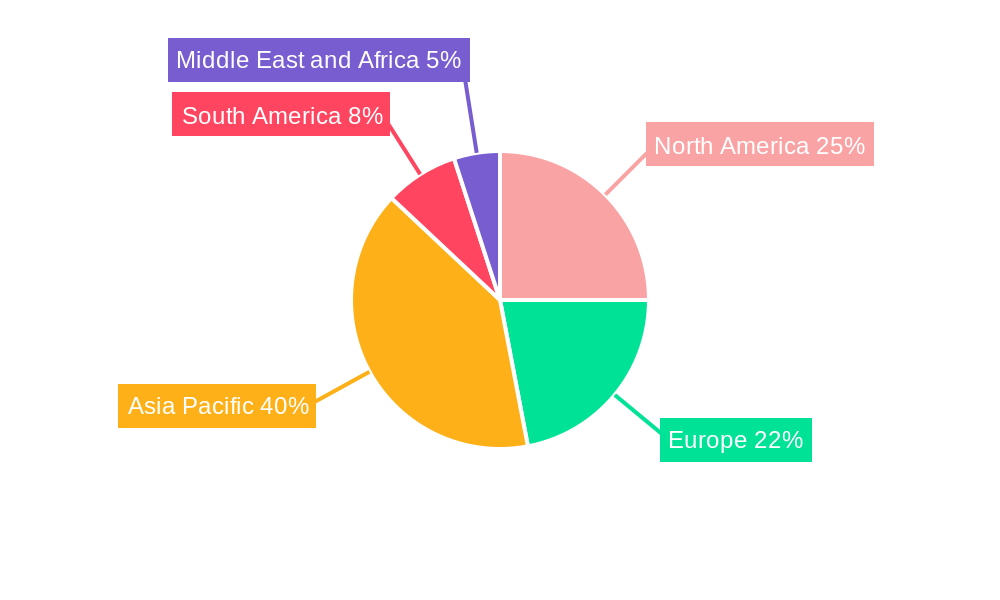
Dominant Regions, Countries, or Segments in Bio-based Platform Chemicals Market
The market is geographically diverse, with significant contributions from North America, Europe, and Asia Pacific. Within product types, Bio Succinic Acid and Bio Glutamic Acid currently dominate due to their established applications and relatively mature production processes.
- North America: Strong government support for bio-based initiatives and a well-established infrastructure contribute to its leading position.
- Europe: The presence of numerous research institutions and a focus on sustainable development drive growth.
- Asia Pacific: Rapid industrialization and increasing demand from emerging economies are fueling expansion.
- Product Type Dominance: Bio Succinic Acid holds the largest market share (xx%), followed by Bio Glutamic Acid (xx%). This is driven by factors like established applications in food and bioplastics for succinic acid, and applications in food and animal feed for glutamic acid.
Bio-based Platform Chemicals Market Product Landscape
The bio-based platform chemicals market showcases a diverse product portfolio, including bio-glycerol, bio-glutamic acid, bio-itaconic acid, bio-3-hydroxypropionic acid, and bio-succinic acid, among others. These chemicals find applications in various industries, ranging from food and beverages to pharmaceuticals and plastics. Continuous innovations focus on enhancing product performance, expanding applications, and improving cost-effectiveness. Unique selling propositions include enhanced sustainability, biodegradability, and reduced carbon footprint compared to petroleum-based alternatives.
Key Drivers, Barriers & Challenges in Bio-based Platform Chemicals Market
Key Drivers:
- Increasing demand for sustainable and renewable chemicals
- Stringent environmental regulations and policies
- Growing consumer awareness of environmental issues
- Technological advancements leading to cost reduction and improved efficiency.
Key Challenges:
- High initial investment costs for bio-based production facilities
- Competition from established petroleum-based chemical manufacturers
- Fluctuations in raw material prices (e.g., agricultural commodities)
- Scalability challenges in bio-based production processes.
Emerging Opportunities in Bio-based Platform Chemicals Market
- Expanding applications in high-growth sectors like bioplastics and biofuels
- Development of new bio-based platform chemicals with unique properties
- Untapped markets in developing countries
- Increasing partnerships and collaborations between industry players and research institutions.
Growth Accelerators in the Bio-based Platform Chemicals Market Industry
The long-term growth of the Bio-based Platform Chemicals market is projected to be driven by several factors, including advancements in biotechnology, enabling cost-effective production of complex chemicals, strategic partnerships between chemical companies and agricultural producers securing reliable supplies of renewable feedstocks, and targeted market expansion efforts focusing on emerging applications.
Key Players Shaping the Bio-based Platform Chemicals Market Market
- PTT Global Chemical Public Company Limited
- Cargill Incorporated
- Novozymes
- Braskem
- Evonik Industries AG
- Tokyo Chemical Industry Co Ltd
- BASF SE
- LyondellBasell Industries Holdings B.V.
- Aktin Chemicals Inc
- DSM
- DuPont
- NIPPON SHOKUBAI CO LTD
- Champlor (Valtris Specialty Chemicals)
- GFBiochemicals Ltd
Notable Milestones in Bio-based Platform Chemicals Market Sector
- 2022 Q3: Braskem launched its bio-based polyethylene (PE) resin derived from sugarcane.
- 2022 Q4: Evonik introduced its bio-based polyamide 12 produced from renewable castor oil.
- 2021 Q2: Novozymes partnered with Cargill to develop bio-based ingredients for the food and beverage industry.
- 2020 Q1: BASF and Toyota Tsusho formed a joint venture to establish a bio-based succinic acid plant in Japan.
In-Depth Bio-based Platform Chemicals Market Market Outlook
The future of the Bio-based Platform Chemicals market appears bright, with significant growth potential driven by increasing demand for sustainable solutions and ongoing technological advancements. Strategic partnerships, expansions into new applications, and continuous innovation will play crucial roles in shaping market dynamics. The focus on developing cost-effective and high-performance bio-based alternatives to traditional chemicals will be a key success factor for market players.
Bio-based Platform Chemicals Market Segmentation
-
1. Product Type
- 1.1. Bio Glycerol
- 1.2. Bio Glutamic Acid
- 1.3. Bio Itaconic Acid
- 1.4. Bio-3-Hydroxypropionic Acid
- 1.5. Bio Succinic Acid
- 1.6. Other Product Types
Bio-based Platform Chemicals Market Segmentation By Geography
-
1. Asia Pacific
- 1.1. China
- 1.2. India
- 1.3. Japan
- 1.4. South Korea
- 1.5. Rest of Asia Pacific
-
2. North America
- 2.1. United States
- 2.2. Canada
- 2.3. Mexico
-
3. Europe
- 3.1. Germany
- 3.2. United Kingdom
- 3.3. Italy
- 3.4. France
- 3.5. Rest of Europe
-
4. South America
- 4.1. Brazil
- 4.2. Argentina
- 4.3. Rest of South America
-
5. Middle East and Africa
- 5.1. South Africa
- 5.2. Saudi Arabia
- 5.3. Rest of Middle East and Africa
Bio-based Platform Chemicals Market Regional Market Share
Geographic Coverage of Bio-based Platform Chemicals Market
Bio-based Platform Chemicals Market REPORT HIGHLIGHTS
| Aspects | Details |
|---|---|
| Study Period | 2020-2034 |
| Base Year | 2025 |
| Estimated Year | 2026 |
| Forecast Period | 2026-2034 |
| Historical Period | 2020-2025 |
| Growth Rate | CAGR of 6.61% from 2020-2034 |
| Segmentation |
|
Table of Contents
- 1. Introduction
- 1.1. Research Scope
- 1.2. Market Segmentation
- 1.3. Research Objective
- 1.4. Definitions and Assumptions
- 2. Executive Summary
- 2.1. Market Snapshot
- 3. Market Dynamics
- 3.1. Market Drivers
- 3.2. Market Restrains
- 3.3. Market Trends
- 3.4. Market Opportunities
- 4. Market Factor Analysis
- 4.1. Porters Five Forces
- 4.1.1. Bargaining Power of Suppliers
- 4.1.2. Bargaining Power of Buyers
- 4.1.3. Threat of New Entrants
- 4.1.4. Threat of Substitutes
- 4.1.5. Competitive Rivalry
- 4.2. PESTEL analysis
- 4.3. BCG Analysis
- 4.3.1. Stars (High Growth, High Market Share)
- 4.3.2. Cash Cows (Low Growth, High Market Share)
- 4.3.3. Question Mark (High Growth, Low Market Share)
- 4.3.4. Dogs (Low Growth, Low Market Share)
- 4.4. Ansoff Matrix Analysis
- 4.5. Supply Chain Analysis
- 4.6. Regulatory Landscape
- 4.7. Current Market Potential and Opportunity Assessment (TAM–SAM–SOM Framework)
- 4.8. NRP Analyst Note
- 4.1. Porters Five Forces
- 5. Market Analysis, Insights and Forecast 2021-2033
- 5.1. Market Analysis, Insights and Forecast - by Product Type
- 5.1.1. Bio Glycerol
- 5.1.2. Bio Glutamic Acid
- 5.1.3. Bio Itaconic Acid
- 5.1.4. Bio-3-Hydroxypropionic Acid
- 5.1.5. Bio Succinic Acid
- 5.1.6. Other Product Types
- 5.2. Market Analysis, Insights and Forecast - by Region
- 5.2.1. Asia Pacific
- 5.2.2. North America
- 5.2.3. Europe
- 5.2.4. South America
- 5.2.5. Middle East and Africa
- 5.1. Market Analysis, Insights and Forecast - by Product Type
- 6. Global Bio-based Platform Chemicals Market Analysis, Insights and Forecast, 2021-2033
- 6.1. Market Analysis, Insights and Forecast - by Product Type
- 6.1.1. Bio Glycerol
- 6.1.2. Bio Glutamic Acid
- 6.1.3. Bio Itaconic Acid
- 6.1.4. Bio-3-Hydroxypropionic Acid
- 6.1.5. Bio Succinic Acid
- 6.1.6. Other Product Types
- 6.1. Market Analysis, Insights and Forecast - by Product Type
- 7. Asia Pacific Bio-based Platform Chemicals Market Analysis, Insights and Forecast, 2020-2032
- 7.1. Market Analysis, Insights and Forecast - by Product Type
- 7.1.1. Bio Glycerol
- 7.1.2. Bio Glutamic Acid
- 7.1.3. Bio Itaconic Acid
- 7.1.4. Bio-3-Hydroxypropionic Acid
- 7.1.5. Bio Succinic Acid
- 7.1.6. Other Product Types
- 7.1. Market Analysis, Insights and Forecast - by Product Type
- 8. North America Bio-based Platform Chemicals Market Analysis, Insights and Forecast, 2020-2032
- 8.1. Market Analysis, Insights and Forecast - by Product Type
- 8.1.1. Bio Glycerol
- 8.1.2. Bio Glutamic Acid
- 8.1.3. Bio Itaconic Acid
- 8.1.4. Bio-3-Hydroxypropionic Acid
- 8.1.5. Bio Succinic Acid
- 8.1.6. Other Product Types
- 8.1. Market Analysis, Insights and Forecast - by Product Type
- 9. Europe Bio-based Platform Chemicals Market Analysis, Insights and Forecast, 2020-2032
- 9.1. Market Analysis, Insights and Forecast - by Product Type
- 9.1.1. Bio Glycerol
- 9.1.2. Bio Glutamic Acid
- 9.1.3. Bio Itaconic Acid
- 9.1.4. Bio-3-Hydroxypropionic Acid
- 9.1.5. Bio Succinic Acid
- 9.1.6. Other Product Types
- 9.1. Market Analysis, Insights and Forecast - by Product Type
- 10. South America Bio-based Platform Chemicals Market Analysis, Insights and Forecast, 2020-2032
- 10.1. Market Analysis, Insights and Forecast - by Product Type
- 10.1.1. Bio Glycerol
- 10.1.2. Bio Glutamic Acid
- 10.1.3. Bio Itaconic Acid
- 10.1.4. Bio-3-Hydroxypropionic Acid
- 10.1.5. Bio Succinic Acid
- 10.1.6. Other Product Types
- 10.1. Market Analysis, Insights and Forecast - by Product Type
- 11. Middle East and Africa Bio-based Platform Chemicals Market Analysis, Insights and Forecast, 2020-2032
- 11.1. Market Analysis, Insights and Forecast - by Product Type
- 11.1.1. Bio Glycerol
- 11.1.2. Bio Glutamic Acid
- 11.1.3. Bio Itaconic Acid
- 11.1.4. Bio-3-Hydroxypropionic Acid
- 11.1.5. Bio Succinic Acid
- 11.1.6. Other Product Types
- 11.1. Market Analysis, Insights and Forecast - by Product Type
- 12. Competitive Analysis
- 12.1. Company Profiles
- 12.1.1 PTT Global Chemical Public Company Limited
- 12.1.1.1. Company Overview
- 12.1.1.2. Products
- 12.1.1.3. Company Financials
- 12.1.1.4. SWOT Analysis
- 12.1.2 Cargill Incorporated
- 12.1.2.1. Company Overview
- 12.1.2.2. Products
- 12.1.2.3. Company Financials
- 12.1.2.4. SWOT Analysis
- 12.1.3 Novozymes
- 12.1.3.1. Company Overview
- 12.1.3.2. Products
- 12.1.3.3. Company Financials
- 12.1.3.4. SWOT Analysis
- 12.1.4 Braskem
- 12.1.4.1. Company Overview
- 12.1.4.2. Products
- 12.1.4.3. Company Financials
- 12.1.4.4. SWOT Analysis
- 12.1.5 Evonik Industries AG
- 12.1.5.1. Company Overview
- 12.1.5.2. Products
- 12.1.5.3. Company Financials
- 12.1.5.4. SWOT Analysis
- 12.1.6 Tokyo Chemical Industry Co Ltd *List Not Exhaustive
- 12.1.6.1. Company Overview
- 12.1.6.2. Products
- 12.1.6.3. Company Financials
- 12.1.6.4. SWOT Analysis
- 12.1.7 BASF SE
- 12.1.7.1. Company Overview
- 12.1.7.2. Products
- 12.1.7.3. Company Financials
- 12.1.7.4. SWOT Analysis
- 12.1.8 LyondellBasell Industries Holdings B V
- 12.1.8.1. Company Overview
- 12.1.8.2. Products
- 12.1.8.3. Company Financials
- 12.1.8.4. SWOT Analysis
- 12.1.9 Aktin Chemicals Inc
- 12.1.9.1. Company Overview
- 12.1.9.2. Products
- 12.1.9.3. Company Financials
- 12.1.9.4. SWOT Analysis
- 12.1.10 DSM
- 12.1.10.1. Company Overview
- 12.1.10.2. Products
- 12.1.10.3. Company Financials
- 12.1.10.4. SWOT Analysis
- 12.1.11 DuPont
- 12.1.11.1. Company Overview
- 12.1.11.2. Products
- 12.1.11.3. Company Financials
- 12.1.11.4. SWOT Analysis
- 12.1.12 NIPPON SHOKUBAI CO LTD
- 12.1.12.1. Company Overview
- 12.1.12.2. Products
- 12.1.12.3. Company Financials
- 12.1.12.4. SWOT Analysis
- 12.1.13 Champlor (Valtris Specialty Chemicals)
- 12.1.13.1. Company Overview
- 12.1.13.2. Products
- 12.1.13.3. Company Financials
- 12.1.13.4. SWOT Analysis
- 12.1.14 GFBiochemicals Ltd
- 12.1.14.1. Company Overview
- 12.1.14.2. Products
- 12.1.14.3. Company Financials
- 12.1.14.4. SWOT Analysis
- 12.1.1 PTT Global Chemical Public Company Limited
- 12.2. Market Entropy
- 12.2.1 Company's Key Areas Served
- 12.2.2 Recent Developments
- 12.3. Company Market Share Analysis 2025
- 12.3.1 Top 5 Companies Market Share Analysis
- 12.3.2 Top 3 Companies Market Share Analysis
- 12.4. List of Potential Customers
- 13. Research Methodology
List of Figures
- Figure 1: Global Bio-based Platform Chemicals Market Revenue Breakdown (Million, %) by Region 2025 & 2033
- Figure 2: Global Bio-based Platform Chemicals Market Volume Breakdown (K Tons, %) by Region 2025 & 2033
- Figure 3: Asia Pacific Bio-based Platform Chemicals Market Revenue (Million), by Product Type 2025 & 2033
- Figure 4: Asia Pacific Bio-based Platform Chemicals Market Volume (K Tons), by Product Type 2025 & 2033
- Figure 5: Asia Pacific Bio-based Platform Chemicals Market Revenue Share (%), by Product Type 2025 & 2033
- Figure 6: Asia Pacific Bio-based Platform Chemicals Market Volume Share (%), by Product Type 2025 & 2033
- Figure 7: Asia Pacific Bio-based Platform Chemicals Market Revenue (Million), by Country 2025 & 2033
- Figure 8: Asia Pacific Bio-based Platform Chemicals Market Volume (K Tons), by Country 2025 & 2033
- Figure 9: Asia Pacific Bio-based Platform Chemicals Market Revenue Share (%), by Country 2025 & 2033
- Figure 10: Asia Pacific Bio-based Platform Chemicals Market Volume Share (%), by Country 2025 & 2033
- Figure 11: North America Bio-based Platform Chemicals Market Revenue (Million), by Product Type 2025 & 2033
- Figure 12: North America Bio-based Platform Chemicals Market Volume (K Tons), by Product Type 2025 & 2033
- Figure 13: North America Bio-based Platform Chemicals Market Revenue Share (%), by Product Type 2025 & 2033
- Figure 14: North America Bio-based Platform Chemicals Market Volume Share (%), by Product Type 2025 & 2033
- Figure 15: North America Bio-based Platform Chemicals Market Revenue (Million), by Country 2025 & 2033
- Figure 16: North America Bio-based Platform Chemicals Market Volume (K Tons), by Country 2025 & 2033
- Figure 17: North America Bio-based Platform Chemicals Market Revenue Share (%), by Country 2025 & 2033
- Figure 18: North America Bio-based Platform Chemicals Market Volume Share (%), by Country 2025 & 2033
- Figure 19: Europe Bio-based Platform Chemicals Market Revenue (Million), by Product Type 2025 & 2033
- Figure 20: Europe Bio-based Platform Chemicals Market Volume (K Tons), by Product Type 2025 & 2033
- Figure 21: Europe Bio-based Platform Chemicals Market Revenue Share (%), by Product Type 2025 & 2033
- Figure 22: Europe Bio-based Platform Chemicals Market Volume Share (%), by Product Type 2025 & 2033
- Figure 23: Europe Bio-based Platform Chemicals Market Revenue (Million), by Country 2025 & 2033
- Figure 24: Europe Bio-based Platform Chemicals Market Volume (K Tons), by Country 2025 & 2033
- Figure 25: Europe Bio-based Platform Chemicals Market Revenue Share (%), by Country 2025 & 2033
- Figure 26: Europe Bio-based Platform Chemicals Market Volume Share (%), by Country 2025 & 2033
- Figure 27: South America Bio-based Platform Chemicals Market Revenue (Million), by Product Type 2025 & 2033
- Figure 28: South America Bio-based Platform Chemicals Market Volume (K Tons), by Product Type 2025 & 2033
- Figure 29: South America Bio-based Platform Chemicals Market Revenue Share (%), by Product Type 2025 & 2033
- Figure 30: South America Bio-based Platform Chemicals Market Volume Share (%), by Product Type 2025 & 2033
- Figure 31: South America Bio-based Platform Chemicals Market Revenue (Million), by Country 2025 & 2033
- Figure 32: South America Bio-based Platform Chemicals Market Volume (K Tons), by Country 2025 & 2033
- Figure 33: South America Bio-based Platform Chemicals Market Revenue Share (%), by Country 2025 & 2033
- Figure 34: South America Bio-based Platform Chemicals Market Volume Share (%), by Country 2025 & 2033
- Figure 35: Middle East and Africa Bio-based Platform Chemicals Market Revenue (Million), by Product Type 2025 & 2033
- Figure 36: Middle East and Africa Bio-based Platform Chemicals Market Volume (K Tons), by Product Type 2025 & 2033
- Figure 37: Middle East and Africa Bio-based Platform Chemicals Market Revenue Share (%), by Product Type 2025 & 2033
- Figure 38: Middle East and Africa Bio-based Platform Chemicals Market Volume Share (%), by Product Type 2025 & 2033
- Figure 39: Middle East and Africa Bio-based Platform Chemicals Market Revenue (Million), by Country 2025 & 2033
- Figure 40: Middle East and Africa Bio-based Platform Chemicals Market Volume (K Tons), by Country 2025 & 2033
- Figure 41: Middle East and Africa Bio-based Platform Chemicals Market Revenue Share (%), by Country 2025 & 2033
- Figure 42: Middle East and Africa Bio-based Platform Chemicals Market Volume Share (%), by Country 2025 & 2033
List of Tables
- Table 1: Global Bio-based Platform Chemicals Market Revenue Million Forecast, by Product Type 2020 & 2033
- Table 2: Global Bio-based Platform Chemicals Market Volume K Tons Forecast, by Product Type 2020 & 2033
- Table 3: Global Bio-based Platform Chemicals Market Revenue Million Forecast, by Region 2020 & 2033
- Table 4: Global Bio-based Platform Chemicals Market Volume K Tons Forecast, by Region 2020 & 2033
- Table 5: Global Bio-based Platform Chemicals Market Revenue Million Forecast, by Product Type 2020 & 2033
- Table 6: Global Bio-based Platform Chemicals Market Volume K Tons Forecast, by Product Type 2020 & 2033
- Table 7: Global Bio-based Platform Chemicals Market Revenue Million Forecast, by Country 2020 & 2033
- Table 8: Global Bio-based Platform Chemicals Market Volume K Tons Forecast, by Country 2020 & 2033
- Table 9: China Bio-based Platform Chemicals Market Revenue (Million) Forecast, by Application 2020 & 2033
- Table 10: China Bio-based Platform Chemicals Market Volume (K Tons) Forecast, by Application 2020 & 2033
- Table 11: India Bio-based Platform Chemicals Market Revenue (Million) Forecast, by Application 2020 & 2033
- Table 12: India Bio-based Platform Chemicals Market Volume (K Tons) Forecast, by Application 2020 & 2033
- Table 13: Japan Bio-based Platform Chemicals Market Revenue (Million) Forecast, by Application 2020 & 2033
- Table 14: Japan Bio-based Platform Chemicals Market Volume (K Tons) Forecast, by Application 2020 & 2033
- Table 15: South Korea Bio-based Platform Chemicals Market Revenue (Million) Forecast, by Application 2020 & 2033
- Table 16: South Korea Bio-based Platform Chemicals Market Volume (K Tons) Forecast, by Application 2020 & 2033
- Table 17: Rest of Asia Pacific Bio-based Platform Chemicals Market Revenue (Million) Forecast, by Application 2020 & 2033
- Table 18: Rest of Asia Pacific Bio-based Platform Chemicals Market Volume (K Tons) Forecast, by Application 2020 & 2033
- Table 19: Global Bio-based Platform Chemicals Market Revenue Million Forecast, by Product Type 2020 & 2033
- Table 20: Global Bio-based Platform Chemicals Market Volume K Tons Forecast, by Product Type 2020 & 2033
- Table 21: Global Bio-based Platform Chemicals Market Revenue Million Forecast, by Country 2020 & 2033
- Table 22: Global Bio-based Platform Chemicals Market Volume K Tons Forecast, by Country 2020 & 2033
- Table 23: United States Bio-based Platform Chemicals Market Revenue (Million) Forecast, by Application 2020 & 2033
- Table 24: United States Bio-based Platform Chemicals Market Volume (K Tons) Forecast, by Application 2020 & 2033
- Table 25: Canada Bio-based Platform Chemicals Market Revenue (Million) Forecast, by Application 2020 & 2033
- Table 26: Canada Bio-based Platform Chemicals Market Volume (K Tons) Forecast, by Application 2020 & 2033
- Table 27: Mexico Bio-based Platform Chemicals Market Revenue (Million) Forecast, by Application 2020 & 2033
- Table 28: Mexico Bio-based Platform Chemicals Market Volume (K Tons) Forecast, by Application 2020 & 2033
- Table 29: Global Bio-based Platform Chemicals Market Revenue Million Forecast, by Product Type 2020 & 2033
- Table 30: Global Bio-based Platform Chemicals Market Volume K Tons Forecast, by Product Type 2020 & 2033
- Table 31: Global Bio-based Platform Chemicals Market Revenue Million Forecast, by Country 2020 & 2033
- Table 32: Global Bio-based Platform Chemicals Market Volume K Tons Forecast, by Country 2020 & 2033
- Table 33: Germany Bio-based Platform Chemicals Market Revenue (Million) Forecast, by Application 2020 & 2033
- Table 34: Germany Bio-based Platform Chemicals Market Volume (K Tons) Forecast, by Application 2020 & 2033
- Table 35: United Kingdom Bio-based Platform Chemicals Market Revenue (Million) Forecast, by Application 2020 & 2033
- Table 36: United Kingdom Bio-based Platform Chemicals Market Volume (K Tons) Forecast, by Application 2020 & 2033
- Table 37: Italy Bio-based Platform Chemicals Market Revenue (Million) Forecast, by Application 2020 & 2033
- Table 38: Italy Bio-based Platform Chemicals Market Volume (K Tons) Forecast, by Application 2020 & 2033
- Table 39: France Bio-based Platform Chemicals Market Revenue (Million) Forecast, by Application 2020 & 2033
- Table 40: France Bio-based Platform Chemicals Market Volume (K Tons) Forecast, by Application 2020 & 2033
- Table 41: Rest of Europe Bio-based Platform Chemicals Market Revenue (Million) Forecast, by Application 2020 & 2033
- Table 42: Rest of Europe Bio-based Platform Chemicals Market Volume (K Tons) Forecast, by Application 2020 & 2033
- Table 43: Global Bio-based Platform Chemicals Market Revenue Million Forecast, by Product Type 2020 & 2033
- Table 44: Global Bio-based Platform Chemicals Market Volume K Tons Forecast, by Product Type 2020 & 2033
- Table 45: Global Bio-based Platform Chemicals Market Revenue Million Forecast, by Country 2020 & 2033
- Table 46: Global Bio-based Platform Chemicals Market Volume K Tons Forecast, by Country 2020 & 2033
- Table 47: Brazil Bio-based Platform Chemicals Market Revenue (Million) Forecast, by Application 2020 & 2033
- Table 48: Brazil Bio-based Platform Chemicals Market Volume (K Tons) Forecast, by Application 2020 & 2033
- Table 49: Argentina Bio-based Platform Chemicals Market Revenue (Million) Forecast, by Application 2020 & 2033
- Table 50: Argentina Bio-based Platform Chemicals Market Volume (K Tons) Forecast, by Application 2020 & 2033
- Table 51: Rest of South America Bio-based Platform Chemicals Market Revenue (Million) Forecast, by Application 2020 & 2033
- Table 52: Rest of South America Bio-based Platform Chemicals Market Volume (K Tons) Forecast, by Application 2020 & 2033
- Table 53: Global Bio-based Platform Chemicals Market Revenue Million Forecast, by Product Type 2020 & 2033
- Table 54: Global Bio-based Platform Chemicals Market Volume K Tons Forecast, by Product Type 2020 & 2033
- Table 55: Global Bio-based Platform Chemicals Market Revenue Million Forecast, by Country 2020 & 2033
- Table 56: Global Bio-based Platform Chemicals Market Volume K Tons Forecast, by Country 2020 & 2033
- Table 57: South Africa Bio-based Platform Chemicals Market Revenue (Million) Forecast, by Application 2020 & 2033
- Table 58: South Africa Bio-based Platform Chemicals Market Volume (K Tons) Forecast, by Application 2020 & 2033
- Table 59: Saudi Arabia Bio-based Platform Chemicals Market Revenue (Million) Forecast, by Application 2020 & 2033
- Table 60: Saudi Arabia Bio-based Platform Chemicals Market Volume (K Tons) Forecast, by Application 2020 & 2033
- Table 61: Rest of Middle East and Africa Bio-based Platform Chemicals Market Revenue (Million) Forecast, by Application 2020 & 2033
- Table 62: Rest of Middle East and Africa Bio-based Platform Chemicals Market Volume (K Tons) Forecast, by Application 2020 & 2033
Frequently Asked Questions
1. What is the projected Compound Annual Growth Rate (CAGR) of the Bio-based Platform Chemicals Market?
The projected CAGR is approximately 6.61%.
2. Which companies are prominent players in the Bio-based Platform Chemicals Market?
Key companies in the market include PTT Global Chemical Public Company Limited, Cargill Incorporated, Novozymes, Braskem, Evonik Industries AG, Tokyo Chemical Industry Co Ltd *List Not Exhaustive, BASF SE, LyondellBasell Industries Holdings B V, Aktin Chemicals Inc, DSM, DuPont, NIPPON SHOKUBAI CO LTD, Champlor (Valtris Specialty Chemicals), GFBiochemicals Ltd.
3. What are the main segments of the Bio-based Platform Chemicals Market?
The market segments include Product Type.
4. Can you provide details about the market size?
The market size is estimated to be USD 15.41 Million as of 2022.
5. What are some drivers contributing to market growth?
Favorable Government Regulations for Bio-Based Platform Chemicals; Consumer Inclination Towards the Use of Environmental Friendly and Sustainable Products; Other Drivers.
6. What are the notable trends driving market growth?
Bio-Itaconic acid (IA) Segment to Witness Strong Growth.
7. Are there any restraints impacting market growth?
High Cost of Production; Other Restraints.
8. Can you provide examples of recent developments in the market?
Product Launches: Braskem announced the launch of its bio-based polyethylene (PE) resin, which is derived from sugarcane. Evonik introduced its bio-based polyamide 12, which is produced from renewable castor oil.
9. What pricing options are available for accessing the report?
Pricing options include single-user, multi-user, and enterprise licenses priced at USD 4750, USD 5250, and USD 8750 respectively.
10. Is the market size provided in terms of value or volume?
The market size is provided in terms of value, measured in Million and volume, measured in K Tons.
11. Are there any specific market keywords associated with the report?
Yes, the market keyword associated with the report is "Bio-based Platform Chemicals Market," which aids in identifying and referencing the specific market segment covered.
12. How do I determine which pricing option suits my needs best?
The pricing options vary based on user requirements and access needs. Individual users may opt for single-user licenses, while businesses requiring broader access may choose multi-user or enterprise licenses for cost-effective access to the report.
13. Are there any additional resources or data provided in the Bio-based Platform Chemicals Market report?
While the report offers comprehensive insights, it's advisable to review the specific contents or supplementary materials provided to ascertain if additional resources or data are available.
14. How can I stay updated on further developments or reports in the Bio-based Platform Chemicals Market?
To stay informed about further developments, trends, and reports in the Bio-based Platform Chemicals Market, consider subscribing to industry newsletters, following relevant companies and organizations, or regularly checking reputable industry news sources and publications.
Methodology
Step 1 - Identification of Relevant Samples Size from Population Database


Step 2 - Approaches for Defining Global Market Size (Value, Volume* & Price*)

Note*: In applicable scenarios
Step 3 - Data Sources
Primary Research
- Web Analytics
- Survey Reports
- Research Institute
- Latest Research Reports
- Opinion Leaders
Secondary Research
- Annual Reports
- White Paper
- Latest Press Release
- Industry Association
- Paid Database
- Investor Presentations

Step 4 - Data Triangulation
Involves using different sources of information in order to increase the validity of a study
These sources are likely to be stakeholders in a program - participants, other researchers, program staff, other community members, and so on.
Then we put all data in single framework & apply various statistical tools to find out the dynamic on the market.
During the analysis stage, feedback from the stakeholder groups would be compared to determine areas of agreement as well as areas of divergence