

Key Insights
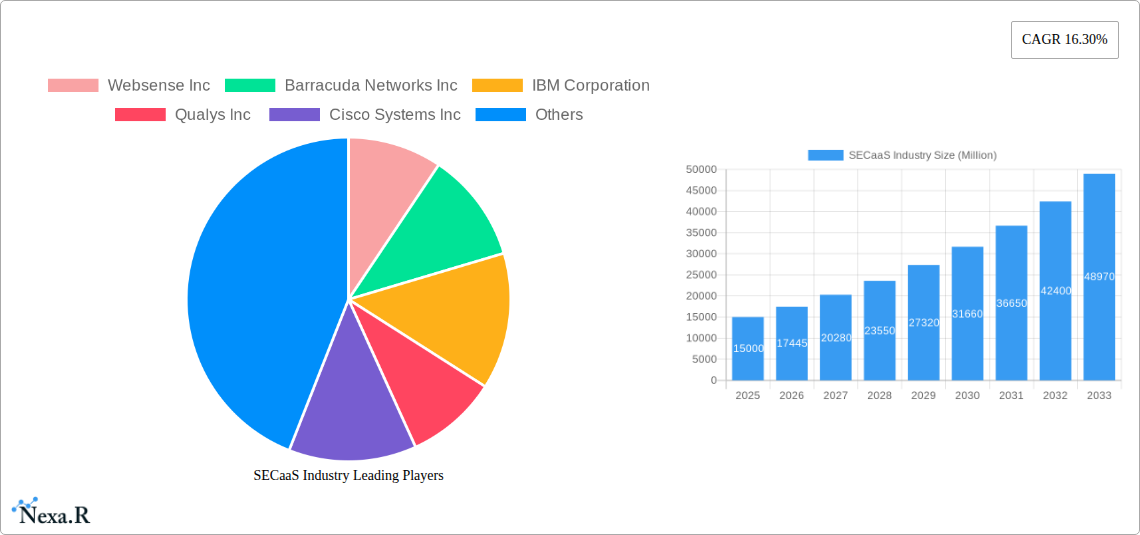
The Secure Cloud Access Security Broker (SECaaS) market is experiencing robust growth, driven by the increasing adoption of cloud services and the rising need for enhanced security and compliance. The market's Compound Annual Growth Rate (CAGR) of 16.30% from 2019-2024 suggests a significant expansion, and this momentum is projected to continue into the forecast period (2025-2033). Key drivers include the escalating threat landscape, including sophisticated cyberattacks targeting cloud-based data and applications, coupled with stringent regulatory compliance requirements (e.g., GDPR, HIPAA). The rising adoption of Bring Your Own Device (BYOD) policies further fuels the demand for SECaaS solutions, as organizations seek to secure access to corporate resources from various devices and locations. Market segmentation reveals strong growth across various solutions, including Identity and Access Management (IAM), Secure Web Gateways (SWG), and Security Information and Event Management (SIEM), with large enterprises currently dominating market share due to their higher budgets and complex security needs. However, the Small and Medium Enterprises (SME) segment shows promising growth potential as cloud adoption accelerates within this sector. The geographic distribution indicates strong market presence in North America and Europe, but substantial growth opportunities exist in Asia Pacific and other emerging markets.
The competitive landscape is characterized by a mix of established players like Cisco, IBM, and McAfee, alongside specialized SECaaS vendors. These companies are constantly innovating and expanding their product offerings to cater to evolving customer needs, with a focus on advanced threat detection, data loss prevention, and automated security orchestration. The increasing sophistication of cyberattacks necessitates continuous improvements in SECaaS solutions, pushing vendors to invest heavily in research and development. This competitive intensity drives innovation and ultimately benefits end-users through more robust and efficient security solutions. Future growth will be significantly influenced by advancements in artificial intelligence (AI) and machine learning (ML) for enhanced threat detection and response capabilities, along with greater integration with other security tools for holistic security management. The continued migration of workloads and data to the cloud will remain a primary catalyst for market expansion throughout the forecast period.
SECaaS Industry Market Report: 2019-2033
This comprehensive report provides an in-depth analysis of the Security-as-a-Service (SECaaS) industry, encompassing market dynamics, growth trends, competitive landscape, and future outlook. With a focus on both parent (Cybersecurity) and child (SECaaS) markets, this report is essential for industry professionals, investors, and strategic decision-makers seeking to navigate this rapidly evolving landscape. The study period covers 2019-2033, with 2025 as the base and estimated year. The forecast period spans 2025-2033, and the historical period encompasses 2019-2024. The market size is presented in millions of units.
SECaaS Industry Market Dynamics & Structure
The SECaaS market exhibits a moderately concentrated structure with key players vying for market share. Technological innovation, particularly in AI-driven threat detection and automation, is a primary driver, while regulatory compliance mandates (e.g., GDPR, CCPA) and evolving cybersecurity threats fuel demand. Competitive substitutes include on-premise security solutions, but the scalability, cost-effectiveness, and ease of management offered by SECaaS are driving its adoption. The end-user demographic spans SMEs and large enterprises across various sectors, with large enterprises currently holding a larger market share. M&A activity has been significant, with a predicted xx number of deals in 2024, consolidating market share and enhancing service offerings.
- Market Concentration: Moderately concentrated, with top 5 players holding an estimated 55% market share in 2024.
- Innovation Drivers: AI-driven threat detection, automation, and cloud integration.
- Regulatory Frameworks: GDPR, CCPA, and other regional regulations drive adoption.
- Competitive Substitutes: On-premise security solutions.
- End-User Demographics: SMEs and large enterprises across diverse sectors.
- M&A Trends: xx deals in 2024, driving consolidation and innovation.
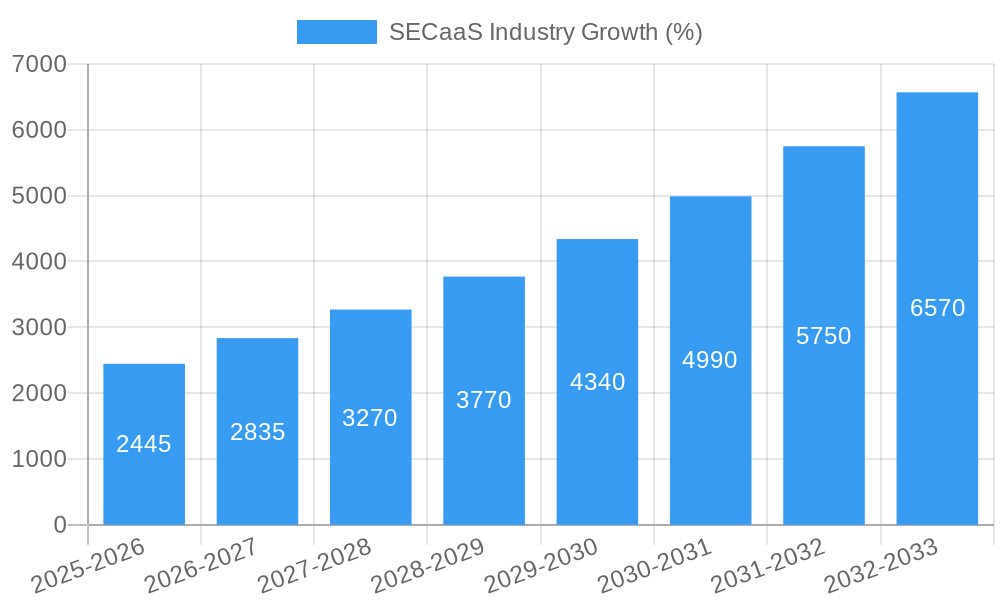
SECaaS Industry Growth Trends & Insights
The SECaaS market experienced significant growth during the historical period (2019-2024), with a CAGR of xx%. This growth is attributed to increasing cyber threats, rising adoption of cloud computing, and the growing preference for subscription-based services. Market penetration is predicted to reach xx% by 2025, with continued strong growth expected throughout the forecast period (2025-2033), driven by factors such as the increasing sophistication of cyberattacks, the expanding attack surface due to remote work, and the growing awareness of cybersecurity risks among businesses. Technological disruptions, such as the increasing adoption of AI and machine learning in security solutions, are further fueling this growth. Shifting consumer behavior towards proactive security measures and the demand for greater visibility into security posture are key factors. The market size is projected to reach xx million by 2033.
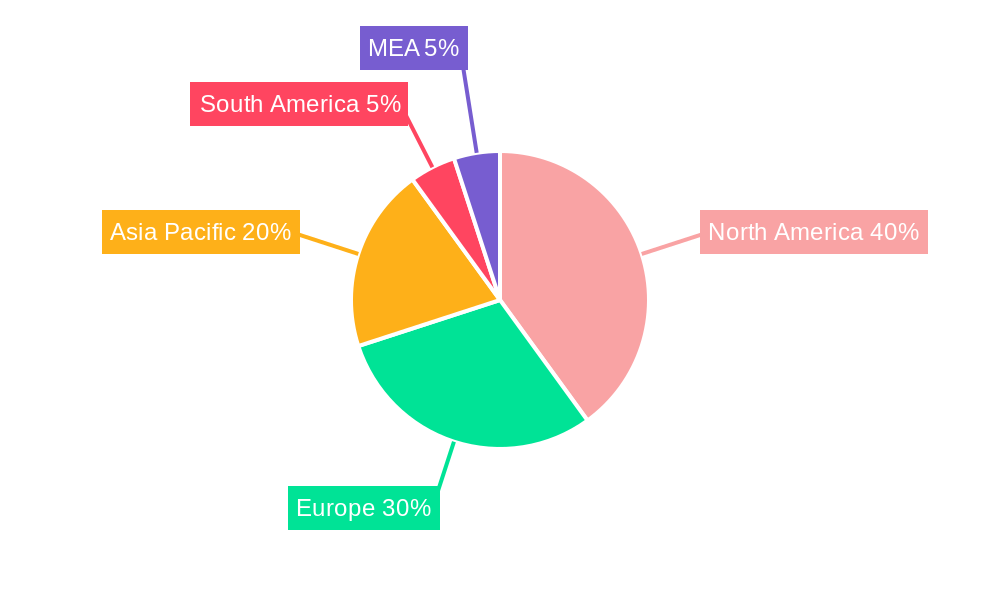
Dominant Regions, Countries, or Segments in SECaaS Industry
North America currently dominates the SECaaS market, driven by strong technological advancements, high adoption rates of cloud services, and a robust regulatory landscape. Within solutions, Secure Web Gateway and Identity and Access Management segments are leading the way due to increasing internet usage and evolving regulations. Large enterprises are the primary adopters due to their higher security needs and budgets. However, the SME segment is demonstrating significant growth potential. Europe and Asia-Pacific are also experiencing considerable growth.
- Key Drivers: Strong regulatory frameworks (North America), increasing digitalization (Asia-Pacific), rising cyber threats (Global).
- Dominant Segment: Secure Web Gateway and Identity and Access Management.
- Largest Adopters: Large Enterprises, with high growth potential in the SME segment.
- Growth Potential: Asia-Pacific and EMEA regions.
SECaaS Industry Product Landscape
The SECaaS market features a diverse range of solutions, including Identity and Access Management (IAM), Secure Email Gateway (SEG), Secure Web Gateway (SWG), Vulnerability Management (VM), Security Information and Event Management (SIEM), Application Security Testing (AST), and other specialized offerings. These solutions incorporate advanced technologies like AI, machine learning, and automation to enhance threat detection and response capabilities. Key differentiators include ease of use, scalability, comprehensive threat coverage, and integration with existing IT infrastructure.
Key Drivers, Barriers & Challenges in SECaaS Industry
Key Drivers:
- Increasing cyber threats and data breaches.
- Growing adoption of cloud computing and remote work.
- Rising awareness of cybersecurity risks.
- Government regulations and compliance mandates.
Challenges and Restraints:
- Integration complexities with existing security infrastructure.
- Concerns regarding data privacy and security.
- High upfront costs for implementation.
- Skill gaps in managing and utilizing SECaaS solutions.
Emerging Opportunities in SECaaS Industry
The SECaaS market presents several emerging opportunities. The expansion into untapped markets, particularly in developing economies, presents significant potential. The integration of advanced technologies, such as extended detection and response (XDR), zero trust security, and IoT security, offers new avenues for growth. The increasing demand for specialized SECaaS solutions tailored to specific industry needs, like healthcare or finance, is another key opportunity.
Growth Accelerators in the SECaaS Industry
Long-term growth in the SECaaS industry will be driven by several key factors. Technological advancements, such as improved AI-powered threat detection and automation, will enhance the effectiveness and efficiency of security solutions. Strategic partnerships between SECaaS providers and other technology companies will broaden market reach and create comprehensive security solutions. Finally, expansion into new geographic markets and the development of customized solutions for niche industries will fuel continued growth.
Key Players Shaping the SECaaS Industry Market
- Websense Inc
- Barracuda Networks Inc
- IBM Corporation
- Qualys Inc
- Cisco Systems Inc
- Proofpoint Inc
- Trend Micro Incorporated
- McAfee (Intel)
- ZSCaler Inc
- Symantec Corporation
- Sophos PLC
- Dell Technologies
Notable Milestones in SECaaS Industry Sector
- June 2022: Allot Ltd. partners with Proximus to launch cybersecurity services in Luxembourg. This highlights the growing collaboration between SECaaS providers and CSPs to expand market reach.
- February 2022: Nokia launches new SaaS services in analytics and security, furthering the shift towards cloud-based security solutions and flexible service models for enterprises and CSPs.
In-Depth SECaaS Industry Market Outlook
The SECaaS market is poised for continued strong growth, driven by technological advancements, increasing cybersecurity threats, and expanding adoption across various industries. Strategic partnerships, innovative product development, and expansion into emerging markets will be key to capturing the significant market potential. The focus on AI-driven solutions, proactive threat intelligence, and seamless integration with existing IT infrastructure will be critical for success.
SECaaS Industry Segmentation
-
1. Solution
- 1.1. Identity and Access Management
- 1.2. Secure Email Gateway
- 1.3. Secure Web Gateway
- 1.4. Vulnerability Management
- 1.5. Security Information and Event Management
- 1.6. Application Security Testing
- 1.7. Other Solutions
-
2. Organization Size
- 2.1. Small and Medium Enterprises
- 2.2. Large Enterprises
SECaaS Industry Segmentation By Geography
-
1. North America
- 1.1. United States
- 1.2. Canada
-
2. Europe
- 2.1. United Kingdom
- 2.2. Germany
- 2.3. France
- 2.4. Rest of Europe
-
3. Asia Pacific
- 3.1. China
- 3.2. India
- 3.3. Japan
- 3.4. Australia
- 3.5. Rest of Asia Pacific
- 4. Latin America
- 5. Middle East
SECaaS Industry REPORT HIGHLIGHTS
| Aspects | Details |
|---|---|
| Study Period | 2019-2033 |
| Base Year | 2024 |
| Estimated Year | 2025 |
| Forecast Period | 2025-2033 |
| Historical Period | 2019-2024 |
| Growth Rate | CAGR of 16.30% from 2019-2033 |
| Segmentation |
|
Table of Contents
- 1. Introduction
- 1.1. Research Scope
- 1.2. Market Segmentation
- 1.3. Research Methodology
- 1.4. Definitions and Assumptions
- 2. Executive Summary
- 2.1. Introduction
- 3. Market Dynamics
- 3.1. Introduction
- 3.2. Market Drivers
- 3.2.1. Increasing Need for Advanced Cloud Security Solutions; Increasing Trend of BYOD in Enterprises
- 3.3. Market Restrains
- 3.3.1. Vulnerability of Cloud-Based Applications to Cyber Crimes
- 3.4. Market Trends
- 3.4.1. Secure Email Gateway is Expected to Hold a Significant Share
- 4. Market Factor Analysis
- 4.1. Porters Five Forces
- 4.2. Supply/Value Chain
- 4.3. PESTEL analysis
- 4.4. Market Entropy
- 4.5. Patent/Trademark Analysis
- 5. Global SECaaS Industry Analysis, Insights and Forecast, 2019-2031
- 5.1. Market Analysis, Insights and Forecast - by Solution
- 5.1.1. Identity and Access Management
- 5.1.2. Secure Email Gateway
- 5.1.3. Secure Web Gateway
- 5.1.4. Vulnerability Management
- 5.1.5. Security Information and Event Management
- 5.1.6. Application Security Testing
- 5.1.7. Other Solutions
- 5.2. Market Analysis, Insights and Forecast - by Organization Size
- 5.2.1. Small and Medium Enterprises
- 5.2.2. Large Enterprises
- 5.3. Market Analysis, Insights and Forecast - by Region
- 5.3.1. North America
- 5.3.2. Europe
- 5.3.3. Asia Pacific
- 5.3.4. Latin America
- 5.3.5. Middle East
- 5.1. Market Analysis, Insights and Forecast - by Solution
- 6. North America SECaaS Industry Analysis, Insights and Forecast, 2019-2031
- 6.1. Market Analysis, Insights and Forecast - by Solution
- 6.1.1. Identity and Access Management
- 6.1.2. Secure Email Gateway
- 6.1.3. Secure Web Gateway
- 6.1.4. Vulnerability Management
- 6.1.5. Security Information and Event Management
- 6.1.6. Application Security Testing
- 6.1.7. Other Solutions
- 6.2. Market Analysis, Insights and Forecast - by Organization Size
- 6.2.1. Small and Medium Enterprises
- 6.2.2. Large Enterprises
- 6.1. Market Analysis, Insights and Forecast - by Solution
- 7. Europe SECaaS Industry Analysis, Insights and Forecast, 2019-2031
- 7.1. Market Analysis, Insights and Forecast - by Solution
- 7.1.1. Identity and Access Management
- 7.1.2. Secure Email Gateway
- 7.1.3. Secure Web Gateway
- 7.1.4. Vulnerability Management
- 7.1.5. Security Information and Event Management
- 7.1.6. Application Security Testing
- 7.1.7. Other Solutions
- 7.2. Market Analysis, Insights and Forecast - by Organization Size
- 7.2.1. Small and Medium Enterprises
- 7.2.2. Large Enterprises
- 7.1. Market Analysis, Insights and Forecast - by Solution
- 8. Asia Pacific SECaaS Industry Analysis, Insights and Forecast, 2019-2031
- 8.1. Market Analysis, Insights and Forecast - by Solution
- 8.1.1. Identity and Access Management
- 8.1.2. Secure Email Gateway
- 8.1.3. Secure Web Gateway
- 8.1.4. Vulnerability Management
- 8.1.5. Security Information and Event Management
- 8.1.6. Application Security Testing
- 8.1.7. Other Solutions
- 8.2. Market Analysis, Insights and Forecast - by Organization Size
- 8.2.1. Small and Medium Enterprises
- 8.2.2. Large Enterprises
- 8.1. Market Analysis, Insights and Forecast - by Solution
- 9. Latin America SECaaS Industry Analysis, Insights and Forecast, 2019-2031
- 9.1. Market Analysis, Insights and Forecast - by Solution
- 9.1.1. Identity and Access Management
- 9.1.2. Secure Email Gateway
- 9.1.3. Secure Web Gateway
- 9.1.4. Vulnerability Management
- 9.1.5. Security Information and Event Management
- 9.1.6. Application Security Testing
- 9.1.7. Other Solutions
- 9.2. Market Analysis, Insights and Forecast - by Organization Size
- 9.2.1. Small and Medium Enterprises
- 9.2.2. Large Enterprises
- 9.1. Market Analysis, Insights and Forecast - by Solution
- 10. Middle East SECaaS Industry Analysis, Insights and Forecast, 2019-2031
- 10.1. Market Analysis, Insights and Forecast - by Solution
- 10.1.1. Identity and Access Management
- 10.1.2. Secure Email Gateway
- 10.1.3. Secure Web Gateway
- 10.1.4. Vulnerability Management
- 10.1.5. Security Information and Event Management
- 10.1.6. Application Security Testing
- 10.1.7. Other Solutions
- 10.2. Market Analysis, Insights and Forecast - by Organization Size
- 10.2.1. Small and Medium Enterprises
- 10.2.2. Large Enterprises
- 10.1. Market Analysis, Insights and Forecast - by Solution
- 11. North America SECaaS Industry Analysis, Insights and Forecast, 2019-2031
- 11.1. Market Analysis, Insights and Forecast - By Country/Sub-region
- 11.1.1 United States
- 11.1.2 Canada
- 11.1.3 Mexico
- 12. Europe SECaaS Industry Analysis, Insights and Forecast, 2019-2031
- 12.1. Market Analysis, Insights and Forecast - By Country/Sub-region
- 12.1.1 Germany
- 12.1.2 United Kingdom
- 12.1.3 France
- 12.1.4 Spain
- 12.1.5 Italy
- 12.1.6 Spain
- 12.1.7 Belgium
- 12.1.8 Netherland
- 12.1.9 Nordics
- 12.1.10 Rest of Europe
- 13. Asia Pacific SECaaS Industry Analysis, Insights and Forecast, 2019-2031
- 13.1. Market Analysis, Insights and Forecast - By Country/Sub-region
- 13.1.1 China
- 13.1.2 Japan
- 13.1.3 India
- 13.1.4 South Korea
- 13.1.5 Southeast Asia
- 13.1.6 Australia
- 13.1.7 Indonesia
- 13.1.8 Phillipes
- 13.1.9 Singapore
- 13.1.10 Thailandc
- 13.1.11 Rest of Asia Pacific
- 14. South America SECaaS Industry Analysis, Insights and Forecast, 2019-2031
- 14.1. Market Analysis, Insights and Forecast - By Country/Sub-region
- 14.1.1 Brazil
- 14.1.2 Argentina
- 14.1.3 Peru
- 14.1.4 Chile
- 14.1.5 Colombia
- 14.1.6 Ecuador
- 14.1.7 Venezuela
- 14.1.8 Rest of South America
- 15. North America SECaaS Industry Analysis, Insights and Forecast, 2019-2031
- 15.1. Market Analysis, Insights and Forecast - By Country/Sub-region
- 15.1.1 United States
- 15.1.2 Canada
- 15.1.3 Mexico
- 16. MEA SECaaS Industry Analysis, Insights and Forecast, 2019-2031
- 16.1. Market Analysis, Insights and Forecast - By Country/Sub-region
- 16.1.1 United Arab Emirates
- 16.1.2 Saudi Arabia
- 16.1.3 South Africa
- 16.1.4 Rest of Middle East and Africa
- 17. Competitive Analysis
- 17.1. Global Market Share Analysis 2024
- 17.2. Company Profiles
- 17.2.1 Websense Inc
- 17.2.1.1. Overview
- 17.2.1.2. Products
- 17.2.1.3. SWOT Analysis
- 17.2.1.4. Recent Developments
- 17.2.1.5. Financials (Based on Availability)
- 17.2.2 Barracuda Networks Inc
- 17.2.2.1. Overview
- 17.2.2.2. Products
- 17.2.2.3. SWOT Analysis
- 17.2.2.4. Recent Developments
- 17.2.2.5. Financials (Based on Availability)
- 17.2.3 IBM Corporation
- 17.2.3.1. Overview
- 17.2.3.2. Products
- 17.2.3.3. SWOT Analysis
- 17.2.3.4. Recent Developments
- 17.2.3.5. Financials (Based on Availability)
- 17.2.4 Qualys Inc
- 17.2.4.1. Overview
- 17.2.4.2. Products
- 17.2.4.3. SWOT Analysis
- 17.2.4.4. Recent Developments
- 17.2.4.5. Financials (Based on Availability)
- 17.2.5 Cisco Systems Inc
- 17.2.5.1. Overview
- 17.2.5.2. Products
- 17.2.5.3. SWOT Analysis
- 17.2.5.4. Recent Developments
- 17.2.5.5. Financials (Based on Availability)
- 17.2.6 Proofpoint Inc
- 17.2.6.1. Overview
- 17.2.6.2. Products
- 17.2.6.3. SWOT Analysis
- 17.2.6.4. Recent Developments
- 17.2.6.5. Financials (Based on Availability)
- 17.2.7 Trend Micro Incorporated
- 17.2.7.1. Overview
- 17.2.7.2. Products
- 17.2.7.3. SWOT Analysis
- 17.2.7.4. Recent Developments
- 17.2.7.5. Financials (Based on Availability)
- 17.2.8 McAfee (Intel)
- 17.2.8.1. Overview
- 17.2.8.2. Products
- 17.2.8.3. SWOT Analysis
- 17.2.8.4. Recent Developments
- 17.2.8.5. Financials (Based on Availability)
- 17.2.9 ZSCaler Inc
- 17.2.9.1. Overview
- 17.2.9.2. Products
- 17.2.9.3. SWOT Analysis
- 17.2.9.4. Recent Developments
- 17.2.9.5. Financials (Based on Availability)
- 17.2.10 Symantec Corporation
- 17.2.10.1. Overview
- 17.2.10.2. Products
- 17.2.10.3. SWOT Analysis
- 17.2.10.4. Recent Developments
- 17.2.10.5. Financials (Based on Availability)
- 17.2.11 Sophos PLC
- 17.2.11.1. Overview
- 17.2.11.2. Products
- 17.2.11.3. SWOT Analysis
- 17.2.11.4. Recent Developments
- 17.2.11.5. Financials (Based on Availability)
- 17.2.12 Dell Technologies
- 17.2.12.1. Overview
- 17.2.12.2. Products
- 17.2.12.3. SWOT Analysis
- 17.2.12.4. Recent Developments
- 17.2.12.5. Financials (Based on Availability)
- 17.2.1 Websense Inc
List of Figures
- Figure 1: Global SECaaS Industry Revenue Breakdown (Million, %) by Region 2024 & 2032
- Figure 2: North America SECaaS Industry Revenue (Million), by Country 2024 & 2032
- Figure 3: North America SECaaS Industry Revenue Share (%), by Country 2024 & 2032
- Figure 4: Europe SECaaS Industry Revenue (Million), by Country 2024 & 2032
- Figure 5: Europe SECaaS Industry Revenue Share (%), by Country 2024 & 2032
- Figure 6: Asia Pacific SECaaS Industry Revenue (Million), by Country 2024 & 2032
- Figure 7: Asia Pacific SECaaS Industry Revenue Share (%), by Country 2024 & 2032
- Figure 8: South America SECaaS Industry Revenue (Million), by Country 2024 & 2032
- Figure 9: South America SECaaS Industry Revenue Share (%), by Country 2024 & 2032
- Figure 10: North America SECaaS Industry Revenue (Million), by Country 2024 & 2032
- Figure 11: North America SECaaS Industry Revenue Share (%), by Country 2024 & 2032
- Figure 12: MEA SECaaS Industry Revenue (Million), by Country 2024 & 2032
- Figure 13: MEA SECaaS Industry Revenue Share (%), by Country 2024 & 2032
- Figure 14: North America SECaaS Industry Revenue (Million), by Solution 2024 & 2032
- Figure 15: North America SECaaS Industry Revenue Share (%), by Solution 2024 & 2032
- Figure 16: North America SECaaS Industry Revenue (Million), by Organization Size 2024 & 2032
- Figure 17: North America SECaaS Industry Revenue Share (%), by Organization Size 2024 & 2032
- Figure 18: North America SECaaS Industry Revenue (Million), by Country 2024 & 2032
- Figure 19: North America SECaaS Industry Revenue Share (%), by Country 2024 & 2032
- Figure 20: Europe SECaaS Industry Revenue (Million), by Solution 2024 & 2032
- Figure 21: Europe SECaaS Industry Revenue Share (%), by Solution 2024 & 2032
- Figure 22: Europe SECaaS Industry Revenue (Million), by Organization Size 2024 & 2032
- Figure 23: Europe SECaaS Industry Revenue Share (%), by Organization Size 2024 & 2032
- Figure 24: Europe SECaaS Industry Revenue (Million), by Country 2024 & 2032
- Figure 25: Europe SECaaS Industry Revenue Share (%), by Country 2024 & 2032
- Figure 26: Asia Pacific SECaaS Industry Revenue (Million), by Solution 2024 & 2032
- Figure 27: Asia Pacific SECaaS Industry Revenue Share (%), by Solution 2024 & 2032
- Figure 28: Asia Pacific SECaaS Industry Revenue (Million), by Organization Size 2024 & 2032
- Figure 29: Asia Pacific SECaaS Industry Revenue Share (%), by Organization Size 2024 & 2032
- Figure 30: Asia Pacific SECaaS Industry Revenue (Million), by Country 2024 & 2032
- Figure 31: Asia Pacific SECaaS Industry Revenue Share (%), by Country 2024 & 2032
- Figure 32: Latin America SECaaS Industry Revenue (Million), by Solution 2024 & 2032
- Figure 33: Latin America SECaaS Industry Revenue Share (%), by Solution 2024 & 2032
- Figure 34: Latin America SECaaS Industry Revenue (Million), by Organization Size 2024 & 2032
- Figure 35: Latin America SECaaS Industry Revenue Share (%), by Organization Size 2024 & 2032
- Figure 36: Latin America SECaaS Industry Revenue (Million), by Country 2024 & 2032
- Figure 37: Latin America SECaaS Industry Revenue Share (%), by Country 2024 & 2032
- Figure 38: Middle East SECaaS Industry Revenue (Million), by Solution 2024 & 2032
- Figure 39: Middle East SECaaS Industry Revenue Share (%), by Solution 2024 & 2032
- Figure 40: Middle East SECaaS Industry Revenue (Million), by Organization Size 2024 & 2032
- Figure 41: Middle East SECaaS Industry Revenue Share (%), by Organization Size 2024 & 2032
- Figure 42: Middle East SECaaS Industry Revenue (Million), by Country 2024 & 2032
- Figure 43: Middle East SECaaS Industry Revenue Share (%), by Country 2024 & 2032
List of Tables
- Table 1: Global SECaaS Industry Revenue Million Forecast, by Region 2019 & 2032
- Table 2: Global SECaaS Industry Revenue Million Forecast, by Solution 2019 & 2032
- Table 3: Global SECaaS Industry Revenue Million Forecast, by Organization Size 2019 & 2032
- Table 4: Global SECaaS Industry Revenue Million Forecast, by Region 2019 & 2032
- Table 5: Global SECaaS Industry Revenue Million Forecast, by Country 2019 & 2032
- Table 6: United States SECaaS Industry Revenue (Million) Forecast, by Application 2019 & 2032
- Table 7: Canada SECaaS Industry Revenue (Million) Forecast, by Application 2019 & 2032
- Table 8: Mexico SECaaS Industry Revenue (Million) Forecast, by Application 2019 & 2032
- Table 9: Global SECaaS Industry Revenue Million Forecast, by Country 2019 & 2032
- Table 10: Germany SECaaS Industry Revenue (Million) Forecast, by Application 2019 & 2032
- Table 11: United Kingdom SECaaS Industry Revenue (Million) Forecast, by Application 2019 & 2032
- Table 12: France SECaaS Industry Revenue (Million) Forecast, by Application 2019 & 2032
- Table 13: Spain SECaaS Industry Revenue (Million) Forecast, by Application 2019 & 2032
- Table 14: Italy SECaaS Industry Revenue (Million) Forecast, by Application 2019 & 2032
- Table 15: Spain SECaaS Industry Revenue (Million) Forecast, by Application 2019 & 2032
- Table 16: Belgium SECaaS Industry Revenue (Million) Forecast, by Application 2019 & 2032
- Table 17: Netherland SECaaS Industry Revenue (Million) Forecast, by Application 2019 & 2032
- Table 18: Nordics SECaaS Industry Revenue (Million) Forecast, by Application 2019 & 2032
- Table 19: Rest of Europe SECaaS Industry Revenue (Million) Forecast, by Application 2019 & 2032
- Table 20: Global SECaaS Industry Revenue Million Forecast, by Country 2019 & 2032
- Table 21: China SECaaS Industry Revenue (Million) Forecast, by Application 2019 & 2032
- Table 22: Japan SECaaS Industry Revenue (Million) Forecast, by Application 2019 & 2032
- Table 23: India SECaaS Industry Revenue (Million) Forecast, by Application 2019 & 2032
- Table 24: South Korea SECaaS Industry Revenue (Million) Forecast, by Application 2019 & 2032
- Table 25: Southeast Asia SECaaS Industry Revenue (Million) Forecast, by Application 2019 & 2032
- Table 26: Australia SECaaS Industry Revenue (Million) Forecast, by Application 2019 & 2032
- Table 27: Indonesia SECaaS Industry Revenue (Million) Forecast, by Application 2019 & 2032
- Table 28: Phillipes SECaaS Industry Revenue (Million) Forecast, by Application 2019 & 2032
- Table 29: Singapore SECaaS Industry Revenue (Million) Forecast, by Application 2019 & 2032
- Table 30: Thailandc SECaaS Industry Revenue (Million) Forecast, by Application 2019 & 2032
- Table 31: Rest of Asia Pacific SECaaS Industry Revenue (Million) Forecast, by Application 2019 & 2032
- Table 32: Global SECaaS Industry Revenue Million Forecast, by Country 2019 & 2032
- Table 33: Brazil SECaaS Industry Revenue (Million) Forecast, by Application 2019 & 2032
- Table 34: Argentina SECaaS Industry Revenue (Million) Forecast, by Application 2019 & 2032
- Table 35: Peru SECaaS Industry Revenue (Million) Forecast, by Application 2019 & 2032
- Table 36: Chile SECaaS Industry Revenue (Million) Forecast, by Application 2019 & 2032
- Table 37: Colombia SECaaS Industry Revenue (Million) Forecast, by Application 2019 & 2032
- Table 38: Ecuador SECaaS Industry Revenue (Million) Forecast, by Application 2019 & 2032
- Table 39: Venezuela SECaaS Industry Revenue (Million) Forecast, by Application 2019 & 2032
- Table 40: Rest of South America SECaaS Industry Revenue (Million) Forecast, by Application 2019 & 2032
- Table 41: Global SECaaS Industry Revenue Million Forecast, by Country 2019 & 2032
- Table 42: United States SECaaS Industry Revenue (Million) Forecast, by Application 2019 & 2032
- Table 43: Canada SECaaS Industry Revenue (Million) Forecast, by Application 2019 & 2032
- Table 44: Mexico SECaaS Industry Revenue (Million) Forecast, by Application 2019 & 2032
- Table 45: Global SECaaS Industry Revenue Million Forecast, by Country 2019 & 2032
- Table 46: United Arab Emirates SECaaS Industry Revenue (Million) Forecast, by Application 2019 & 2032
- Table 47: Saudi Arabia SECaaS Industry Revenue (Million) Forecast, by Application 2019 & 2032
- Table 48: South Africa SECaaS Industry Revenue (Million) Forecast, by Application 2019 & 2032
- Table 49: Rest of Middle East and Africa SECaaS Industry Revenue (Million) Forecast, by Application 2019 & 2032
- Table 50: Global SECaaS Industry Revenue Million Forecast, by Solution 2019 & 2032
- Table 51: Global SECaaS Industry Revenue Million Forecast, by Organization Size 2019 & 2032
- Table 52: Global SECaaS Industry Revenue Million Forecast, by Country 2019 & 2032
- Table 53: United States SECaaS Industry Revenue (Million) Forecast, by Application 2019 & 2032
- Table 54: Canada SECaaS Industry Revenue (Million) Forecast, by Application 2019 & 2032
- Table 55: Global SECaaS Industry Revenue Million Forecast, by Solution 2019 & 2032
- Table 56: Global SECaaS Industry Revenue Million Forecast, by Organization Size 2019 & 2032
- Table 57: Global SECaaS Industry Revenue Million Forecast, by Country 2019 & 2032
- Table 58: United Kingdom SECaaS Industry Revenue (Million) Forecast, by Application 2019 & 2032
- Table 59: Germany SECaaS Industry Revenue (Million) Forecast, by Application 2019 & 2032
- Table 60: France SECaaS Industry Revenue (Million) Forecast, by Application 2019 & 2032
- Table 61: Rest of Europe SECaaS Industry Revenue (Million) Forecast, by Application 2019 & 2032
- Table 62: Global SECaaS Industry Revenue Million Forecast, by Solution 2019 & 2032
- Table 63: Global SECaaS Industry Revenue Million Forecast, by Organization Size 2019 & 2032
- Table 64: Global SECaaS Industry Revenue Million Forecast, by Country 2019 & 2032
- Table 65: China SECaaS Industry Revenue (Million) Forecast, by Application 2019 & 2032
- Table 66: India SECaaS Industry Revenue (Million) Forecast, by Application 2019 & 2032
- Table 67: Japan SECaaS Industry Revenue (Million) Forecast, by Application 2019 & 2032
- Table 68: Australia SECaaS Industry Revenue (Million) Forecast, by Application 2019 & 2032
- Table 69: Rest of Asia Pacific SECaaS Industry Revenue (Million) Forecast, by Application 2019 & 2032
- Table 70: Global SECaaS Industry Revenue Million Forecast, by Solution 2019 & 2032
- Table 71: Global SECaaS Industry Revenue Million Forecast, by Organization Size 2019 & 2032
- Table 72: Global SECaaS Industry Revenue Million Forecast, by Country 2019 & 2032
- Table 73: Global SECaaS Industry Revenue Million Forecast, by Solution 2019 & 2032
- Table 74: Global SECaaS Industry Revenue Million Forecast, by Organization Size 2019 & 2032
- Table 75: Global SECaaS Industry Revenue Million Forecast, by Country 2019 & 2032
Frequently Asked Questions
1. What is the projected Compound Annual Growth Rate (CAGR) of the SECaaS Industry?
The projected CAGR is approximately 16.30%.
2. Which companies are prominent players in the SECaaS Industry?
Key companies in the market include Websense Inc, Barracuda Networks Inc, IBM Corporation, Qualys Inc , Cisco Systems Inc, Proofpoint Inc, Trend Micro Incorporated, McAfee (Intel), ZSCaler Inc, Symantec Corporation, Sophos PLC, Dell Technologies.
3. What are the main segments of the SECaaS Industry?
The market segments include Solution, Organization Size.
4. Can you provide details about the market size?
The market size is estimated to be USD XX Million as of 2022.
5. What are some drivers contributing to market growth?
Increasing Need for Advanced Cloud Security Solutions; Increasing Trend of BYOD in Enterprises.
6. What are the notable trends driving market growth?
Secure Email Gateway is Expected to Hold a Significant Share.
7. Are there any restraints impacting market growth?
Vulnerability of Cloud-Based Applications to Cyber Crimes.
8. Can you provide examples of recent developments in the market?
June 2022: Allot Ltd., a provider of innovative network intelligence and security-as-a-service (SECaaS) solutions for communication service providers (CSPs) and enterprises, declared that communications service provider Proximus, under its Tango brand name, introduced cybersecurity services for its mobile residential customers in Luxembourg based on Allot NetworkSecure.
9. What pricing options are available for accessing the report?
Pricing options include single-user, multi-user, and enterprise licenses priced at USD 4750, USD 5250, and USD 8750 respectively.
10. Is the market size provided in terms of value or volume?
The market size is provided in terms of value, measured in Million.
11. Are there any specific market keywords associated with the report?
Yes, the market keyword associated with the report is "SECaaS Industry," which aids in identifying and referencing the specific market segment covered.
12. How do I determine which pricing option suits my needs best?
The pricing options vary based on user requirements and access needs. Individual users may opt for single-user licenses, while businesses requiring broader access may choose multi-user or enterprise licenses for cost-effective access to the report.
13. Are there any additional resources or data provided in the SECaaS Industry report?
While the report offers comprehensive insights, it's advisable to review the specific contents or supplementary materials provided to ascertain if additional resources or data are available.
14. How can I stay updated on further developments or reports in the SECaaS Industry?
To stay informed about further developments, trends, and reports in the SECaaS Industry, consider subscribing to industry newsletters, following relevant companies and organizations, or regularly checking reputable industry news sources and publications.
Methodology
Step 1 - Identification of Relevant Samples Size from Population Database


Step 2 - Approaches for Defining Global Market Size (Value, Volume* & Price*)

Note*: In applicable scenarios
Step 3 - Data Sources
Primary Research
- Web Analytics
- Survey Reports
- Research Institute
- Latest Research Reports
- Opinion Leaders
Secondary Research
- Annual Reports
- White Paper
- Latest Press Release
- Industry Association
- Paid Database
- Investor Presentations

Step 4 - Data Triangulation
Involves using different sources of information in order to increase the validity of a study
These sources are likely to be stakeholders in a program - participants, other researchers, program staff, other community members, and so on.
Then we put all data in single framework & apply various statistical tools to find out the dynamic on the market.
During the analysis stage, feedback from the stakeholder groups would be compared to determine areas of agreement as well as areas of divergence
