

Key Insights
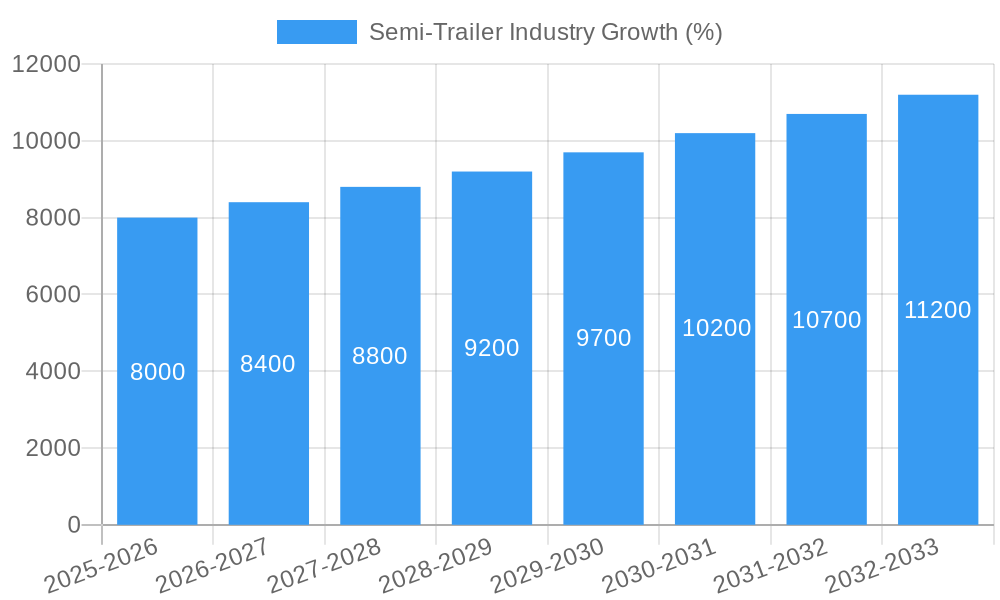
The global semi-trailer market is experiencing robust growth, projected to maintain a Compound Annual Growth Rate (CAGR) exceeding 5.30% from 2025 to 2033. This expansion is fueled by several key factors. The burgeoning e-commerce sector necessitates efficient and large-scale logistics solutions, driving demand for reliable semi-trailers across various segments. Furthermore, the global increase in cross-border trade and the expansion of international supply chains contribute significantly to market growth. Infrastructure development projects, particularly in emerging economies, further boost demand for heavy-duty semi-trailers for transporting construction materials and other goods. Technological advancements, such as the integration of telematics and advanced safety features in semi-trailers, are also enhancing market appeal. While supply chain disruptions and fluctuations in raw material prices pose challenges, the long-term outlook for the semi-trailer market remains positive, driven by consistent demand from logistics companies and the overall growth of global trade.
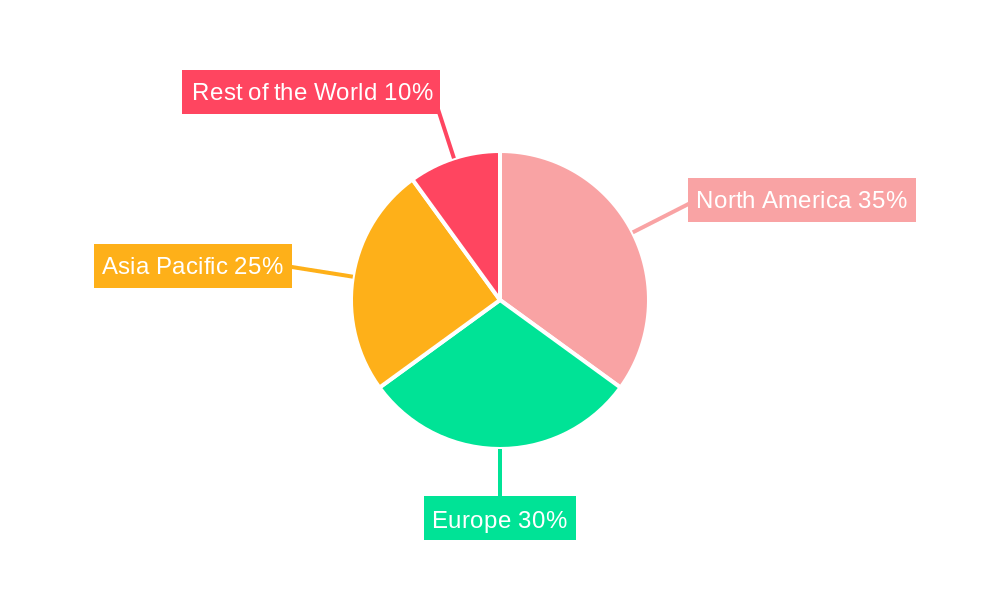
Market segmentation reveals interesting trends. The demand for refrigerated and dry van semi-trailers is consistently high, reflecting the importance of temperature-sensitive goods and general freight transport. The high-tonnage segments (51T-100T and above 100T) are likely to experience faster growth due to the increasing movement of heavy goods and raw materials. Geographically, North America and Europe currently hold significant market share due to established infrastructure and a large logistics industry. However, the Asia-Pacific region shows promising growth potential driven by rapid industrialization and expanding e-commerce activities, particularly in China and India. Leading manufacturers like Wabash National Corporation, Great Dane LLC, and Krone GmbH & Co KG are continually innovating to cater to the evolving needs of the market, including increased fuel efficiency and sustainability initiatives.
Semi-Trailer Industry Market Report: 2019-2033
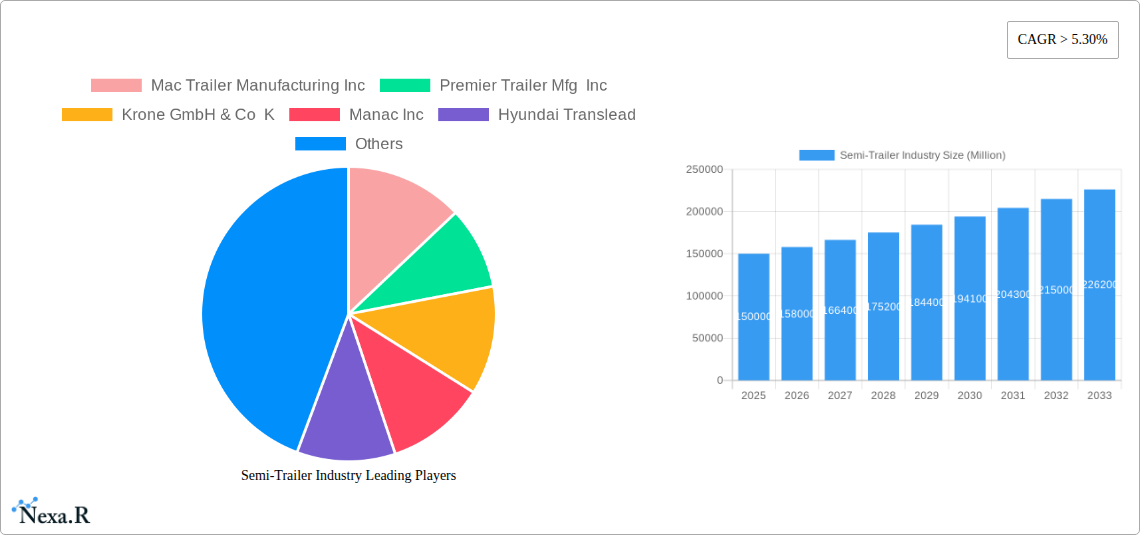
This comprehensive report provides a detailed analysis of the global semi-trailer industry, encompassing market dynamics, growth trends, regional performance, product landscape, and key players. The study covers the period from 2019 to 2033, with a base year of 2025 and a forecast period of 2025-2033. The report segments the market by vehicle type (lowboy, flatbed, refrigerated, dry van, others), tonnage (below 25T, 25T-50T, 51T-100T, above 100T), and foot length (28-45 feet, >45 feet), offering granular insights into market size and growth potential across various segments. Key players analyzed include Mac Trailer Manufacturing Inc, Premier Trailer Mfg Inc, Krone GmbH & Co KG, Manac Inc, Hyundai Translead, Great Dane LLC, Wabash National Corporation, Schmitz Cargobull AG, China International Marine Containers (Group) Ltd, Pitts Trailers, East Manufacturing Corporation, and Kentucky Trailer. This report is an essential resource for industry professionals, investors, and strategic decision-makers seeking to understand and capitalize on the opportunities within this dynamic market.
Semi-Trailer Industry Market Dynamics & Structure
The global semi-trailer market is characterized by moderate concentration, with a few large players holding significant market share. Technological innovation, particularly in areas like lightweight materials, aerodynamic design, and telematics, is a key driver. Stringent safety and emission regulations influence design and manufacturing processes. Substitute products, such as intermodal transportation, exert competitive pressure, although semi-trailers remain dominant for long-haul freight. The end-user base comprises diverse sectors like logistics, manufacturing, and retail. M&A activity has been moderate in recent years, with xx deals recorded in the historical period (2019-2024), contributing to market consolidation. The estimated market size in 2025 is xx million units.
- Market Concentration: Moderately concentrated, with top 5 players holding approximately xx% market share in 2025.
- Technological Innovation: Focus on lightweighting, aerodynamics, and telematics to improve fuel efficiency and operational efficiency.
- Regulatory Framework: Stringent safety and emission regulations drive innovation and compliance costs.
- Competitive Substitutes: Intermodal transportation poses a moderate threat, but semi-trailers maintain dominance for long-haul freight.
- End-User Demographics: Diverse end-user base including logistics, manufacturing, retail, and construction.
- M&A Trends: xx M&A deals recorded between 2019-2024, signifying consolidation and strategic growth among players.
- Innovation Barriers: High R&D costs and stringent regulatory compliance requirements present barriers to entry.
Semi-Trailer Industry Growth Trends & Insights
The global semi-trailer market experienced a Compound Annual Growth Rate (CAGR) of xx% during the historical period (2019-2024), driven by factors such as increasing global trade, e-commerce expansion, and infrastructure development. Market penetration is expected to remain high in developed economies, while emerging markets present significant growth opportunities. Technological advancements such as the adoption of autonomous driving technologies and improved telematics systems are disrupting the industry, leading to increased efficiency and reduced operational costs. Consumer behavior is shifting towards demand for sustainable and technologically advanced semi-trailers. The estimated market size in 2025 is projected to be xx million units, with a forecast CAGR of xx% during 2025-2033. The total market size in 2033 is estimated at xx million units.
Dominant Regions, Countries, or Segments in Semi-Trailer Industry
North America and Europe are currently the dominant regions, driven by robust logistics infrastructure, strong economic growth, and high demand from diverse sectors. Within vehicle types, dry vans constitute the largest segment, accounting for xx% of the market in 2025, followed by refrigerated trailers. The 25T-50T tonnage segment holds the largest market share, reflecting the dominant size of trucking fleets. Trailers in the 28-45 foot length segment also maintain a significant share. However, emerging markets in Asia and Latin America present substantial growth potential due to rapidly expanding economies and infrastructure development.
- Key Drivers:
- Robust logistics infrastructure in North America and Europe.
- Strong economic growth and industrial activity.
- High demand from e-commerce and retail sectors.
- Favorable government policies supporting infrastructure development.
- Dominant Segments:
- Dry Van (xx% market share in 2025)
- 25T-50T Tonnage Segment
- 28-45 Foot Length Segment
- Growth Potential:
- Emerging markets in Asia and Latin America offer significant growth opportunities.
Semi-Trailer Industry Product Landscape
The semi-trailer market features a range of products tailored to specific applications, reflecting technological advancements in materials, design, and functionalities. Lightweight materials like aluminum and high-strength steel improve fuel efficiency. Aerodynamic designs reduce drag and enhance fuel economy. Advanced telematics systems provide real-time tracking, maintenance alerts, and operational optimization. Unique selling propositions include specialized features for specific cargo types (e.g., refrigerated units for perishable goods) and enhanced safety features.
Key Drivers, Barriers & Challenges in Semi-Trailer Industry
Key Drivers: Growth in global trade, expansion of e-commerce, and infrastructure development are major drivers. Technological advancements in materials and telematics improve efficiency and reduce costs. Government policies promoting logistics infrastructure and sustainable transportation further enhance growth.
Challenges: Supply chain disruptions caused by material shortages and geopolitical events impact production and delivery timelines. Stringent emission regulations and fuel costs increase production and operating expenses. Intense competition among established manufacturers and the emergence of new players create competitive pressure. The estimated impact of these challenges on the market is a reduction of xx million units by 2033.
Emerging Opportunities in Semi-Trailer Industry
Emerging opportunities lie in the adoption of sustainable technologies (e.g., electric or alternative fuel semi-trailers), the integration of advanced telematics and IoT systems for enhanced fleet management, and the development of specialized trailers catering to niche market segments (e.g., oversized cargo transportation). Untapped markets in developing economies, particularly in Africa and parts of Asia, also present significant potential.
Growth Accelerators in the Semi-Trailer Industry
Long-term growth will be driven by technological breakthroughs in autonomous driving technologies, the adoption of lightweight and sustainable materials, and strategic partnerships between manufacturers and logistics companies. Expansion into emerging markets and the development of innovative solutions for specialized cargo transportation will further accelerate market growth.
Key Players Shaping the Semi-Trailer Industry Market
- Mac Trailer Manufacturing Inc
- Premier Trailer Mfg Inc
- Krone GmbH & Co KG
- Manac Inc
- Hyundai Translead
- Great Dane LLC
- Wabash National Corporation
- Schmitz Cargobull AG
- China International Marine Containers (Group) Ltd
- Pitts Trailers
- East Manufacturing Corporation
- Kentucky Trailer
Notable Milestones in Semi-Trailer Industry Sector
- 2021: Introduction of a new lightweight aluminum semi-trailer design by Wabash National Corporation.
- 2022: Acquisition of a smaller trailer manufacturer by Schmitz Cargobull AG, expanding its market share.
- 2023: Launch of a new line of electric semi-trailers by a major manufacturer (xx).
- 2024: Implementation of new emission regulations in Europe impacted trailer production.
In-Depth Semi-Trailer Industry Market Outlook
The future of the semi-trailer industry is bright, propelled by technological advancements, global trade expansion, and growing demand for efficient and sustainable transportation solutions. Strategic partnerships and investments in research and development will play crucial roles in driving innovation and expansion. The market is expected to witness sustained growth, with opportunities for both established players and new entrants. The development and adoption of alternative fuel technologies and autonomous driving systems will shape the industry's future landscape.
Semi-Trailer Industry Segmentation
-
1. Vehicle Type
- 1.1. Lowboy
- 1.2. Flatbed
- 1.3. Refrigerated
- 1.4. Dry Van
- 1.5. Other Vehicle Types
-
2. Tonnage
- 2.1. Below 25 T
- 2.2. 25 T-50 T
- 2.3. 51 T-100 T
- 2.4. Above 100 T
-
3. Foot Length
- 3.1. 28-45 Foot
- 3.2. Greater than 45 Foot
Semi-Trailer Industry Segmentation By Geography
-
1. North America
- 1.1. United States
- 1.2. Canada
- 1.3. Rest of North America
-
2. Europe
- 2.1. Germany
- 2.2. United Kingdom
- 2.3. France
- 2.4. Italy
- 2.5. Spain
- 2.6. Rest of Europe
-
3. Asia Pacific
- 3.1. China
- 3.2. Japan
- 3.3. India
- 3.4. South Korea
- 3.5. Rest of Asia Pacific
-
4. Rest of the World
- 4.1. South America
- 4.2. Middle East and Africa
Semi-Trailer Industry REPORT HIGHLIGHTS
| Aspects | Details |
|---|---|
| Study Period | 2019-2033 |
| Base Year | 2024 |
| Estimated Year | 2025 |
| Forecast Period | 2025-2033 |
| Historical Period | 2019-2024 |
| Growth Rate | CAGR of > 5.30% from 2019-2033 |
| Segmentation |
|
Table of Contents
- 1. Introduction
- 1.1. Research Scope
- 1.2. Market Segmentation
- 1.3. Research Methodology
- 1.4. Definitions and Assumptions
- 2. Executive Summary
- 2.1. Introduction
- 3. Market Dynamics
- 3.1. Introduction
- 3.2. Market Drivers
- 3.2.1. Rising Popularity of Sports Bike to Foster the Growth of the Market
- 3.3. Market Restrains
- 3.3.1. High Cost of Premium Helmets Deter Market Growth
- 3.4. Market Trends
- 3.4.1. The Augmenting European Logistics Sector
- 4. Market Factor Analysis
- 4.1. Porters Five Forces
- 4.2. Supply/Value Chain
- 4.3. PESTEL analysis
- 4.4. Market Entropy
- 4.5. Patent/Trademark Analysis
- 5. Global Semi-Trailer Industry Analysis, Insights and Forecast, 2019-2031
- 5.1. Market Analysis, Insights and Forecast - by Vehicle Type
- 5.1.1. Lowboy
- 5.1.2. Flatbed
- 5.1.3. Refrigerated
- 5.1.4. Dry Van
- 5.1.5. Other Vehicle Types
- 5.2. Market Analysis, Insights and Forecast - by Tonnage
- 5.2.1. Below 25 T
- 5.2.2. 25 T-50 T
- 5.2.3. 51 T-100 T
- 5.2.4. Above 100 T
- 5.3. Market Analysis, Insights and Forecast - by Foot Length
- 5.3.1. 28-45 Foot
- 5.3.2. Greater than 45 Foot
- 5.4. Market Analysis, Insights and Forecast - by Region
- 5.4.1. North America
- 5.4.2. Europe
- 5.4.3. Asia Pacific
- 5.4.4. Rest of the World
- 5.1. Market Analysis, Insights and Forecast - by Vehicle Type
- 6. North America Semi-Trailer Industry Analysis, Insights and Forecast, 2019-2031
- 6.1. Market Analysis, Insights and Forecast - by Vehicle Type
- 6.1.1. Lowboy
- 6.1.2. Flatbed
- 6.1.3. Refrigerated
- 6.1.4. Dry Van
- 6.1.5. Other Vehicle Types
- 6.2. Market Analysis, Insights and Forecast - by Tonnage
- 6.2.1. Below 25 T
- 6.2.2. 25 T-50 T
- 6.2.3. 51 T-100 T
- 6.2.4. Above 100 T
- 6.3. Market Analysis, Insights and Forecast - by Foot Length
- 6.3.1. 28-45 Foot
- 6.3.2. Greater than 45 Foot
- 6.1. Market Analysis, Insights and Forecast - by Vehicle Type
- 7. Europe Semi-Trailer Industry Analysis, Insights and Forecast, 2019-2031
- 7.1. Market Analysis, Insights and Forecast - by Vehicle Type
- 7.1.1. Lowboy
- 7.1.2. Flatbed
- 7.1.3. Refrigerated
- 7.1.4. Dry Van
- 7.1.5. Other Vehicle Types
- 7.2. Market Analysis, Insights and Forecast - by Tonnage
- 7.2.1. Below 25 T
- 7.2.2. 25 T-50 T
- 7.2.3. 51 T-100 T
- 7.2.4. Above 100 T
- 7.3. Market Analysis, Insights and Forecast - by Foot Length
- 7.3.1. 28-45 Foot
- 7.3.2. Greater than 45 Foot
- 7.1. Market Analysis, Insights and Forecast - by Vehicle Type
- 8. Asia Pacific Semi-Trailer Industry Analysis, Insights and Forecast, 2019-2031
- 8.1. Market Analysis, Insights and Forecast - by Vehicle Type
- 8.1.1. Lowboy
- 8.1.2. Flatbed
- 8.1.3. Refrigerated
- 8.1.4. Dry Van
- 8.1.5. Other Vehicle Types
- 8.2. Market Analysis, Insights and Forecast - by Tonnage
- 8.2.1. Below 25 T
- 8.2.2. 25 T-50 T
- 8.2.3. 51 T-100 T
- 8.2.4. Above 100 T
- 8.3. Market Analysis, Insights and Forecast - by Foot Length
- 8.3.1. 28-45 Foot
- 8.3.2. Greater than 45 Foot
- 8.1. Market Analysis, Insights and Forecast - by Vehicle Type
- 9. Rest of the World Semi-Trailer Industry Analysis, Insights and Forecast, 2019-2031
- 9.1. Market Analysis, Insights and Forecast - by Vehicle Type
- 9.1.1. Lowboy
- 9.1.2. Flatbed
- 9.1.3. Refrigerated
- 9.1.4. Dry Van
- 9.1.5. Other Vehicle Types
- 9.2. Market Analysis, Insights and Forecast - by Tonnage
- 9.2.1. Below 25 T
- 9.2.2. 25 T-50 T
- 9.2.3. 51 T-100 T
- 9.2.4. Above 100 T
- 9.3. Market Analysis, Insights and Forecast - by Foot Length
- 9.3.1. 28-45 Foot
- 9.3.2. Greater than 45 Foot
- 9.1. Market Analysis, Insights and Forecast - by Vehicle Type
- 10. North America Semi-Trailer Industry Analysis, Insights and Forecast, 2019-2031
- 10.1. Market Analysis, Insights and Forecast - By Country/Sub-region
- 10.1.1 United States
- 10.1.2 Canada
- 10.1.3 Rest of North America
- 11. Europe Semi-Trailer Industry Analysis, Insights and Forecast, 2019-2031
- 11.1. Market Analysis, Insights and Forecast - By Country/Sub-region
- 11.1.1 Germany
- 11.1.2 United Kingdom
- 11.1.3 France
- 11.1.4 Italy
- 11.1.5 Spain
- 11.1.6 Rest of Europe
- 12. Asia Pacific Semi-Trailer Industry Analysis, Insights and Forecast, 2019-2031
- 12.1. Market Analysis, Insights and Forecast - By Country/Sub-region
- 12.1.1 China
- 12.1.2 Japan
- 12.1.3 India
- 12.1.4 South Korea
- 12.1.5 Rest of Asia Pacific
- 13. Rest of the World Semi-Trailer Industry Analysis, Insights and Forecast, 2019-2031
- 13.1. Market Analysis, Insights and Forecast - By Country/Sub-region
- 13.1.1 South America
- 13.1.2 Middle East and Africa
- 14. Competitive Analysis
- 14.1. Global Market Share Analysis 2024
- 14.2. Company Profiles
- 14.2.1 Mac Trailer Manufacturing Inc
- 14.2.1.1. Overview
- 14.2.1.2. Products
- 14.2.1.3. SWOT Analysis
- 14.2.1.4. Recent Developments
- 14.2.1.5. Financials (Based on Availability)
- 14.2.2 Premier Trailer Mfg Inc
- 14.2.2.1. Overview
- 14.2.2.2. Products
- 14.2.2.3. SWOT Analysis
- 14.2.2.4. Recent Developments
- 14.2.2.5. Financials (Based on Availability)
- 14.2.3 Krone GmbH & Co K
- 14.2.3.1. Overview
- 14.2.3.2. Products
- 14.2.3.3. SWOT Analysis
- 14.2.3.4. Recent Developments
- 14.2.3.5. Financials (Based on Availability)
- 14.2.4 Manac Inc
- 14.2.4.1. Overview
- 14.2.4.2. Products
- 14.2.4.3. SWOT Analysis
- 14.2.4.4. Recent Developments
- 14.2.4.5. Financials (Based on Availability)
- 14.2.5 Hyundai Translead
- 14.2.5.1. Overview
- 14.2.5.2. Products
- 14.2.5.3. SWOT Analysis
- 14.2.5.4. Recent Developments
- 14.2.5.5. Financials (Based on Availability)
- 14.2.6 Great Dane LLC
- 14.2.6.1. Overview
- 14.2.6.2. Products
- 14.2.6.3. SWOT Analysis
- 14.2.6.4. Recent Developments
- 14.2.6.5. Financials (Based on Availability)
- 14.2.7 Wabash National Corporation
- 14.2.7.1. Overview
- 14.2.7.2. Products
- 14.2.7.3. SWOT Analysis
- 14.2.7.4. Recent Developments
- 14.2.7.5. Financials (Based on Availability)
- 14.2.8 Schmitz Cargobull AG
- 14.2.8.1. Overview
- 14.2.8.2. Products
- 14.2.8.3. SWOT Analysis
- 14.2.8.4. Recent Developments
- 14.2.8.5. Financials (Based on Availability)
- 14.2.9 China International Marine Containers (Group) Ltd
- 14.2.9.1. Overview
- 14.2.9.2. Products
- 14.2.9.3. SWOT Analysis
- 14.2.9.4. Recent Developments
- 14.2.9.5. Financials (Based on Availability)
- 14.2.10 Pitts Trailers
- 14.2.10.1. Overview
- 14.2.10.2. Products
- 14.2.10.3. SWOT Analysis
- 14.2.10.4. Recent Developments
- 14.2.10.5. Financials (Based on Availability)
- 14.2.11 East Manufacturing Corporation
- 14.2.11.1. Overview
- 14.2.11.2. Products
- 14.2.11.3. SWOT Analysis
- 14.2.11.4. Recent Developments
- 14.2.11.5. Financials (Based on Availability)
- 14.2.12 Kentucky Trailer
- 14.2.12.1. Overview
- 14.2.12.2. Products
- 14.2.12.3. SWOT Analysis
- 14.2.12.4. Recent Developments
- 14.2.12.5. Financials (Based on Availability)
- 14.2.1 Mac Trailer Manufacturing Inc
List of Figures
- Figure 1: Global Semi-Trailer Industry Revenue Breakdown (Million, %) by Region 2024 & 2032
- Figure 2: North America Semi-Trailer Industry Revenue (Million), by Country 2024 & 2032
- Figure 3: North America Semi-Trailer Industry Revenue Share (%), by Country 2024 & 2032
- Figure 4: Europe Semi-Trailer Industry Revenue (Million), by Country 2024 & 2032
- Figure 5: Europe Semi-Trailer Industry Revenue Share (%), by Country 2024 & 2032
- Figure 6: Asia Pacific Semi-Trailer Industry Revenue (Million), by Country 2024 & 2032
- Figure 7: Asia Pacific Semi-Trailer Industry Revenue Share (%), by Country 2024 & 2032
- Figure 8: Rest of the World Semi-Trailer Industry Revenue (Million), by Country 2024 & 2032
- Figure 9: Rest of the World Semi-Trailer Industry Revenue Share (%), by Country 2024 & 2032
- Figure 10: North America Semi-Trailer Industry Revenue (Million), by Vehicle Type 2024 & 2032
- Figure 11: North America Semi-Trailer Industry Revenue Share (%), by Vehicle Type 2024 & 2032
- Figure 12: North America Semi-Trailer Industry Revenue (Million), by Tonnage 2024 & 2032
- Figure 13: North America Semi-Trailer Industry Revenue Share (%), by Tonnage 2024 & 2032
- Figure 14: North America Semi-Trailer Industry Revenue (Million), by Foot Length 2024 & 2032
- Figure 15: North America Semi-Trailer Industry Revenue Share (%), by Foot Length 2024 & 2032
- Figure 16: North America Semi-Trailer Industry Revenue (Million), by Country 2024 & 2032
- Figure 17: North America Semi-Trailer Industry Revenue Share (%), by Country 2024 & 2032
- Figure 18: Europe Semi-Trailer Industry Revenue (Million), by Vehicle Type 2024 & 2032
- Figure 19: Europe Semi-Trailer Industry Revenue Share (%), by Vehicle Type 2024 & 2032
- Figure 20: Europe Semi-Trailer Industry Revenue (Million), by Tonnage 2024 & 2032
- Figure 21: Europe Semi-Trailer Industry Revenue Share (%), by Tonnage 2024 & 2032
- Figure 22: Europe Semi-Trailer Industry Revenue (Million), by Foot Length 2024 & 2032
- Figure 23: Europe Semi-Trailer Industry Revenue Share (%), by Foot Length 2024 & 2032
- Figure 24: Europe Semi-Trailer Industry Revenue (Million), by Country 2024 & 2032
- Figure 25: Europe Semi-Trailer Industry Revenue Share (%), by Country 2024 & 2032
- Figure 26: Asia Pacific Semi-Trailer Industry Revenue (Million), by Vehicle Type 2024 & 2032
- Figure 27: Asia Pacific Semi-Trailer Industry Revenue Share (%), by Vehicle Type 2024 & 2032
- Figure 28: Asia Pacific Semi-Trailer Industry Revenue (Million), by Tonnage 2024 & 2032
- Figure 29: Asia Pacific Semi-Trailer Industry Revenue Share (%), by Tonnage 2024 & 2032
- Figure 30: Asia Pacific Semi-Trailer Industry Revenue (Million), by Foot Length 2024 & 2032
- Figure 31: Asia Pacific Semi-Trailer Industry Revenue Share (%), by Foot Length 2024 & 2032
- Figure 32: Asia Pacific Semi-Trailer Industry Revenue (Million), by Country 2024 & 2032
- Figure 33: Asia Pacific Semi-Trailer Industry Revenue Share (%), by Country 2024 & 2032
- Figure 34: Rest of the World Semi-Trailer Industry Revenue (Million), by Vehicle Type 2024 & 2032
- Figure 35: Rest of the World Semi-Trailer Industry Revenue Share (%), by Vehicle Type 2024 & 2032
- Figure 36: Rest of the World Semi-Trailer Industry Revenue (Million), by Tonnage 2024 & 2032
- Figure 37: Rest of the World Semi-Trailer Industry Revenue Share (%), by Tonnage 2024 & 2032
- Figure 38: Rest of the World Semi-Trailer Industry Revenue (Million), by Foot Length 2024 & 2032
- Figure 39: Rest of the World Semi-Trailer Industry Revenue Share (%), by Foot Length 2024 & 2032
- Figure 40: Rest of the World Semi-Trailer Industry Revenue (Million), by Country 2024 & 2032
- Figure 41: Rest of the World Semi-Trailer Industry Revenue Share (%), by Country 2024 & 2032
List of Tables
- Table 1: Global Semi-Trailer Industry Revenue Million Forecast, by Region 2019 & 2032
- Table 2: Global Semi-Trailer Industry Revenue Million Forecast, by Vehicle Type 2019 & 2032
- Table 3: Global Semi-Trailer Industry Revenue Million Forecast, by Tonnage 2019 & 2032
- Table 4: Global Semi-Trailer Industry Revenue Million Forecast, by Foot Length 2019 & 2032
- Table 5: Global Semi-Trailer Industry Revenue Million Forecast, by Region 2019 & 2032
- Table 6: Global Semi-Trailer Industry Revenue Million Forecast, by Country 2019 & 2032
- Table 7: United States Semi-Trailer Industry Revenue (Million) Forecast, by Application 2019 & 2032
- Table 8: Canada Semi-Trailer Industry Revenue (Million) Forecast, by Application 2019 & 2032
- Table 9: Rest of North America Semi-Trailer Industry Revenue (Million) Forecast, by Application 2019 & 2032
- Table 10: Global Semi-Trailer Industry Revenue Million Forecast, by Country 2019 & 2032
- Table 11: Germany Semi-Trailer Industry Revenue (Million) Forecast, by Application 2019 & 2032
- Table 12: United Kingdom Semi-Trailer Industry Revenue (Million) Forecast, by Application 2019 & 2032
- Table 13: France Semi-Trailer Industry Revenue (Million) Forecast, by Application 2019 & 2032
- Table 14: Italy Semi-Trailer Industry Revenue (Million) Forecast, by Application 2019 & 2032
- Table 15: Spain Semi-Trailer Industry Revenue (Million) Forecast, by Application 2019 & 2032
- Table 16: Rest of Europe Semi-Trailer Industry Revenue (Million) Forecast, by Application 2019 & 2032
- Table 17: Global Semi-Trailer Industry Revenue Million Forecast, by Country 2019 & 2032
- Table 18: China Semi-Trailer Industry Revenue (Million) Forecast, by Application 2019 & 2032
- Table 19: Japan Semi-Trailer Industry Revenue (Million) Forecast, by Application 2019 & 2032
- Table 20: India Semi-Trailer Industry Revenue (Million) Forecast, by Application 2019 & 2032
- Table 21: South Korea Semi-Trailer Industry Revenue (Million) Forecast, by Application 2019 & 2032
- Table 22: Rest of Asia Pacific Semi-Trailer Industry Revenue (Million) Forecast, by Application 2019 & 2032
- Table 23: Global Semi-Trailer Industry Revenue Million Forecast, by Country 2019 & 2032
- Table 24: South America Semi-Trailer Industry Revenue (Million) Forecast, by Application 2019 & 2032
- Table 25: Middle East and Africa Semi-Trailer Industry Revenue (Million) Forecast, by Application 2019 & 2032
- Table 26: Global Semi-Trailer Industry Revenue Million Forecast, by Vehicle Type 2019 & 2032
- Table 27: Global Semi-Trailer Industry Revenue Million Forecast, by Tonnage 2019 & 2032
- Table 28: Global Semi-Trailer Industry Revenue Million Forecast, by Foot Length 2019 & 2032
- Table 29: Global Semi-Trailer Industry Revenue Million Forecast, by Country 2019 & 2032
- Table 30: United States Semi-Trailer Industry Revenue (Million) Forecast, by Application 2019 & 2032
- Table 31: Canada Semi-Trailer Industry Revenue (Million) Forecast, by Application 2019 & 2032
- Table 32: Rest of North America Semi-Trailer Industry Revenue (Million) Forecast, by Application 2019 & 2032
- Table 33: Global Semi-Trailer Industry Revenue Million Forecast, by Vehicle Type 2019 & 2032
- Table 34: Global Semi-Trailer Industry Revenue Million Forecast, by Tonnage 2019 & 2032
- Table 35: Global Semi-Trailer Industry Revenue Million Forecast, by Foot Length 2019 & 2032
- Table 36: Global Semi-Trailer Industry Revenue Million Forecast, by Country 2019 & 2032
- Table 37: Germany Semi-Trailer Industry Revenue (Million) Forecast, by Application 2019 & 2032
- Table 38: United Kingdom Semi-Trailer Industry Revenue (Million) Forecast, by Application 2019 & 2032
- Table 39: France Semi-Trailer Industry Revenue (Million) Forecast, by Application 2019 & 2032
- Table 40: Italy Semi-Trailer Industry Revenue (Million) Forecast, by Application 2019 & 2032
- Table 41: Spain Semi-Trailer Industry Revenue (Million) Forecast, by Application 2019 & 2032
- Table 42: Rest of Europe Semi-Trailer Industry Revenue (Million) Forecast, by Application 2019 & 2032
- Table 43: Global Semi-Trailer Industry Revenue Million Forecast, by Vehicle Type 2019 & 2032
- Table 44: Global Semi-Trailer Industry Revenue Million Forecast, by Tonnage 2019 & 2032
- Table 45: Global Semi-Trailer Industry Revenue Million Forecast, by Foot Length 2019 & 2032
- Table 46: Global Semi-Trailer Industry Revenue Million Forecast, by Country 2019 & 2032
- Table 47: China Semi-Trailer Industry Revenue (Million) Forecast, by Application 2019 & 2032
- Table 48: Japan Semi-Trailer Industry Revenue (Million) Forecast, by Application 2019 & 2032
- Table 49: India Semi-Trailer Industry Revenue (Million) Forecast, by Application 2019 & 2032
- Table 50: South Korea Semi-Trailer Industry Revenue (Million) Forecast, by Application 2019 & 2032
- Table 51: Rest of Asia Pacific Semi-Trailer Industry Revenue (Million) Forecast, by Application 2019 & 2032
- Table 52: Global Semi-Trailer Industry Revenue Million Forecast, by Vehicle Type 2019 & 2032
- Table 53: Global Semi-Trailer Industry Revenue Million Forecast, by Tonnage 2019 & 2032
- Table 54: Global Semi-Trailer Industry Revenue Million Forecast, by Foot Length 2019 & 2032
- Table 55: Global Semi-Trailer Industry Revenue Million Forecast, by Country 2019 & 2032
- Table 56: South America Semi-Trailer Industry Revenue (Million) Forecast, by Application 2019 & 2032
- Table 57: Middle East and Africa Semi-Trailer Industry Revenue (Million) Forecast, by Application 2019 & 2032
Frequently Asked Questions
1. What is the projected Compound Annual Growth Rate (CAGR) of the Semi-Trailer Industry?
The projected CAGR is approximately > 5.30%.
2. Which companies are prominent players in the Semi-Trailer Industry?
Key companies in the market include Mac Trailer Manufacturing Inc, Premier Trailer Mfg Inc, Krone GmbH & Co K, Manac Inc, Hyundai Translead, Great Dane LLC, Wabash National Corporation, Schmitz Cargobull AG, China International Marine Containers (Group) Ltd, Pitts Trailers, East Manufacturing Corporation, Kentucky Trailer.
3. What are the main segments of the Semi-Trailer Industry?
The market segments include Vehicle Type, Tonnage, Foot Length.
4. Can you provide details about the market size?
The market size is estimated to be USD XX Million as of 2022.
5. What are some drivers contributing to market growth?
Rising Popularity of Sports Bike to Foster the Growth of the Market.
6. What are the notable trends driving market growth?
The Augmenting European Logistics Sector.
7. Are there any restraints impacting market growth?
High Cost of Premium Helmets Deter Market Growth.
8. Can you provide examples of recent developments in the market?
N/A
9. What pricing options are available for accessing the report?
Pricing options include single-user, multi-user, and enterprise licenses priced at USD 4750, USD 5250, and USD 8750 respectively.
10. Is the market size provided in terms of value or volume?
The market size is provided in terms of value, measured in Million.
11. Are there any specific market keywords associated with the report?
Yes, the market keyword associated with the report is "Semi-Trailer Industry," which aids in identifying and referencing the specific market segment covered.
12. How do I determine which pricing option suits my needs best?
The pricing options vary based on user requirements and access needs. Individual users may opt for single-user licenses, while businesses requiring broader access may choose multi-user or enterprise licenses for cost-effective access to the report.
13. Are there any additional resources or data provided in the Semi-Trailer Industry report?
While the report offers comprehensive insights, it's advisable to review the specific contents or supplementary materials provided to ascertain if additional resources or data are available.
14. How can I stay updated on further developments or reports in the Semi-Trailer Industry?
To stay informed about further developments, trends, and reports in the Semi-Trailer Industry, consider subscribing to industry newsletters, following relevant companies and organizations, or regularly checking reputable industry news sources and publications.
Methodology
Step 1 - Identification of Relevant Samples Size from Population Database


Step 2 - Approaches for Defining Global Market Size (Value, Volume* & Price*)

Note*: In applicable scenarios
Step 3 - Data Sources
Primary Research
- Web Analytics
- Survey Reports
- Research Institute
- Latest Research Reports
- Opinion Leaders
Secondary Research
- Annual Reports
- White Paper
- Latest Press Release
- Industry Association
- Paid Database
- Investor Presentations

Step 4 - Data Triangulation
Involves using different sources of information in order to increase the validity of a study
These sources are likely to be stakeholders in a program - participants, other researchers, program staff, other community members, and so on.
Then we put all data in single framework & apply various statistical tools to find out the dynamic on the market.
During the analysis stage, feedback from the stakeholder groups would be compared to determine areas of agreement as well as areas of divergence
