

Key Insights
The Smart Manufacturing Industry Market is undergoing a profound transformation, charting a path of significant expansion. Globally, the market was estimated at $141.39 Million in 2023, and it is poised for remarkable growth, projecting a robust Compound Annual Growth Rate (CAGR) of 14.58% from 2023 to 2030. This trajectory is expected to elevate the market's valuation to approximately $374.96 Million by the close of the forecast period. The primary impetus for this vigorous expansion stems from the escalating demand for advanced automation solutions designed to achieve unparalleled levels of operational efficiency and product quality. Concurrently, a heightened global emphasis on regulatory compliance and substantial government backing for digitalization initiatives across various industrial sectors are acting as powerful market accelerators. The widespread proliferation of the Internet of Things (IoT) is a foundational macro tailwind, enabling seamless connectivity and real-time data exchange, which are critical for the intelligent orchestration of manufacturing processes. This paradigm shift, often encapsulated as Industry 4.0, is transforming traditional factories into smart, interconnected ecosystems capable of self-optimization and adaptive production. Companies are aggressively pursuing investments in sophisticated technologies to not only streamline operations and reduce costs but also to enhance agility and responsiveness to dynamic market demands. The inherent benefits, such as predictive maintenance capabilities, improved resource utilization, and personalized production, underscore the compelling value proposition of smart manufacturing adoption. However, the industry grapples with notable restraints. Paramount among these are growing concerns regarding data security, particularly as more operational technology (OT) converges with information technology (IT) networks, creating larger attack surfaces. Furthermore, the significant initial installation costs associated with sophisticated smart manufacturing infrastructure and the persistent lack of a sufficiently skilled workforce equipped to manage these complex systems are deterring full-scale adoption in some segments. Despite these challenges, the overarching imperative for digital transformation, coupled with the strategic advantages of resilient and efficient supply chains, continues to propel market growth. Key industry participants, including Siemens AG, Rockwell Automation Inc, and ABB Ltd, are strategically positioned, offering expansive portfolios that integrate hardware, cutting-edge Industrial Software Market solutions, and expert services tailored to the intricate needs of contemporary manufacturing. The continuous integration of disruptive technologies like artificial intelligence (AI), machine learning (ML), and advanced robotics is perpetually redefining operational benchmarks, forecasting a future characterized by highly adaptive, efficient, and sustainable production environments. This dynamic environment further bolsters the broader Industrial Automation Market. Such advancements are crucial for sectors like the Discrete Manufacturing Market and Process Manufacturing Market, where precision and efficiency are paramount. The sustained evolution of these technologies also promises significant opportunities within the rapidly expanding Industrial Internet of Things Market and the burgeoning Industrial Robotics Market, both pivotal enablers of next-generation smart factories. The Smart Manufacturing Industry Market's robust growth trajectory reflects a global commitment to leveraging technology for superior industrial outcomes.
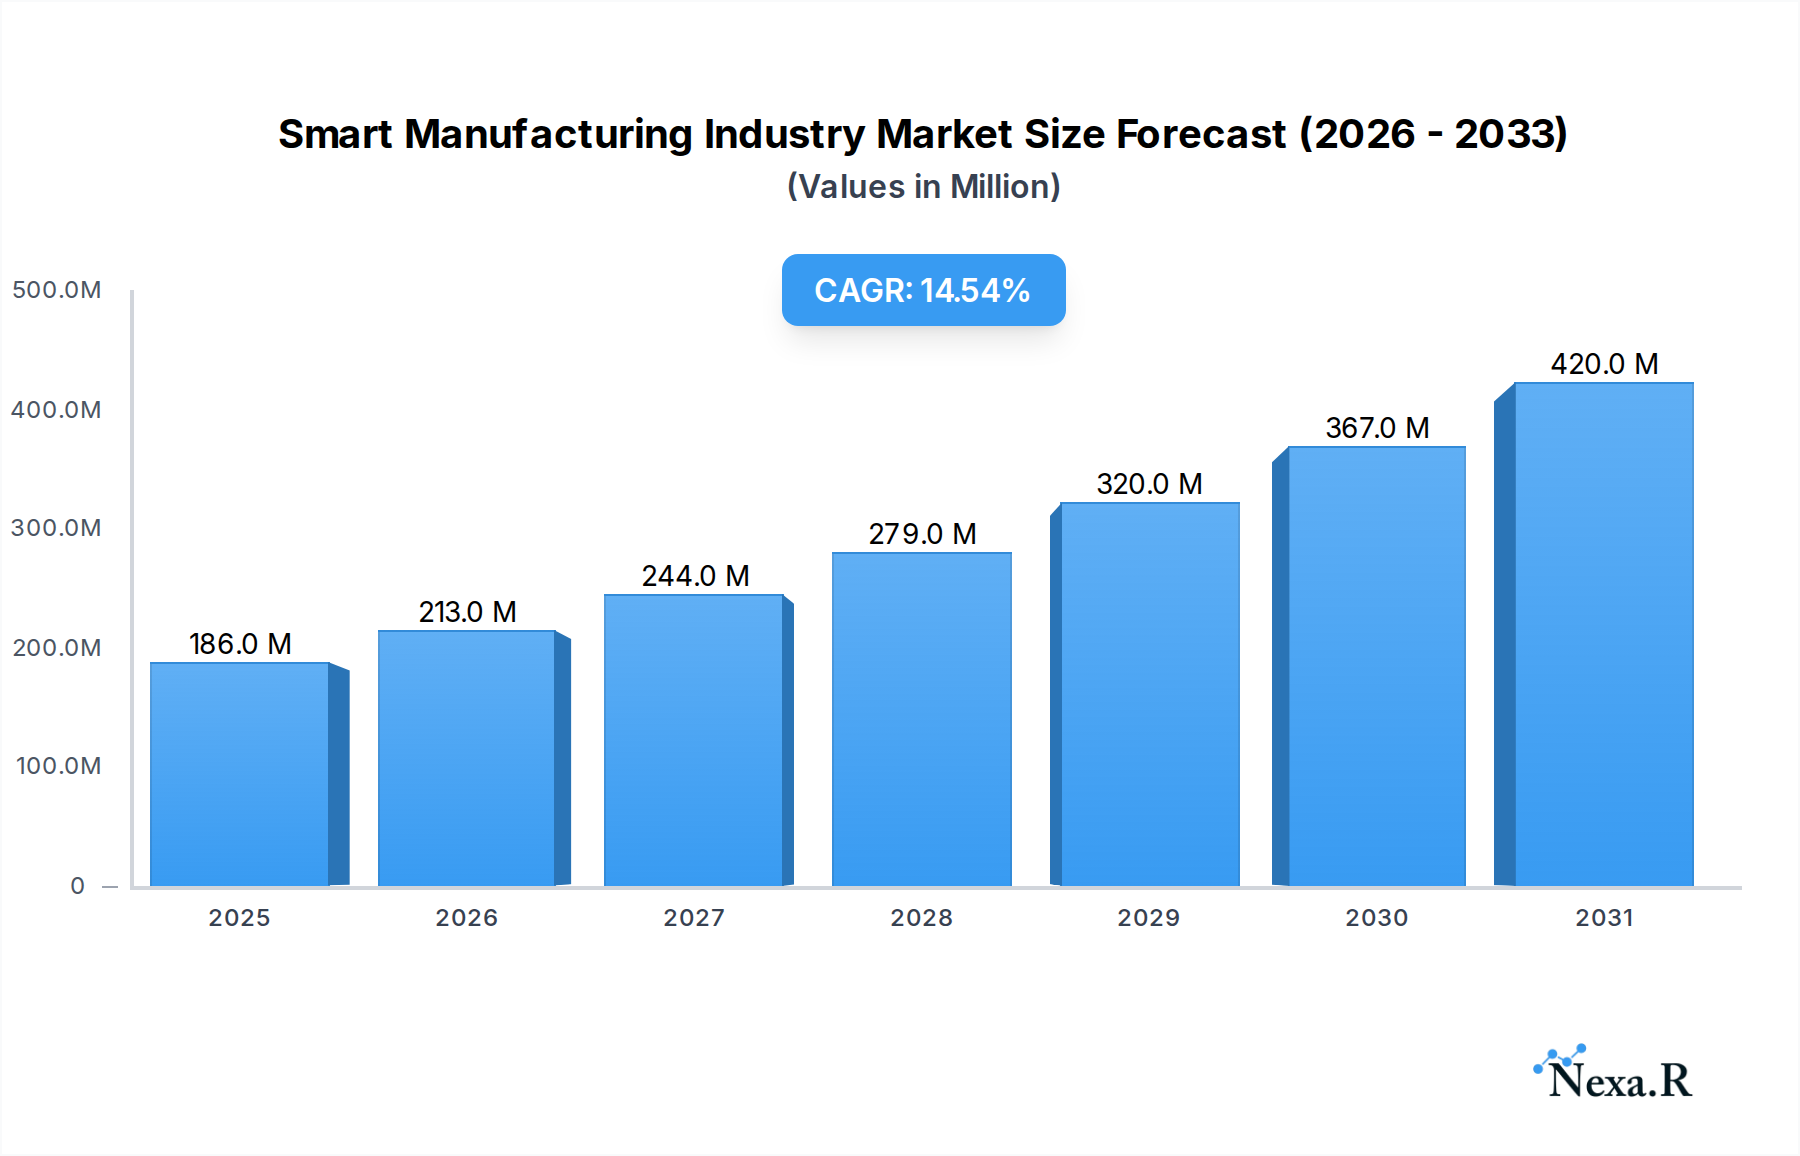
Smart Manufacturing Industry Market Size (In Million)
Component Segment Dominance in Smart Manufacturing Industry
The "Component" segment stands out as a dominant force within the Smart Manufacturing Industry Market, underpinning the foundational technological infrastructure that enables intelligent manufacturing operations. This segment, encompassing hardware, software, and services, collectively commands a substantial revenue share due to its indispensable role in the design, deployment, and maintenance of smart factories. The inherent complexity and specialized nature of smart manufacturing solutions necessitate a robust and integrated component ecosystem. Within this segment, the Industrial Software Market and specialized services sub-segments are particularly influential, exhibiting significant growth and consolidation. Industrial software, ranging from Manufacturing Execution Systems (MES) and Enterprise Resource Planning (ERP) to Supervisory Control and Data Acquisition (SCADA) systems and advanced analytics platforms, acts as the central nervous system for smart factories. These software solutions facilitate real-time data collection, analysis, and decision-making, optimizing production workflows, enhancing quality control, and enabling predictive maintenance. The demand for highly customized and integrated software solutions drives substantial investment and innovation in this area. Furthermore, the burgeoning Advanced Analytics Market plays a critical role here, as manufacturers seek deeper insights from the vast datasets generated by interconnected machines and processes. Leading players like Siemens AG, Rockwell Automation Inc, and General Electric Company, among others, invest heavily in developing proprietary software suites and platforms that offer comprehensive control and visibility across the manufacturing value chain. Their offerings often include specialized modules for energy management, production planning, and quality assurance, which are critical for achieving smart manufacturing objectives. The services sub-segment complements this dominance by providing essential support throughout the lifecycle of smart manufacturing deployments. This includes consulting, system integration, implementation, maintenance, and training services. Given the complexity of integrating diverse technologies—from sensors and actuators (hardware) to intricate software algorithms and cloud platforms—expert services are crucial for successful adoption and optimal performance. Companies such as ABB Ltd and Schneider Electric SE provide extensive service portfolios, ensuring seamless integration of new systems with existing infrastructure and ongoing operational support. The dominance of the Component segment is further reinforced by the constant need for upgrades and enhancements to keep pace with rapid technological advancements and evolving cybersecurity threats. Manufacturers frequently require software updates, hardware replacements, and continuous service support to maintain operational efficiency and security. This recurring demand contributes to sustained revenue streams and market growth for component providers. The increasing sophistication of the Industrial Internet of Things Market, for instance, directly drives the demand for more advanced sensors (hardware), robust connectivity software, and data processing services, solidifying the Component segment's leading position. While hardware components like sensors, controllers, and robotics constitute a significant initial investment, their true value is unlocked and maintained through sophisticated software and ongoing services. This integrated approach ensures that the "Component" segment not only dominates in terms of initial revenue share but also maintains a growing and consolidating position through continuous innovation and comprehensive support. The importance of the Component segment is underscored by innovations such as the enhanced cloud-based Manufacturing Execution System (MES) announced by General Electric Company, which exemplifies the criticality of advanced software in the broader Smart Manufacturing Industry Market. This segment's growth is also intrinsically linked to the expansion of the Industrial Robotics Market, as robust software is required to program, control, and integrate robotic systems into smart factory environments.

Smart Manufacturing Industry Company Market Share
Key Market Drivers and Restraints in Smart Manufacturing Industry
The Smart Manufacturing Industry Market's trajectory is significantly influenced by a blend of potent drivers and notable restraints, shaping its adoption and investment landscape. A primary driver is the Increasing Demand for Automation to Achieve Efficiency and Quality. This imperative is reflected in the industry's projected 14.58% Compound Annual Growth Rate (CAGR) from 2023 to 2030, evidencing a strong market response to automation's promise. Manufacturers are aggressively pursuing solutions to minimize operational costs, reduce waste, and enhance product consistency. For instance, advanced automation can lead to up to a 30% reduction in production cycle times, directly contributing to greater throughput and profitability.
Another crucial driver is the Need for Compliance and Government Support for Digitization. Global initiatives, such as Germany’s Industry 4.0, provide regulatory frameworks and financial incentives that encourage manufacturers to invest in smart technologies. These programs, including tax credits for R&D and digital infrastructure subsidies, significantly lower adoption barriers for enterprises within the Smart Manufacturing Industry Market.
The Proliferation of Internet of Things (IoT) is a pivotal technological catalyst. The widespread deployment of IoT sensors enables real-time data collection and analysis, forming the core of predictive maintenance and remote operations. Industrial IoT connections are growing rapidly, generating vast data volumes that empower intelligent decision-making, thereby fueling the Industrial Internet of Things Market and its integral role in smart manufacturing.
Conversely, significant restraints temper growth. Concerns Regarding Data Security are paramount. As manufacturing systems increasingly rely on interconnected and cloud-based platforms, they face heightened vulnerability to cyber threats. A 2023 report noted a 15% increase in attacks targeting industrial control systems, highlighting severe risks like operational disruption and intellectual property theft. The complexity of securing these extensive networks often deters full embrace of smart technologies.
Finally, High Initial Installation Costs and Lack of Skilled Workforce present substantial barriers. Implementing comprehensive smart manufacturing solutions requires significant capital expenditure for hardware, software, and integration, posing a challenge, especially for Small & Medium Enterprises (SMEs). Simultaneously, the specialized skills in data analytics and industrial automation required to manage these systems are scarce. A 2024 study indicated over 60% of manufacturing companies struggle to find employees with these critical skills, directly impeding the pace of adoption within the broader Industrial Automation Market.
Competitive Ecosystem of Smart Manufacturing Industry
The Smart Manufacturing Industry Market is characterized by a dynamic competitive landscape featuring a blend of established industrial conglomerates and specialized technology providers. These companies vie for market share by offering diverse solutions spanning industrial automation, software, IoT platforms, and advisory services, catering to a broad spectrum of end-user industries such as the Automotive Manufacturing Market and Pharmaceuticals and Biotechnology Market.
- Honeywell International Inc: A diversified technology and manufacturing company providing industrial automation solutions, control systems, and software, focusing on enhancing operational efficiency and cybersecurity for various industrial processes.
- ABB Ltd: A leader in robotics, power, heavy electrical equipment, and automation technology, offering integrated solutions for digital industries, factory automation, and industrial IoT platforms.
- Mitsubishi Electric Corporation: A global manufacturer specializing in factory automation, industrial machinery, and energy systems, known for its comprehensive range of programmable logic controllers, drives, and industrial robots.
- Siemens AG: A prominent technology company with a strong focus on industrial automation, digitalization, and electrification, providing comprehensive software solutions like PLM and MES, along with control systems and industrial components.
- Schneider Electric SE: A global specialist in energy management and automation, delivering integrated efficiency solutions across diverse markets, including industrial automation, power management, and software for smart factories.
- Fanuc Corporation: A leading global manufacturer of factory automation products, specializing in CNC systems, robots, and RoboMachines, playing a critical role in the deployment of advanced manufacturing capabilities.
- Robert Bosch GmbH: A multinational engineering and technology company offering a broad portfolio for industrial technology, including drive and control technology, and a strong presence in IoT solutions for connected manufacturing.
- Texas Instruments Incorporated: A global semiconductor design and manufacturing company, providing essential analog and embedded processing products that are fundamental components for smart manufacturing systems and industrial IoT devices.
- Rockwell Automation Inc: The world's largest company dedicated to industrial automation and information, delivering a comprehensive suite of hardware, software, and services to help manufacturers improve productivity and sustainability.
- Yokogawa Electric Corporation: A Japanese multinational electrical engineering and software company, specializing in industrial automation and control, test and measurement, and information systems for process industries.
- General Electric Company: A diversified industrial giant with a significant presence in smart manufacturing through its digital solutions, including advanced cloud-based Manufacturing Execution System (MES) software and industrial IoT platforms like Predix.
- Emerson Electric Company: A global technology and engineering company providing innovative solutions for customers in industrial, commercial, and residential markets, with a strong focus on automation solutions for process and hybrid industries.
Recent Developments & Milestones in Smart Manufacturing Industry
The Smart Manufacturing Industry Market has been marked by strategic investments, technological enhancements, and collaborative partnerships, reflecting a dynamic drive towards advanced industrial digitalization. These developments underscore the industry's commitment to integrating IT and OT, improving operational efficiency, and expanding digital capabilities.
- December 2023: TeamViewer announced strategic investments in two pioneering companies focused on smart factory solutions: Sight Machine and Cybus. This initiative significantly strengthens TeamViewer's dedication to digitalizing industrial workplaces and fostering the crucial merger of IT and OT domains. These investments are set to position TeamViewer as a leading provider of enterprise software, adept at linking manufacturing infrastructure, IT systems, and advanced data analytics, thereby enhancing the offerings within the Industrial Software Market.
- February 2023: General Electric Company unveiled new enhancements to its cloud-based Manufacturing Execution System (MES). The improved cloud-based MES software provides cost-effective and highly configurable solutions for Overall Equipment Effectiveness (OEE), production management, and quality control, catering to manufacturers of all sizes. This advancement enables discrete, process, and mixed environment manufacturers to significantly reduce costs and maintenance requirements while simultaneously increasing security through a comprehensive cloud MES solution, further solidifying the potential of the Cloud-based Manufacturing Execution System Market.
- July 2022: ABB and SKF entered into a Memorandum of Understanding (MoU) to explore collaborative opportunities in the automation of manufacturing processes. This partnership aims to evaluate and identify innovative solutions designed to improve manufacturing capabilities and support clients in achieving increased production efficiency, directly impacting advancements across the Industrial Automation Market.
Regional Market Breakdown for Smart Manufacturing Industry
The global Smart Manufacturing Industry Market exhibits distinct regional dynamics, shaped by varying industrialization levels, technological adoption rates, and governmental support. While specific regional CAGR and revenue shares are not provided, analysis suggests clear trends.
Asia Pacific is projected to be the fastest-growing and potentially largest market in terms of adoption and revenue. This growth is fueled by rapid industrialization, expanding manufacturing bases, and robust government initiatives, particularly in China, India, and Japan. These nations are heavily investing in smart factory solutions to boost global competitiveness, with significant impact on the Discrete Manufacturing Market and Process Manufacturing Market. The region's thriving electronics, automotive, and semiconductor industries are primary end-users, driving substantial demand for smart solutions.
North America commands a significant market share, characterized by early adoption of advanced technologies, strong R&D, and innovation. The United States and Canada lead in implementing complex automation, IoT, and AI-driven solutions across industries like aerospace & defense and pharmaceuticals. Its mature industrial base contributes to a stable yet substantial market presence. The robust Automotive Manufacturing Market here is a key adopter of smart technologies.
Europe represents a mature market, emphasizing high-quality and precision manufacturing, especially in Germany, the United Kingdom, and France. The "Industry 4.0" initiative, originating from Germany, has set a global benchmark for smart manufacturing, promoting sophisticated IT/OT integration. European manufacturers invest in smart solutions for competitive advantage, sustainability, and adherence to stringent regulations, particularly within the Industrial Equipment Market. The region is also a significant adopter of solutions within the Industrial Robotics Market.
Latin America and Middle East and Africa are emerging markets. They show considerable growth potential as industrialization accelerates and governments prioritize economic diversification and technological modernization. Countries like Brazil, Mexico, and nations in the Middle East are increasing investments in cost-effective, scalable smart solutions to upgrade existing infrastructures and build efficient new facilities, especially in metals & mining and energy & power sectors.
Ultimately, Asia Pacific drives volume and growth momentum, while North America and Europe lead in innovation and high-value applications, collectively advancing the global Smart Manufacturing Industry Market.
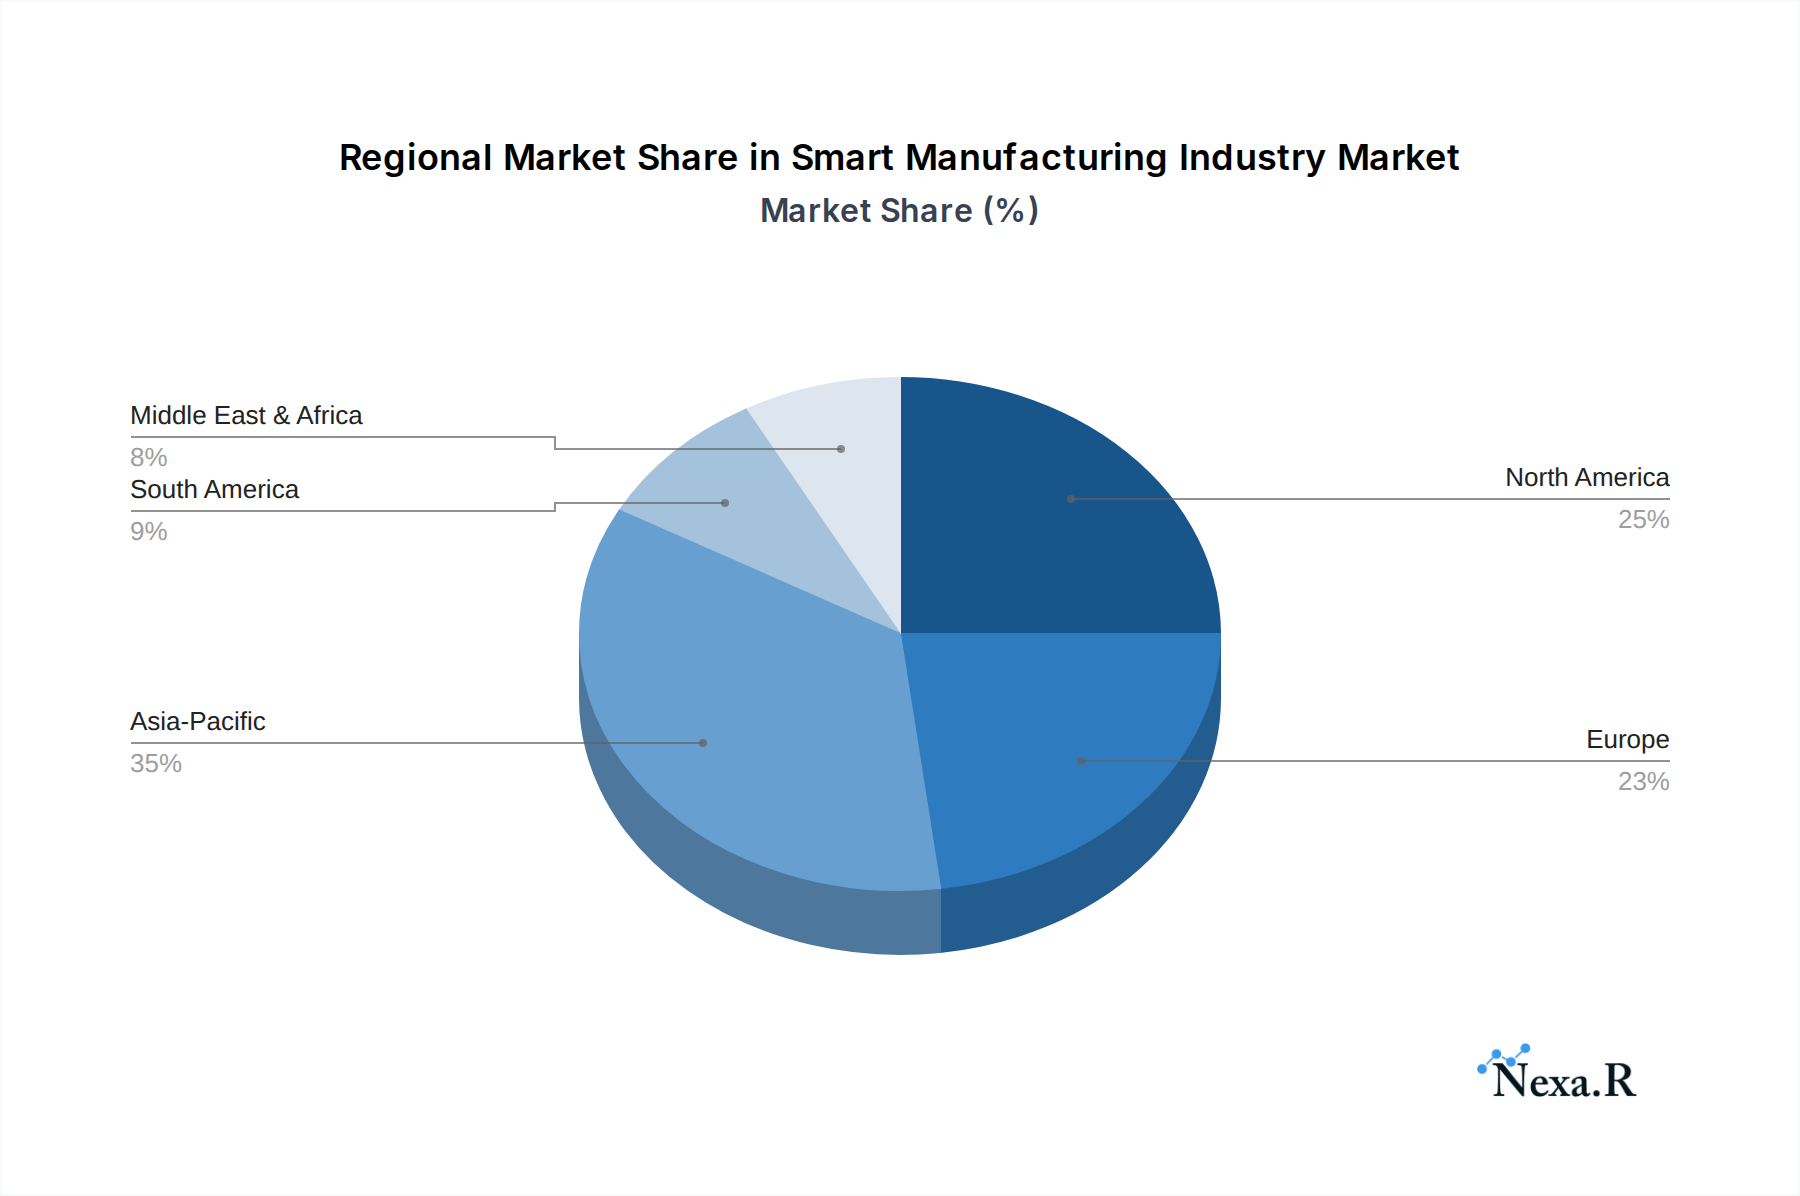
Smart Manufacturing Industry Regional Market Share
Technology Innovation Trajectory in Smart Manufacturing Industry
The Smart Manufacturing Industry Market is profoundly shaped by continuous technological innovation, with several emerging technologies poised to revolutionize production. These innovations enhance autonomy, predictive capabilities, and efficiency, often challenging traditional models while creating new opportunities.
Artificial Intelligence (AI) and Machine Learning (ML) are paramount. These technologies facilitate predictive maintenance, quality control, process optimization, and autonomous decision-making by analyzing vast datasets from factory sensors. AI/ML algorithms identify anomalies, forecast equipment failures, and optimize production schedules, reducing human intervention. Adoption timelines are accelerating with substantial R&D investments from industrial leaders. This advancement significantly impacts the Advanced Analytics Market, converting raw data into actionable insights. Incumbent reactive maintenance models are increasingly challenged by AI-driven predictive approaches, offering substantial cost savings and improved uptime.
Digital Twins represent another transformative technology: virtual replicas of physical assets, processes, or systems, updated in real-time. This allows continuous monitoring, "what-if" scenario simulation, and predictive analysis without affecting physical operations. Adoption is prevalent in high-value sectors like aerospace and automotive, with broader manufacturing integration expected within 3-5 years. R&D focuses on sophisticated, multi-domain digital twins and their seamless integration with existing Industrial Software Market platforms. This technology reinforces current models by providing unparalleled operational visibility and optimization, while also fostering new service markets for specialized simulation.
Edge Computing is crucial for smart manufacturing, bringing data processing closer to the source on the factory floor. This reduces latency, conserves bandwidth, and enhances data security for time-sensitive applications such as robotic control and real-time quality inspection. Its adoption is vital for scaling Industrial Internet of Things (IIoT) deployments, especially where connectivity is intermittent or immediate processing is critical. R&D focuses on robust edge devices and secure data gateways. This technology reinforces decentralized intelligence, supporting the growth of the Industrial Internet of Things Market by making deployments more practical and efficient, particularly for operations within the Discrete Manufacturing Market.
Pricing Dynamics & Margin Pressure in Smart Manufacturing Industry
Pricing dynamics within the Smart Manufacturing Industry Market are multifaceted, shaped by technological advancements, competitive intensity, and the value of integrated solutions. Average Selling Price (ASP) trends vary, with hardware and software/services facing distinct pressures.
Hardware components—sensors, controllers, basic robotic units—often experience margin pressure due to increasing commoditization and fierce global competition. As technology matures, manufacturing costs decline, leading to downward ASP trends for standard components. However, specialized hardware with unique features for harsh industrial environments can still command premium pricing. The Industrial Robotics Market, for example, is highly competitive, driving continuous innovation at aggressive price points.
In contrast, the Industrial Software Market and related services typically exhibit higher margin structures. This is attributed to embedded intellectual property, extensive customization requirements for specific industrial applications, and the ongoing value from data analytics, predictive capabilities, and system integration. Software licenses, cloud-based platform subscriptions, and bespoke integration services command higher ASPs and are less prone to commoditization. Solutions within the Advanced Analytics Market and specialized digital transformation consulting are similarly high-margin offerings, reflecting their expertise and tangible benefits.
Key cost levers in the Smart Manufacturing Industry involve significant Research and Development (R&D) investments to remain competitive in evolving technologies (AI/ML, IoT), the high cost of attracting and retaining a skilled workforce for complex system deployment and management, and substantial expenditure on robust cybersecurity measures.
Competitive intensity is high, with both industrial giants and agile startups vying for market share. While this pressure can drive down prices for standard solutions in greenfield projects, providers offering complex integration with legacy systems in brownfield sites often maintain greater pricing power. The growing demand for integrated solutions, such as offerings within the Cloud-based Manufacturing Execution System Market, enables vendors to bundle software and services, potentially increasing overall deal value while delivering perceived cost efficiencies to customers. Overall, despite margin erosion in hardware, the high-value software and service segments offer resilience and growth opportunities, fundamentally defining the evolving pricing landscape of the Smart Manufacturing Industry Market.
Smart Manufacturing Industry Segmentation
-
1. Component
- 1.1. Hardware
- 1.2. Software
- 1.3. Services
-
2. Manufacturing Process
- 2.1. Discrete Manufacturing
- 2.2. Process Manufacturing
- 2.3. Process Manufacturing
-
3. Enterprise Size
- 3.1. Large Enterprises
- 3.2. Small & Medium Enterprises (SMEs)
-
4. End User Industry
- 4.1. Automotive
- 4.2. Electronics & Semiconductors
- 4.3. Machinery & Industrial Equipment
- 4.4. Aerospace & Defense
- 4.5. Chemicals & Petrochemicals
- 4.6. Pharmaceuticals & Biotechnology
- 4.7. Pharmaceuticals & Biotechnology
- 4.8. Food & Beverage
- 4.9. Metals & Mining
- 4.10. Energy & Power
- 4.11. Textiles & Apparel
- 4.12. Consumer Goods
- 4.13. Others
Smart Manufacturing Industry Segmentation By Geography
-
1. North America
- 1.1. United States
- 1.2. Canada
-
2. Europe
- 2.1. Germany
- 2.2. United Kingdom
- 2.3. France
- 2.4. Rest of Europe
-
3. Asia Pacific
- 3.1. China
- 3.2. India
- 3.3. Japan
- 3.4. Rest of Asia Pacific
-
4. Latin America
- 4.1. Brazil
- 4.2. Mexico
- 4.3. Rest of Latin America
- 5. Middle East and Africa
Smart Manufacturing Industry Regional Market Share
Geographic Coverage of Smart Manufacturing Industry
Smart Manufacturing Industry REPORT HIGHLIGHTS
| Aspects | Details |
|---|---|
| Study Period | 2020-2034 |
| Base Year | 2025 |
| Estimated Year | 2026 |
| Forecast Period | 2026-2034 |
| Historical Period | 2020-2025 |
| Growth Rate | CAGR of 14.58% from 2020-2034 |
| Segmentation |
|
Table of Contents
- 1. Introduction
- 1.1. Research Scope
- 1.2. Market Segmentation
- 1.3. Research Objective
- 1.4. Definitions and Assumptions
- 2. Executive Summary
- 2.1. Market Snapshot
- 3. Market Dynamics
- 3.1. Market Drivers
- 3.2. Market Restrains
- 3.3. Market Trends
- 3.4. Market Opportunities
- 4. Market Factor Analysis
- 4.1. Porters Five Forces
- 4.1.1. Bargaining Power of Suppliers
- 4.1.2. Bargaining Power of Buyers
- 4.1.3. Threat of New Entrants
- 4.1.4. Threat of Substitutes
- 4.1.5. Competitive Rivalry
- 4.2. PESTEL analysis
- 4.3. BCG Analysis
- 4.3.1. Stars (High Growth, High Market Share)
- 4.3.2. Cash Cows (Low Growth, High Market Share)
- 4.3.3. Question Mark (High Growth, Low Market Share)
- 4.3.4. Dogs (Low Growth, Low Market Share)
- 4.4. Ansoff Matrix Analysis
- 4.5. Supply Chain Analysis
- 4.6. Regulatory Landscape
- 4.7. Current Market Potential and Opportunity Assessment (TAM–SAM–SOM Framework)
- 4.8. NRP Analyst Note
- 4.1. Porters Five Forces
- 5. Market Analysis, Insights and Forecast 2021-2033
- 5.1. Market Analysis, Insights and Forecast - by Component
- 5.1.1. Hardware
- 5.1.2. Software
- 5.1.3. Services
- 5.2. Market Analysis, Insights and Forecast - by Manufacturing Process
- 5.2.1. Discrete Manufacturing
- 5.2.2. Process Manufacturing
- 5.2.3. Process Manufacturing
- 5.3. Market Analysis, Insights and Forecast - by Enterprise Size
- 5.3.1. Large Enterprises
- 5.3.2. Small & Medium Enterprises (SMEs)
- 5.4. Market Analysis, Insights and Forecast - by End User Industry
- 5.4.1. Automotive
- 5.4.2. Electronics & Semiconductors
- 5.4.3. Machinery & Industrial Equipment
- 5.4.4. Aerospace & Defense
- 5.4.5. Chemicals & Petrochemicals
- 5.4.6. Pharmaceuticals & Biotechnology
- 5.4.7. Pharmaceuticals & Biotechnology
- 5.4.8. Food & Beverage
- 5.4.9. Metals & Mining
- 5.4.10. Energy & Power
- 5.4.11. Textiles & Apparel
- 5.4.12. Consumer Goods
- 5.4.13. Others
- 5.5. Market Analysis, Insights and Forecast - by Region
- 5.5.1. North America
- 5.5.2. Europe
- 5.5.3. Asia Pacific
- 5.5.4. Latin America
- 5.5.5. Middle East and Africa
- 5.1. Market Analysis, Insights and Forecast - by Component
- 6. Global Smart Manufacturing Industry Analysis, Insights and Forecast, 2021-2033
- 6.1. Market Analysis, Insights and Forecast - by Component
- 6.1.1. Hardware
- 6.1.2. Software
- 6.1.3. Services
- 6.2. Market Analysis, Insights and Forecast - by Manufacturing Process
- 6.2.1. Discrete Manufacturing
- 6.2.2. Process Manufacturing
- 6.2.3. Process Manufacturing
- 6.3. Market Analysis, Insights and Forecast - by Enterprise Size
- 6.3.1. Large Enterprises
- 6.3.2. Small & Medium Enterprises (SMEs)
- 6.4. Market Analysis, Insights and Forecast - by End User Industry
- 6.4.1. Automotive
- 6.4.2. Electronics & Semiconductors
- 6.4.3. Machinery & Industrial Equipment
- 6.4.4. Aerospace & Defense
- 6.4.5. Chemicals & Petrochemicals
- 6.4.6. Pharmaceuticals & Biotechnology
- 6.4.7. Pharmaceuticals & Biotechnology
- 6.4.8. Food & Beverage
- 6.4.9. Metals & Mining
- 6.4.10. Energy & Power
- 6.4.11. Textiles & Apparel
- 6.4.12. Consumer Goods
- 6.4.13. Others
- 6.1. Market Analysis, Insights and Forecast - by Component
- 7. North America Smart Manufacturing Industry Analysis, Insights and Forecast, 2020-2032
- 7.1. Market Analysis, Insights and Forecast - by Component
- 7.1.1. Hardware
- 7.1.2. Software
- 7.1.3. Services
- 7.2. Market Analysis, Insights and Forecast - by Manufacturing Process
- 7.2.1. Discrete Manufacturing
- 7.2.2. Process Manufacturing
- 7.2.3. Process Manufacturing
- 7.3. Market Analysis, Insights and Forecast - by Enterprise Size
- 7.3.1. Large Enterprises
- 7.3.2. Small & Medium Enterprises (SMEs)
- 7.4. Market Analysis, Insights and Forecast - by End User Industry
- 7.4.1. Automotive
- 7.4.2. Electronics & Semiconductors
- 7.4.3. Machinery & Industrial Equipment
- 7.4.4. Aerospace & Defense
- 7.4.5. Chemicals & Petrochemicals
- 7.4.6. Pharmaceuticals & Biotechnology
- 7.4.7. Pharmaceuticals & Biotechnology
- 7.4.8. Food & Beverage
- 7.4.9. Metals & Mining
- 7.4.10. Energy & Power
- 7.4.11. Textiles & Apparel
- 7.4.12. Consumer Goods
- 7.4.13. Others
- 7.1. Market Analysis, Insights and Forecast - by Component
- 8. Europe Smart Manufacturing Industry Analysis, Insights and Forecast, 2020-2032
- 8.1. Market Analysis, Insights and Forecast - by Component
- 8.1.1. Hardware
- 8.1.2. Software
- 8.1.3. Services
- 8.2. Market Analysis, Insights and Forecast - by Manufacturing Process
- 8.2.1. Discrete Manufacturing
- 8.2.2. Process Manufacturing
- 8.2.3. Process Manufacturing
- 8.3. Market Analysis, Insights and Forecast - by Enterprise Size
- 8.3.1. Large Enterprises
- 8.3.2. Small & Medium Enterprises (SMEs)
- 8.4. Market Analysis, Insights and Forecast - by End User Industry
- 8.4.1. Automotive
- 8.4.2. Electronics & Semiconductors
- 8.4.3. Machinery & Industrial Equipment
- 8.4.4. Aerospace & Defense
- 8.4.5. Chemicals & Petrochemicals
- 8.4.6. Pharmaceuticals & Biotechnology
- 8.4.7. Pharmaceuticals & Biotechnology
- 8.4.8. Food & Beverage
- 8.4.9. Metals & Mining
- 8.4.10. Energy & Power
- 8.4.11. Textiles & Apparel
- 8.4.12. Consumer Goods
- 8.4.13. Others
- 8.1. Market Analysis, Insights and Forecast - by Component
- 9. Asia Pacific Smart Manufacturing Industry Analysis, Insights and Forecast, 2020-2032
- 9.1. Market Analysis, Insights and Forecast - by Component
- 9.1.1. Hardware
- 9.1.2. Software
- 9.1.3. Services
- 9.2. Market Analysis, Insights and Forecast - by Manufacturing Process
- 9.2.1. Discrete Manufacturing
- 9.2.2. Process Manufacturing
- 9.2.3. Process Manufacturing
- 9.3. Market Analysis, Insights and Forecast - by Enterprise Size
- 9.3.1. Large Enterprises
- 9.3.2. Small & Medium Enterprises (SMEs)
- 9.4. Market Analysis, Insights and Forecast - by End User Industry
- 9.4.1. Automotive
- 9.4.2. Electronics & Semiconductors
- 9.4.3. Machinery & Industrial Equipment
- 9.4.4. Aerospace & Defense
- 9.4.5. Chemicals & Petrochemicals
- 9.4.6. Pharmaceuticals & Biotechnology
- 9.4.7. Pharmaceuticals & Biotechnology
- 9.4.8. Food & Beverage
- 9.4.9. Metals & Mining
- 9.4.10. Energy & Power
- 9.4.11. Textiles & Apparel
- 9.4.12. Consumer Goods
- 9.4.13. Others
- 9.1. Market Analysis, Insights and Forecast - by Component
- 10. Latin America Smart Manufacturing Industry Analysis, Insights and Forecast, 2020-2032
- 10.1. Market Analysis, Insights and Forecast - by Component
- 10.1.1. Hardware
- 10.1.2. Software
- 10.1.3. Services
- 10.2. Market Analysis, Insights and Forecast - by Manufacturing Process
- 10.2.1. Discrete Manufacturing
- 10.2.2. Process Manufacturing
- 10.2.3. Process Manufacturing
- 10.3. Market Analysis, Insights and Forecast - by Enterprise Size
- 10.3.1. Large Enterprises
- 10.3.2. Small & Medium Enterprises (SMEs)
- 10.4. Market Analysis, Insights and Forecast - by End User Industry
- 10.4.1. Automotive
- 10.4.2. Electronics & Semiconductors
- 10.4.3. Machinery & Industrial Equipment
- 10.4.4. Aerospace & Defense
- 10.4.5. Chemicals & Petrochemicals
- 10.4.6. Pharmaceuticals & Biotechnology
- 10.4.7. Pharmaceuticals & Biotechnology
- 10.4.8. Food & Beverage
- 10.4.9. Metals & Mining
- 10.4.10. Energy & Power
- 10.4.11. Textiles & Apparel
- 10.4.12. Consumer Goods
- 10.4.13. Others
- 10.1. Market Analysis, Insights and Forecast - by Component
- 11. Middle East and Africa Smart Manufacturing Industry Analysis, Insights and Forecast, 2020-2032
- 11.1. Market Analysis, Insights and Forecast - by Component
- 11.1.1. Hardware
- 11.1.2. Software
- 11.1.3. Services
- 11.2. Market Analysis, Insights and Forecast - by Manufacturing Process
- 11.2.1. Discrete Manufacturing
- 11.2.2. Process Manufacturing
- 11.2.3. Process Manufacturing
- 11.3. Market Analysis, Insights and Forecast - by Enterprise Size
- 11.3.1. Large Enterprises
- 11.3.2. Small & Medium Enterprises (SMEs)
- 11.4. Market Analysis, Insights and Forecast - by End User Industry
- 11.4.1. Automotive
- 11.4.2. Electronics & Semiconductors
- 11.4.3. Machinery & Industrial Equipment
- 11.4.4. Aerospace & Defense
- 11.4.5. Chemicals & Petrochemicals
- 11.4.6. Pharmaceuticals & Biotechnology
- 11.4.7. Pharmaceuticals & Biotechnology
- 11.4.8. Food & Beverage
- 11.4.9. Metals & Mining
- 11.4.10. Energy & Power
- 11.4.11. Textiles & Apparel
- 11.4.12. Consumer Goods
- 11.4.13. Others
- 11.1. Market Analysis, Insights and Forecast - by Component
- 12. Competitive Analysis
- 12.1. Company Profiles
- 12.1.1 Honeywell International Inc
- 12.1.1.1. Company Overview
- 12.1.1.2. Products
- 12.1.1.3. Company Financials
- 12.1.1.4. SWOT Analysis
- 12.1.2 ABB Ltd
- 12.1.2.1. Company Overview
- 12.1.2.2. Products
- 12.1.2.3. Company Financials
- 12.1.2.4. SWOT Analysis
- 12.1.3 Mitsubishi Electric Corporation
- 12.1.3.1. Company Overview
- 12.1.3.2. Products
- 12.1.3.3. Company Financials
- 12.1.3.4. SWOT Analysis
- 12.1.4 Siemens AG
- 12.1.4.1. Company Overview
- 12.1.4.2. Products
- 12.1.4.3. Company Financials
- 12.1.4.4. SWOT Analysis
- 12.1.5 Schneider Electric SE
- 12.1.5.1. Company Overview
- 12.1.5.2. Products
- 12.1.5.3. Company Financials
- 12.1.5.4. SWOT Analysis
- 12.1.6 Fanuc Corporation
- 12.1.6.1. Company Overview
- 12.1.6.2. Products
- 12.1.6.3. Company Financials
- 12.1.6.4. SWOT Analysis
- 12.1.7 Robert Bosch GmbH
- 12.1.7.1. Company Overview
- 12.1.7.2. Products
- 12.1.7.3. Company Financials
- 12.1.7.4. SWOT Analysis
- 12.1.8 Texas Instruments Incorporated
- 12.1.8.1. Company Overview
- 12.1.8.2. Products
- 12.1.8.3. Company Financials
- 12.1.8.4. SWOT Analysis
- 12.1.9 Rockwell Automation Inc
- 12.1.9.1. Company Overview
- 12.1.9.2. Products
- 12.1.9.3. Company Financials
- 12.1.9.4. SWOT Analysis
- 12.1.10 Yokogawa Electric Corporation
- 12.1.10.1. Company Overview
- 12.1.10.2. Products
- 12.1.10.3. Company Financials
- 12.1.10.4. SWOT Analysis
- 12.1.11 General Electric Company
- 12.1.11.1. Company Overview
- 12.1.11.2. Products
- 12.1.11.3. Company Financials
- 12.1.11.4. SWOT Analysis
- 12.1.12 Emerson Electric Company
- 12.1.12.1. Company Overview
- 12.1.12.2. Products
- 12.1.12.3. Company Financials
- 12.1.12.4. SWOT Analysis
- 12.1.1 Honeywell International Inc
- 12.2. Market Entropy
- 12.2.1 Company's Key Areas Served
- 12.2.2 Recent Developments
- 12.3. Company Market Share Analysis 2025
- 12.3.1 Top 5 Companies Market Share Analysis
- 12.3.2 Top 3 Companies Market Share Analysis
- 12.4. List of Potential Customers
- 13. Research Methodology
List of Figures
- Figure 1: Global Smart Manufacturing Industry Revenue Breakdown (Million, %) by Region 2025 & 2033
- Figure 2: North America Smart Manufacturing Industry Revenue (Million), by Component 2025 & 2033
- Figure 3: North America Smart Manufacturing Industry Revenue Share (%), by Component 2025 & 2033
- Figure 4: North America Smart Manufacturing Industry Revenue (Million), by Manufacturing Process 2025 & 2033
- Figure 5: North America Smart Manufacturing Industry Revenue Share (%), by Manufacturing Process 2025 & 2033
- Figure 6: North America Smart Manufacturing Industry Revenue (Million), by Enterprise Size 2025 & 2033
- Figure 7: North America Smart Manufacturing Industry Revenue Share (%), by Enterprise Size 2025 & 2033
- Figure 8: North America Smart Manufacturing Industry Revenue (Million), by End User Industry 2025 & 2033
- Figure 9: North America Smart Manufacturing Industry Revenue Share (%), by End User Industry 2025 & 2033
- Figure 10: North America Smart Manufacturing Industry Revenue (Million), by Country 2025 & 2033
- Figure 11: North America Smart Manufacturing Industry Revenue Share (%), by Country 2025 & 2033
- Figure 12: Europe Smart Manufacturing Industry Revenue (Million), by Component 2025 & 2033
- Figure 13: Europe Smart Manufacturing Industry Revenue Share (%), by Component 2025 & 2033
- Figure 14: Europe Smart Manufacturing Industry Revenue (Million), by Manufacturing Process 2025 & 2033
- Figure 15: Europe Smart Manufacturing Industry Revenue Share (%), by Manufacturing Process 2025 & 2033
- Figure 16: Europe Smart Manufacturing Industry Revenue (Million), by Enterprise Size 2025 & 2033
- Figure 17: Europe Smart Manufacturing Industry Revenue Share (%), by Enterprise Size 2025 & 2033
- Figure 18: Europe Smart Manufacturing Industry Revenue (Million), by End User Industry 2025 & 2033
- Figure 19: Europe Smart Manufacturing Industry Revenue Share (%), by End User Industry 2025 & 2033
- Figure 20: Europe Smart Manufacturing Industry Revenue (Million), by Country 2025 & 2033
- Figure 21: Europe Smart Manufacturing Industry Revenue Share (%), by Country 2025 & 2033
- Figure 22: Asia Pacific Smart Manufacturing Industry Revenue (Million), by Component 2025 & 2033
- Figure 23: Asia Pacific Smart Manufacturing Industry Revenue Share (%), by Component 2025 & 2033
- Figure 24: Asia Pacific Smart Manufacturing Industry Revenue (Million), by Manufacturing Process 2025 & 2033
- Figure 25: Asia Pacific Smart Manufacturing Industry Revenue Share (%), by Manufacturing Process 2025 & 2033
- Figure 26: Asia Pacific Smart Manufacturing Industry Revenue (Million), by Enterprise Size 2025 & 2033
- Figure 27: Asia Pacific Smart Manufacturing Industry Revenue Share (%), by Enterprise Size 2025 & 2033
- Figure 28: Asia Pacific Smart Manufacturing Industry Revenue (Million), by End User Industry 2025 & 2033
- Figure 29: Asia Pacific Smart Manufacturing Industry Revenue Share (%), by End User Industry 2025 & 2033
- Figure 30: Asia Pacific Smart Manufacturing Industry Revenue (Million), by Country 2025 & 2033
- Figure 31: Asia Pacific Smart Manufacturing Industry Revenue Share (%), by Country 2025 & 2033
- Figure 32: Latin America Smart Manufacturing Industry Revenue (Million), by Component 2025 & 2033
- Figure 33: Latin America Smart Manufacturing Industry Revenue Share (%), by Component 2025 & 2033
- Figure 34: Latin America Smart Manufacturing Industry Revenue (Million), by Manufacturing Process 2025 & 2033
- Figure 35: Latin America Smart Manufacturing Industry Revenue Share (%), by Manufacturing Process 2025 & 2033
- Figure 36: Latin America Smart Manufacturing Industry Revenue (Million), by Enterprise Size 2025 & 2033
- Figure 37: Latin America Smart Manufacturing Industry Revenue Share (%), by Enterprise Size 2025 & 2033
- Figure 38: Latin America Smart Manufacturing Industry Revenue (Million), by End User Industry 2025 & 2033
- Figure 39: Latin America Smart Manufacturing Industry Revenue Share (%), by End User Industry 2025 & 2033
- Figure 40: Latin America Smart Manufacturing Industry Revenue (Million), by Country 2025 & 2033
- Figure 41: Latin America Smart Manufacturing Industry Revenue Share (%), by Country 2025 & 2033
- Figure 42: Middle East and Africa Smart Manufacturing Industry Revenue (Million), by Component 2025 & 2033
- Figure 43: Middle East and Africa Smart Manufacturing Industry Revenue Share (%), by Component 2025 & 2033
- Figure 44: Middle East and Africa Smart Manufacturing Industry Revenue (Million), by Manufacturing Process 2025 & 2033
- Figure 45: Middle East and Africa Smart Manufacturing Industry Revenue Share (%), by Manufacturing Process 2025 & 2033
- Figure 46: Middle East and Africa Smart Manufacturing Industry Revenue (Million), by Enterprise Size 2025 & 2033
- Figure 47: Middle East and Africa Smart Manufacturing Industry Revenue Share (%), by Enterprise Size 2025 & 2033
- Figure 48: Middle East and Africa Smart Manufacturing Industry Revenue (Million), by End User Industry 2025 & 2033
- Figure 49: Middle East and Africa Smart Manufacturing Industry Revenue Share (%), by End User Industry 2025 & 2033
- Figure 50: Middle East and Africa Smart Manufacturing Industry Revenue (Million), by Country 2025 & 2033
- Figure 51: Middle East and Africa Smart Manufacturing Industry Revenue Share (%), by Country 2025 & 2033
List of Tables
- Table 1: Global Smart Manufacturing Industry Revenue Million Forecast, by Component 2020 & 2033
- Table 2: Global Smart Manufacturing Industry Revenue Million Forecast, by Manufacturing Process 2020 & 2033
- Table 3: Global Smart Manufacturing Industry Revenue Million Forecast, by Enterprise Size 2020 & 2033
- Table 4: Global Smart Manufacturing Industry Revenue Million Forecast, by End User Industry 2020 & 2033
- Table 5: Global Smart Manufacturing Industry Revenue Million Forecast, by Region 2020 & 2033
- Table 6: Global Smart Manufacturing Industry Revenue Million Forecast, by Component 2020 & 2033
- Table 7: Global Smart Manufacturing Industry Revenue Million Forecast, by Manufacturing Process 2020 & 2033
- Table 8: Global Smart Manufacturing Industry Revenue Million Forecast, by Enterprise Size 2020 & 2033
- Table 9: Global Smart Manufacturing Industry Revenue Million Forecast, by End User Industry 2020 & 2033
- Table 10: Global Smart Manufacturing Industry Revenue Million Forecast, by Country 2020 & 2033
- Table 11: United States Smart Manufacturing Industry Revenue (Million) Forecast, by Application 2020 & 2033
- Table 12: Canada Smart Manufacturing Industry Revenue (Million) Forecast, by Application 2020 & 2033
- Table 13: Global Smart Manufacturing Industry Revenue Million Forecast, by Component 2020 & 2033
- Table 14: Global Smart Manufacturing Industry Revenue Million Forecast, by Manufacturing Process 2020 & 2033
- Table 15: Global Smart Manufacturing Industry Revenue Million Forecast, by Enterprise Size 2020 & 2033
- Table 16: Global Smart Manufacturing Industry Revenue Million Forecast, by End User Industry 2020 & 2033
- Table 17: Global Smart Manufacturing Industry Revenue Million Forecast, by Country 2020 & 2033
- Table 18: Germany Smart Manufacturing Industry Revenue (Million) Forecast, by Application 2020 & 2033
- Table 19: United Kingdom Smart Manufacturing Industry Revenue (Million) Forecast, by Application 2020 & 2033
- Table 20: France Smart Manufacturing Industry Revenue (Million) Forecast, by Application 2020 & 2033
- Table 21: Rest of Europe Smart Manufacturing Industry Revenue (Million) Forecast, by Application 2020 & 2033
- Table 22: Global Smart Manufacturing Industry Revenue Million Forecast, by Component 2020 & 2033
- Table 23: Global Smart Manufacturing Industry Revenue Million Forecast, by Manufacturing Process 2020 & 2033
- Table 24: Global Smart Manufacturing Industry Revenue Million Forecast, by Enterprise Size 2020 & 2033
- Table 25: Global Smart Manufacturing Industry Revenue Million Forecast, by End User Industry 2020 & 2033
- Table 26: Global Smart Manufacturing Industry Revenue Million Forecast, by Country 2020 & 2033
- Table 27: China Smart Manufacturing Industry Revenue (Million) Forecast, by Application 2020 & 2033
- Table 28: India Smart Manufacturing Industry Revenue (Million) Forecast, by Application 2020 & 2033
- Table 29: Japan Smart Manufacturing Industry Revenue (Million) Forecast, by Application 2020 & 2033
- Table 30: Rest of Asia Pacific Smart Manufacturing Industry Revenue (Million) Forecast, by Application 2020 & 2033
- Table 31: Global Smart Manufacturing Industry Revenue Million Forecast, by Component 2020 & 2033
- Table 32: Global Smart Manufacturing Industry Revenue Million Forecast, by Manufacturing Process 2020 & 2033
- Table 33: Global Smart Manufacturing Industry Revenue Million Forecast, by Enterprise Size 2020 & 2033
- Table 34: Global Smart Manufacturing Industry Revenue Million Forecast, by End User Industry 2020 & 2033
- Table 35: Global Smart Manufacturing Industry Revenue Million Forecast, by Country 2020 & 2033
- Table 36: Brazil Smart Manufacturing Industry Revenue (Million) Forecast, by Application 2020 & 2033
- Table 37: Mexico Smart Manufacturing Industry Revenue (Million) Forecast, by Application 2020 & 2033
- Table 38: Rest of Latin America Smart Manufacturing Industry Revenue (Million) Forecast, by Application 2020 & 2033
- Table 39: Global Smart Manufacturing Industry Revenue Million Forecast, by Component 2020 & 2033
- Table 40: Global Smart Manufacturing Industry Revenue Million Forecast, by Manufacturing Process 2020 & 2033
- Table 41: Global Smart Manufacturing Industry Revenue Million Forecast, by Enterprise Size 2020 & 2033
- Table 42: Global Smart Manufacturing Industry Revenue Million Forecast, by End User Industry 2020 & 2033
- Table 43: Global Smart Manufacturing Industry Revenue Million Forecast, by Country 2020 & 2033
Frequently Asked Questions
1. What is the projected Compound Annual Growth Rate (CAGR) of the Smart Manufacturing Industry?
The projected CAGR is approximately 14.58%.
2. Which companies are prominent players in the Smart Manufacturing Industry?
Key companies in the market include Honeywell International Inc, ABB Ltd, Mitsubishi Electric Corporation, Siemens AG, Schneider Electric SE, Fanuc Corporation, Robert Bosch GmbH, Texas Instruments Incorporated, Rockwell Automation Inc, Yokogawa Electric Corporation, General Electric Company, Emerson Electric Company.
3. What are the main segments of the Smart Manufacturing Industry?
The market segments include Component, Manufacturing Process, Enterprise Size, End User Industry.
4. Can you provide details about the market size?
The market size is estimated to be USD 141.39 Million as of 2022.
5. What are some drivers contributing to market growth?
Increasing Demand for Automation to Achieve Efficiency and Quality; Need for Compliance and Government Support for Digitization; Proliferation of Internet of Things.
6. What are the notable trends driving market growth?
Automotive Industry is Expected to Drive the Market Growth.
7. Are there any restraints impacting market growth?
Concerns Regarding Data Security; High Initial Installation Costs and Lack of Skilled Workforce Preventing Enterprises from Full-scale Adoption.
8. Can you provide examples of recent developments in the market?
Dec 2023: TeamViewer announced strategic investments in two pioneering companies for smart factory solutions: Sight Machine and Cybus. This initiative strengthens TeamViewer's dedication to digitalizing industrial workplaces and merging IT & OT. Also, these investments pave the way for TeamViewer to become a top provider of enterprise software, linking manufacturing infrastructure, IT systems, and data analytics.
9. What pricing options are available for accessing the report?
Pricing options include single-user, multi-user, and enterprise licenses priced at USD 4750, USD 5250, and USD 8750 respectively.
10. Is the market size provided in terms of value or volume?
The market size is provided in terms of value, measured in Million.
11. Are there any specific market keywords associated with the report?
Yes, the market keyword associated with the report is "Smart Manufacturing Industry," which aids in identifying and referencing the specific market segment covered.
12. How do I determine which pricing option suits my needs best?
The pricing options vary based on user requirements and access needs. Individual users may opt for single-user licenses, while businesses requiring broader access may choose multi-user or enterprise licenses for cost-effective access to the report.
13. Are there any additional resources or data provided in the Smart Manufacturing Industry report?
While the report offers comprehensive insights, it's advisable to review the specific contents or supplementary materials provided to ascertain if additional resources or data are available.
14. How can I stay updated on further developments or reports in the Smart Manufacturing Industry?
To stay informed about further developments, trends, and reports in the Smart Manufacturing Industry, consider subscribing to industry newsletters, following relevant companies and organizations, or regularly checking reputable industry news sources and publications.
Methodology
Step 1 - Identification of Relevant Samples Size from Population Database


Step 2 - Approaches for Defining Global Market Size (Value, Volume* & Price*)

Note*: In applicable scenarios
Step 3 - Data Sources
Primary Research
- Web Analytics
- Survey Reports
- Research Institute
- Latest Research Reports
- Opinion Leaders
Secondary Research
- Annual Reports
- White Paper
- Latest Press Release
- Industry Association
- Paid Database
- Investor Presentations

Step 4 - Data Triangulation
Involves using different sources of information in order to increase the validity of a study
These sources are likely to be stakeholders in a program - participants, other researchers, program staff, other community members, and so on.
Then we put all data in single framework & apply various statistical tools to find out the dynamic on the market.
During the analysis stage, feedback from the stakeholder groups would be compared to determine areas of agreement as well as areas of divergence