

Key Insights
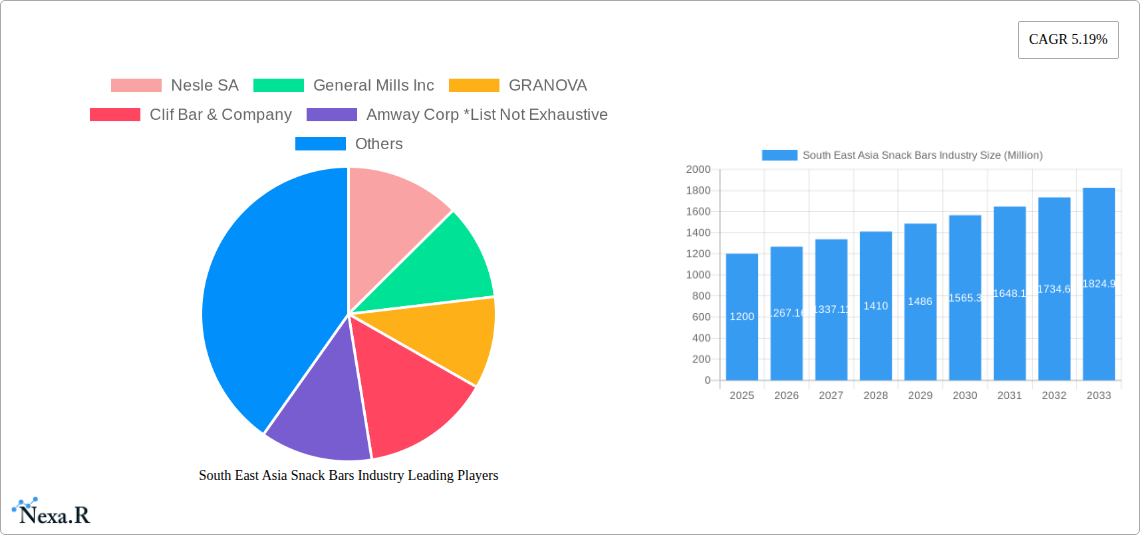
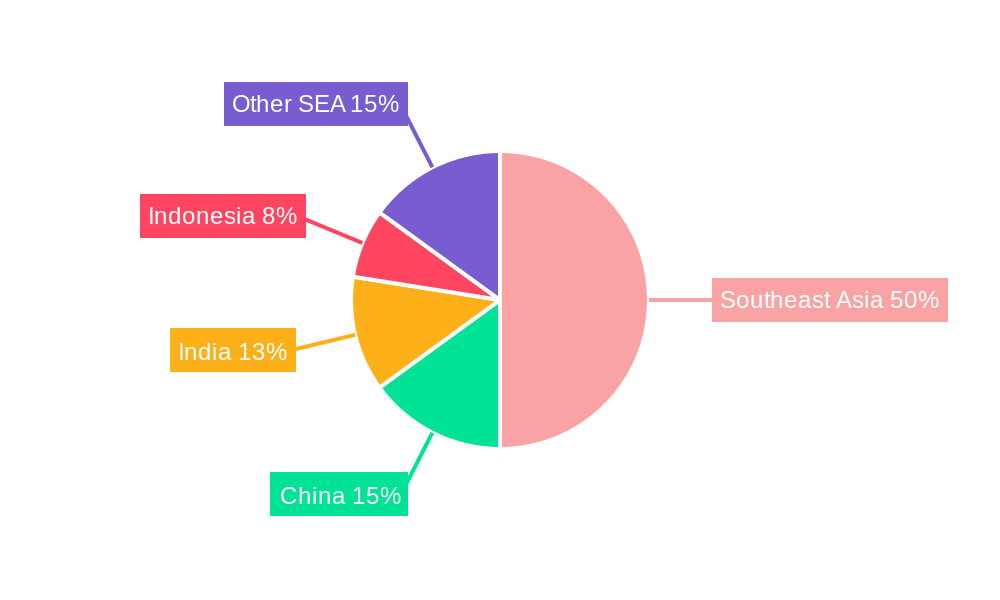
The South East Asia snack bar market, currently valued at approximately $1200 million (2025), is projected to experience robust growth, driven by increasing health consciousness, changing lifestyles, and the rising popularity of convenient, on-the-go food options. The market's Compound Annual Growth Rate (CAGR) of 5.19% from 2019 to 2024 suggests a continued upward trajectory. Key drivers include the expanding middle class with increased disposable income, growing urbanization leading to busier lifestyles, and a surge in demand for healthier snack alternatives, such as cereal and energy bars. Furthermore, the increasing availability of online retail channels has significantly broadened market access and fueled sales growth. While precise segmentation data for South East Asia is limited, a reasonable estimate indicates that online stores and hypermarkets/supermarkets are likely the dominant distribution channels, reflecting both the region's expanding e-commerce sector and established retail infrastructure. Product-wise, cereal and energy bars likely constitute a significant share, reflecting health-conscious trends. Major players like Nestle SA, General Mills, and KIND LLC are leveraging their brand recognition and established distribution networks to capture market share. However, challenges remain, such as fluctuating raw material prices and maintaining consistent product quality, which could act as potential restraints on market expansion in the coming years. The Asia-Pacific region, particularly countries like China, India, and Japan, are expected to contribute significantly to the overall growth due to their large populations and expanding economies.
The forecast period (2025-2033) anticipates continued growth, with the market likely exceeding $1200 million by a considerable margin. Expansion is anticipated in both online and offline retail channels. Growth will likely be propelled by product innovation catering to specific dietary needs and preferences (e.g., vegan, gluten-free) and increased marketing efforts targeting health-conscious consumers. Regional variations within Southeast Asia will likely exist, with higher growth rates in urban centers compared to rural areas. Competition is expected to remain fierce, requiring companies to invest in research and development, efficient supply chains, and effective marketing strategies to maintain a competitive edge in this dynamic market.
South East Asia Snack Bars Industry: Market Analysis & Forecast (2019-2033)
This comprehensive report provides a detailed analysis of the South East Asia snack bars industry, covering market dynamics, growth trends, competitive landscape, and future outlook. The study period spans from 2019 to 2033, with 2025 as the base and estimated year. This report is crucial for businesses, investors, and industry professionals seeking to understand and capitalize on opportunities within this dynamic market. The report segments the market by distribution channel (hypermarket/supermarket, online stores, convenience stores, other) and product type (cereal bar, energy bar, other snack bars). Key players analyzed include Nestlé SA, General Mills Inc, Granola, Clif Bar & Company, Amway Corp, KIND LLC, The Hut.com Limited (Myprotein), Kellogg Company, General Nutrition Centers Inc, and PRISTINE (Yogood), though the list is not exhaustive.
South East Asia Snack Bars Industry Market Dynamics & Structure
This section analyzes the market concentration, technological innovation drivers, regulatory frameworks, competitive product substitutes, end-user demographics, and M&A trends within the South East Asia snack bars industry. The market is characterized by a moderately concentrated structure, with a few large multinational players holding significant market share (approximately 40% combined in 2025). However, a large number of smaller, regional players also contribute significantly to overall sales volume.
- Market Concentration: Oligopolistic, with top 5 players holding xx% market share in 2025.
- Technological Innovation: Focus on functional ingredients, innovative flavors, and sustainable packaging. Barriers to innovation include high R&D costs and regulatory approvals.
- Regulatory Framework: Governments are increasingly regulating sugar and fat content, impacting product formulation and marketing.
- Competitive Substitutes: Other convenient snacks, fresh fruit, and yogurt represent key substitutes.
- End-User Demographics: Growing health consciousness among young adults and rising disposable incomes are driving demand.
- M&A Trends: Strategic acquisitions and partnerships are prevalent, with xx M&A deals recorded between 2019 and 2024. This trend is expected to continue due to consolidation and expansion desires.
South East Asia Snack Bars Industry Growth Trends & Insights
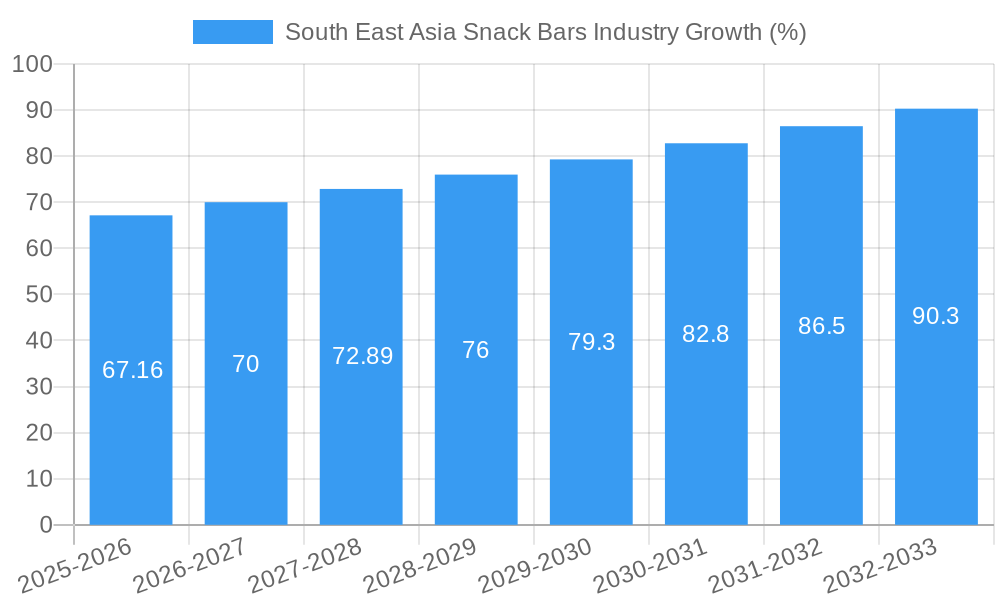
The South East Asia snack bars market exhibited strong growth during the historical period (2019-2024), driven by rising disposable incomes, changing lifestyles, and growing health awareness. The market size reached xx million units in 2024, and is projected to expand at a CAGR of xx% during the forecast period (2025-2033), reaching xx million units by 2033. This growth is fueled by several factors, including:
- Increasing demand for convenient and nutritious snacks.
- Growing preference for on-the-go consumption patterns.
- The rising popularity of health and wellness trends, with consumers seeking functional ingredients and clean labels.
- Expansion of e-commerce channels and wider online availability.
Dominant Regions, Countries, or Segments in South East Asia Snack Bars Industry
The Indonesian and Phillipine markets are currently leading the South East Asia snack bars industry, representing xx% and xx% of the total market volume in 2025 respectively, driven by a large population base, high consumption rates, and rising disposable incomes. Within distribution channels, hypermarkets/supermarkets dominate, followed by convenience stores and online stores, which are showing rapid growth due to increased internet penetration and e-commerce adoption. The energy bar segment is the fastest growing product type, fueled by demand for convenient energy sources for busy consumers.
- Key Drivers in Indonesia: Large population, rising middle class, and expanding retail infrastructure.
- Key Drivers in Philippines: High snack consumption rates and growing preference for healthier snack options.
- Hypermarkets/Supermarkets: Dominant due to wide reach and established distribution networks.
- Online Stores: Rapidly expanding due to increasing internet and smartphone penetration.
- Energy Bars: Fastest-growing segment due to health and fitness trends.
South East Asia Snack Bars Industry Product Landscape
The South East Asia snack bars market showcases a diverse range of products, catering to various consumer preferences and dietary needs. Innovation centers on incorporating functional ingredients like protein, fiber, and probiotics, alongside unique flavors tailored to local tastes. Key trends include the rise of organic and gluten-free options, reflecting the growing health consciousness among consumers. Manufacturers are increasingly using sustainable packaging to align with environmental concerns.
Key Drivers, Barriers & Challenges in South East Asia Snack Bars Industry
Key Drivers:
- Rising disposable incomes and increasing urbanization.
- Growing health awareness and preference for nutritious snacks.
- Expansion of modern retail channels, particularly e-commerce.
- Increasing demand for convenience and on-the-go consumption.
Key Challenges:
- Intense competition from established players and local brands.
- Fluctuations in raw material prices.
- Stringent regulations on sugar and fat content.
- Potential supply chain disruptions.
Emerging Opportunities in South East Asia Snack Bars Industry
Untapped markets in rural areas present substantial growth potential. The increasing popularity of plant-based and vegan options opens opportunities for innovative product development. Furthermore, personalized nutrition and functional ingredients cater to growing health consciousness, offering new avenues for differentiation.
Growth Accelerators in the South East Asia Snack Bars Industry
Technological advancements in food processing and packaging offer opportunities for cost efficiencies and product innovation. Strategic partnerships and acquisitions will facilitate market expansion and brand consolidation. Focus on sustainable practices and ethically sourced ingredients will enhance brand image and attract environmentally conscious consumers.
Key Players Shaping the South East Asia Snack Bars Industry Market
- Nestlé SA
- General Mills Inc
- Granola
- Clif Bar & Company
- Amway Corp
- KIND LLC
- The Hut.com Limited (Myprotein)
- Kellogg Company
- General Nutrition Centers Inc
- PRISTINE (Yogood)
Notable Milestones in South East Asia Snack Bars Industry Sector
- 2020: Nestlé launches a new range of protein bars targeted at fitness enthusiasts.
- 2021: Government of Indonesia introduces stricter regulations on sugar content in processed foods.
- 2022: General Mills acquires a local snack bar manufacturer in the Philippines to expand market share.
- 2023: Several major players announce commitments to sustainable packaging.
- 2024: KIND LLC introduces a new line of organic snack bars.
In-Depth South East Asia Snack Bars Industry Market Outlook
The South East Asia snack bars market is poised for continued strong growth, driven by several factors including rising disposable incomes, health and wellness trends, and expanding e-commerce. Strategic partnerships and investments in research and development will be crucial for companies seeking to capitalize on this growth. The focus on innovative products with functional ingredients, sustainable packaging, and ethical sourcing will be essential for success in this dynamic market.
South East Asia Snack Bars Industry Segmentation
-
1. Product Type
-
1.1. Cereal Bar
- 1.1.1. Granola/Muesli Bars
- 1.1.2. Other Cereal Bars
- 1.2. Energy Bar
- 1.3. Other Snack Bars
-
1.1. Cereal Bar
-
2. Distribution Channel
- 2.1. Hypermarket/Supermarket
- 2.2. Online Stores
- 2.3. Convenience Stores
- 2.4. Other Distribution Channels
-
3. Countires
- 3.1. Indonesia
- 3.2. Malaysia
- 3.3. Myanmar
- 3.4. Philippines
- 3.5. Singapore
- 3.6. Thailand
- 3.7. Vietnam
- 3.8. Rest of South East Asia
South East Asia Snack Bars Industry Segmentation By Geography
-
1. South East Asia
- 1.1. Indonesia
- 1.2. Malaysia
- 1.3. Singapore
- 1.4. Thailand
- 1.5. Vietnam
- 1.6. Philippines
- 1.7. Myanmar
- 1.8. Cambodia
- 1.9. Laos
South East Asia Snack Bars Industry REPORT HIGHLIGHTS
| Aspects | Details |
|---|---|
| Study Period | 2019-2033 |
| Base Year | 2024 |
| Estimated Year | 2025 |
| Forecast Period | 2025-2033 |
| Historical Period | 2019-2024 |
| Growth Rate | CAGR of 5.19% from 2019-2033 |
| Segmentation |
|
Table of Contents
- 1. Introduction
- 1.1. Research Scope
- 1.2. Market Segmentation
- 1.3. Research Methodology
- 1.4. Definitions and Assumptions
- 2. Executive Summary
- 2.1. Introduction
- 3. Market Dynamics
- 3.1. Introduction
- 3.2. Market Drivers
- 3.2.1. Increasing application of Gelatin in healthcare and pharmaceutical sector
- 3.3. Market Restrains
- 3.3.1. Rising demand for clean label products
- 3.4. Market Trends
- 3.4.1. Propensity to Consume Convenient and Healthy On-the-go Meal and Snack Options
- 4. Market Factor Analysis
- 4.1. Porters Five Forces
- 4.2. Supply/Value Chain
- 4.3. PESTEL analysis
- 4.4. Market Entropy
- 4.5. Patent/Trademark Analysis
- 5. South East Asia Snack Bars Industry Analysis, Insights and Forecast, 2019-2031
- 5.1. Market Analysis, Insights and Forecast - by Product Type
- 5.1.1. Cereal Bar
- 5.1.1.1. Granola/Muesli Bars
- 5.1.1.2. Other Cereal Bars
- 5.1.2. Energy Bar
- 5.1.3. Other Snack Bars
- 5.1.1. Cereal Bar
- 5.2. Market Analysis, Insights and Forecast - by Distribution Channel
- 5.2.1. Hypermarket/Supermarket
- 5.2.2. Online Stores
- 5.2.3. Convenience Stores
- 5.2.4. Other Distribution Channels
- 5.3. Market Analysis, Insights and Forecast - by Countires
- 5.3.1. Indonesia
- 5.3.2. Malaysia
- 5.3.3. Myanmar
- 5.3.4. Philippines
- 5.3.5. Singapore
- 5.3.6. Thailand
- 5.3.7. Vietnam
- 5.3.8. Rest of South East Asia
- 5.4. Market Analysis, Insights and Forecast - by Region
- 5.4.1. South East Asia
- 5.1. Market Analysis, Insights and Forecast - by Product Type
- 6. China South East Asia Snack Bars Industry Analysis, Insights and Forecast, 2019-2031
- 7. Japan South East Asia Snack Bars Industry Analysis, Insights and Forecast, 2019-2031
- 8. India South East Asia Snack Bars Industry Analysis, Insights and Forecast, 2019-2031
- 9. South Korea South East Asia Snack Bars Industry Analysis, Insights and Forecast, 2019-2031
- 10. Taiwan South East Asia Snack Bars Industry Analysis, Insights and Forecast, 2019-2031
- 11. Australia South East Asia Snack Bars Industry Analysis, Insights and Forecast, 2019-2031
- 12. Rest of Asia-Pacific South East Asia Snack Bars Industry Analysis, Insights and Forecast, 2019-2031
- 13. Competitive Analysis
- 13.1. Market Share Analysis 2024
- 13.2. Company Profiles
- 13.2.1 Nesle SA
- 13.2.1.1. Overview
- 13.2.1.2. Products
- 13.2.1.3. SWOT Analysis
- 13.2.1.4. Recent Developments
- 13.2.1.5. Financials (Based on Availability)
- 13.2.2 General Mills Inc
- 13.2.2.1. Overview
- 13.2.2.2. Products
- 13.2.2.3. SWOT Analysis
- 13.2.2.4. Recent Developments
- 13.2.2.5. Financials (Based on Availability)
- 13.2.3 GRANOVA
- 13.2.3.1. Overview
- 13.2.3.2. Products
- 13.2.3.3. SWOT Analysis
- 13.2.3.4. Recent Developments
- 13.2.3.5. Financials (Based on Availability)
- 13.2.4 Clif Bar & Company
- 13.2.4.1. Overview
- 13.2.4.2. Products
- 13.2.4.3. SWOT Analysis
- 13.2.4.4. Recent Developments
- 13.2.4.5. Financials (Based on Availability)
- 13.2.5 Amway Corp *List Not Exhaustive
- 13.2.5.1. Overview
- 13.2.5.2. Products
- 13.2.5.3. SWOT Analysis
- 13.2.5.4. Recent Developments
- 13.2.5.5. Financials (Based on Availability)
- 13.2.6 KIND LLC
- 13.2.6.1. Overview
- 13.2.6.2. Products
- 13.2.6.3. SWOT Analysis
- 13.2.6.4. Recent Developments
- 13.2.6.5. Financials (Based on Availability)
- 13.2.7 The Hut com Limited (Myprotein)
- 13.2.7.1. Overview
- 13.2.7.2. Products
- 13.2.7.3. SWOT Analysis
- 13.2.7.4. Recent Developments
- 13.2.7.5. Financials (Based on Availability)
- 13.2.8 Kellogg Company
- 13.2.8.1. Overview
- 13.2.8.2. Products
- 13.2.8.3. SWOT Analysis
- 13.2.8.4. Recent Developments
- 13.2.8.5. Financials (Based on Availability)
- 13.2.9 General Nutrition Centers Inc
- 13.2.9.1. Overview
- 13.2.9.2. Products
- 13.2.9.3. SWOT Analysis
- 13.2.9.4. Recent Developments
- 13.2.9.5. Financials (Based on Availability)
- 13.2.10 PRISTINE (Yogood)
- 13.2.10.1. Overview
- 13.2.10.2. Products
- 13.2.10.3. SWOT Analysis
- 13.2.10.4. Recent Developments
- 13.2.10.5. Financials (Based on Availability)
- 13.2.1 Nesle SA
List of Figures
- Figure 1: South East Asia Snack Bars Industry Revenue Breakdown (Million, %) by Product 2024 & 2032
- Figure 2: South East Asia Snack Bars Industry Share (%) by Company 2024
List of Tables
- Table 1: South East Asia Snack Bars Industry Revenue Million Forecast, by Region 2019 & 2032
- Table 2: South East Asia Snack Bars Industry Volume K Tons Forecast, by Region 2019 & 2032
- Table 3: South East Asia Snack Bars Industry Revenue Million Forecast, by Product Type 2019 & 2032
- Table 4: South East Asia Snack Bars Industry Volume K Tons Forecast, by Product Type 2019 & 2032
- Table 5: South East Asia Snack Bars Industry Revenue Million Forecast, by Distribution Channel 2019 & 2032
- Table 6: South East Asia Snack Bars Industry Volume K Tons Forecast, by Distribution Channel 2019 & 2032
- Table 7: South East Asia Snack Bars Industry Revenue Million Forecast, by Countires 2019 & 2032
- Table 8: South East Asia Snack Bars Industry Volume K Tons Forecast, by Countires 2019 & 2032
- Table 9: South East Asia Snack Bars Industry Revenue Million Forecast, by Region 2019 & 2032
- Table 10: South East Asia Snack Bars Industry Volume K Tons Forecast, by Region 2019 & 2032
- Table 11: South East Asia Snack Bars Industry Revenue Million Forecast, by Country 2019 & 2032
- Table 12: South East Asia Snack Bars Industry Volume K Tons Forecast, by Country 2019 & 2032
- Table 13: China South East Asia Snack Bars Industry Revenue (Million) Forecast, by Application 2019 & 2032
- Table 14: China South East Asia Snack Bars Industry Volume (K Tons) Forecast, by Application 2019 & 2032
- Table 15: Japan South East Asia Snack Bars Industry Revenue (Million) Forecast, by Application 2019 & 2032
- Table 16: Japan South East Asia Snack Bars Industry Volume (K Tons) Forecast, by Application 2019 & 2032
- Table 17: India South East Asia Snack Bars Industry Revenue (Million) Forecast, by Application 2019 & 2032
- Table 18: India South East Asia Snack Bars Industry Volume (K Tons) Forecast, by Application 2019 & 2032
- Table 19: South Korea South East Asia Snack Bars Industry Revenue (Million) Forecast, by Application 2019 & 2032
- Table 20: South Korea South East Asia Snack Bars Industry Volume (K Tons) Forecast, by Application 2019 & 2032
- Table 21: Taiwan South East Asia Snack Bars Industry Revenue (Million) Forecast, by Application 2019 & 2032
- Table 22: Taiwan South East Asia Snack Bars Industry Volume (K Tons) Forecast, by Application 2019 & 2032
- Table 23: Australia South East Asia Snack Bars Industry Revenue (Million) Forecast, by Application 2019 & 2032
- Table 24: Australia South East Asia Snack Bars Industry Volume (K Tons) Forecast, by Application 2019 & 2032
- Table 25: Rest of Asia-Pacific South East Asia Snack Bars Industry Revenue (Million) Forecast, by Application 2019 & 2032
- Table 26: Rest of Asia-Pacific South East Asia Snack Bars Industry Volume (K Tons) Forecast, by Application 2019 & 2032
- Table 27: South East Asia Snack Bars Industry Revenue Million Forecast, by Product Type 2019 & 2032
- Table 28: South East Asia Snack Bars Industry Volume K Tons Forecast, by Product Type 2019 & 2032
- Table 29: South East Asia Snack Bars Industry Revenue Million Forecast, by Distribution Channel 2019 & 2032
- Table 30: South East Asia Snack Bars Industry Volume K Tons Forecast, by Distribution Channel 2019 & 2032
- Table 31: South East Asia Snack Bars Industry Revenue Million Forecast, by Countires 2019 & 2032
- Table 32: South East Asia Snack Bars Industry Volume K Tons Forecast, by Countires 2019 & 2032
- Table 33: South East Asia Snack Bars Industry Revenue Million Forecast, by Country 2019 & 2032
- Table 34: South East Asia Snack Bars Industry Volume K Tons Forecast, by Country 2019 & 2032
- Table 35: Indonesia South East Asia Snack Bars Industry Revenue (Million) Forecast, by Application 2019 & 2032
- Table 36: Indonesia South East Asia Snack Bars Industry Volume (K Tons) Forecast, by Application 2019 & 2032
- Table 37: Malaysia South East Asia Snack Bars Industry Revenue (Million) Forecast, by Application 2019 & 2032
- Table 38: Malaysia South East Asia Snack Bars Industry Volume (K Tons) Forecast, by Application 2019 & 2032
- Table 39: Singapore South East Asia Snack Bars Industry Revenue (Million) Forecast, by Application 2019 & 2032
- Table 40: Singapore South East Asia Snack Bars Industry Volume (K Tons) Forecast, by Application 2019 & 2032
- Table 41: Thailand South East Asia Snack Bars Industry Revenue (Million) Forecast, by Application 2019 & 2032
- Table 42: Thailand South East Asia Snack Bars Industry Volume (K Tons) Forecast, by Application 2019 & 2032
- Table 43: Vietnam South East Asia Snack Bars Industry Revenue (Million) Forecast, by Application 2019 & 2032
- Table 44: Vietnam South East Asia Snack Bars Industry Volume (K Tons) Forecast, by Application 2019 & 2032
- Table 45: Philippines South East Asia Snack Bars Industry Revenue (Million) Forecast, by Application 2019 & 2032
- Table 46: Philippines South East Asia Snack Bars Industry Volume (K Tons) Forecast, by Application 2019 & 2032
- Table 47: Myanmar South East Asia Snack Bars Industry Revenue (Million) Forecast, by Application 2019 & 2032
- Table 48: Myanmar South East Asia Snack Bars Industry Volume (K Tons) Forecast, by Application 2019 & 2032
- Table 49: Cambodia South East Asia Snack Bars Industry Revenue (Million) Forecast, by Application 2019 & 2032
- Table 50: Cambodia South East Asia Snack Bars Industry Volume (K Tons) Forecast, by Application 2019 & 2032
- Table 51: Laos South East Asia Snack Bars Industry Revenue (Million) Forecast, by Application 2019 & 2032
- Table 52: Laos South East Asia Snack Bars Industry Volume (K Tons) Forecast, by Application 2019 & 2032
Frequently Asked Questions
1. What is the projected Compound Annual Growth Rate (CAGR) of the South East Asia Snack Bars Industry?
The projected CAGR is approximately 5.19%.
2. Which companies are prominent players in the South East Asia Snack Bars Industry?
Key companies in the market include Nesle SA, General Mills Inc, GRANOVA, Clif Bar & Company, Amway Corp *List Not Exhaustive, KIND LLC, The Hut com Limited (Myprotein), Kellogg Company, General Nutrition Centers Inc, PRISTINE (Yogood).
3. What are the main segments of the South East Asia Snack Bars Industry?
The market segments include Product Type, Distribution Channel, Countires.
4. Can you provide details about the market size?
The market size is estimated to be USD 1200 Million as of 2022.
5. What are some drivers contributing to market growth?
Increasing application of Gelatin in healthcare and pharmaceutical sector.
6. What are the notable trends driving market growth?
Propensity to Consume Convenient and Healthy On-the-go Meal and Snack Options.
7. Are there any restraints impacting market growth?
Rising demand for clean label products.
8. Can you provide examples of recent developments in the market?
New product launches with functional ingredients and innovative flavors
9. What pricing options are available for accessing the report?
Pricing options include single-user, multi-user, and enterprise licenses priced at USD 4750, USD 4950, and USD 6800 respectively.
10. Is the market size provided in terms of value or volume?
The market size is provided in terms of value, measured in Million and volume, measured in K Tons.
11. Are there any specific market keywords associated with the report?
Yes, the market keyword associated with the report is "South East Asia Snack Bars Industry," which aids in identifying and referencing the specific market segment covered.
12. How do I determine which pricing option suits my needs best?
The pricing options vary based on user requirements and access needs. Individual users may opt for single-user licenses, while businesses requiring broader access may choose multi-user or enterprise licenses for cost-effective access to the report.
13. Are there any additional resources or data provided in the South East Asia Snack Bars Industry report?
While the report offers comprehensive insights, it's advisable to review the specific contents or supplementary materials provided to ascertain if additional resources or data are available.
14. How can I stay updated on further developments or reports in the South East Asia Snack Bars Industry?
To stay informed about further developments, trends, and reports in the South East Asia Snack Bars Industry, consider subscribing to industry newsletters, following relevant companies and organizations, or regularly checking reputable industry news sources and publications.
Methodology
Step 1 - Identification of Relevant Samples Size from Population Database


Step 2 - Approaches for Defining Global Market Size (Value, Volume* & Price*)

Note*: In applicable scenarios
Step 3 - Data Sources
Primary Research
- Web Analytics
- Survey Reports
- Research Institute
- Latest Research Reports
- Opinion Leaders
Secondary Research
- Annual Reports
- White Paper
- Latest Press Release
- Industry Association
- Paid Database
- Investor Presentations

Step 4 - Data Triangulation
Involves using different sources of information in order to increase the validity of a study
These sources are likely to be stakeholders in a program - participants, other researchers, program staff, other community members, and so on.
Then we put all data in single framework & apply various statistical tools to find out the dynamic on the market.
During the analysis stage, feedback from the stakeholder groups would be compared to determine areas of agreement as well as areas of divergence
