

Key Insights
The global submarine market, valued at approximately $70 billion in 2025, is experiencing robust growth, projected to maintain a Compound Annual Growth Rate (CAGR) exceeding 4% through 2033. This expansion is driven by escalating geopolitical tensions, the modernization of naval fleets by major global powers, and increasing demand for advanced submarine technology. Key drivers include the need for enhanced underwater surveillance capabilities, strategic deterrence through nuclear-powered ballistic missile submarines (SSBNs), and the rising adoption of advanced technologies like Artificial Intelligence (AI) and autonomous underwater vehicles (AUVs) for improved operational efficiency and targeting. The market is segmented by submarine type, with nuclear-powered submarines (SSNs, SSBNs, SSGNs) commanding a significant share, driven by their long endurance and advanced capabilities. However, diesel-electric submarines (SSKs) remain crucial for cost-conscious nations and specific operational scenarios. Technological advancements, including improved propulsion systems, quieter operation, and enhanced sensor technologies, are shaping market trends. Geographic distribution shows strong demand from North America and Asia-Pacific regions, fueled by substantial defense budgets and active naval modernization programs. While technological advancements represent a significant driver, potential restraints include the high cost of submarine acquisition and maintenance, as well as the lengthy procurement cycles involved.
Competition in the submarine industry is intense, with major players like General Dynamics, Naval Group, Fincantieri, HD Hyundai, Thyssenkrupp, and Huntington Ingalls Industries holding significant market shares. These companies are continuously investing in R&D to develop next-generation submarines with improved stealth capabilities, enhanced weapon systems, and advanced sensor technologies to maintain their competitive edge. The ongoing geopolitical uncertainty and naval modernization efforts globally indicate that the submarine market is poised for consistent growth in the forecast period, supported by strong government spending and increased focus on naval power projection. The market's future will be defined by the pace of technological advancements, evolving geopolitical dynamics, and the strategic priorities of key naval powers.

Submarine Industry Market Report: 2019-2033
This comprehensive report provides a detailed analysis of the global submarine industry, encompassing market dynamics, growth trends, key players, and future outlook. The study period covers 2019-2033, with a base year of 2025 and a forecast period of 2025-2033. The report segments the market by submarine type (Nuclear-Powered Submarines (SSNs), Ballistic Missile Submarines (SSBNs), Guided-Missile Nuclear Submarines (SSGNs), Diesel-Electric Submarines (SSKs)) and offers valuable insights for industry professionals, investors, and policymakers. The market size is presented in million units.
Submarine Industry Market Dynamics & Structure
The global submarine industry is characterized by high market concentration among a few major players, primarily driven by significant technological advancements, stringent regulatory frameworks, and the limited availability of suitable substitutes. The parent market is the global defense industry, while the child market is specifically military naval vessels. Market dynamics are heavily influenced by geopolitical factors, technological innovation, and substantial investments in research and development. M&A activity remains relatively low due to the specialized nature of the industry and the high capital investment required.
- Market Concentration: Highly concentrated, with top 10 players holding xx% market share in 2025.
- Technological Innovation: Focus on AI, autonomous systems, improved stealth technologies, and advanced sensor systems. Significant barriers to entry due to high R&D costs and specialized expertise.
- Regulatory Frameworks: Stringent export controls and international treaties heavily influence market access and trade.
- Competitive Product Substitutes: Limited viable substitutes; unmanned underwater vehicles (UUVs) are emerging as a complementary technology, rather than a direct replacement.
- End-User Demographics: Primarily government defense departments and navies of major global powers.
- M&A Trends: Relatively low deal volume compared to other defense sectors, with a focus on strategic partnerships and technology acquisitions.
Submarine Industry Growth Trends & Insights
The global submarine market exhibited a CAGR of xx% during the historical period (2019-2024) and is projected to maintain a CAGR of xx% during the forecast period (2025-2033). This growth is primarily driven by increasing geopolitical tensions, modernization of existing fleets, and the demand for advanced submarine capabilities. Technological advancements, such as AI-powered navigation and improved sensor technologies, are further fueling market expansion. Shifting consumer behavior – namely, increased defense spending by key nations – contributes significantly to the growth. Market penetration within existing user bases remains high, with growth driven primarily by new orders and fleet modernization.

Dominant Regions, Countries, or Segments in Submarine Industry
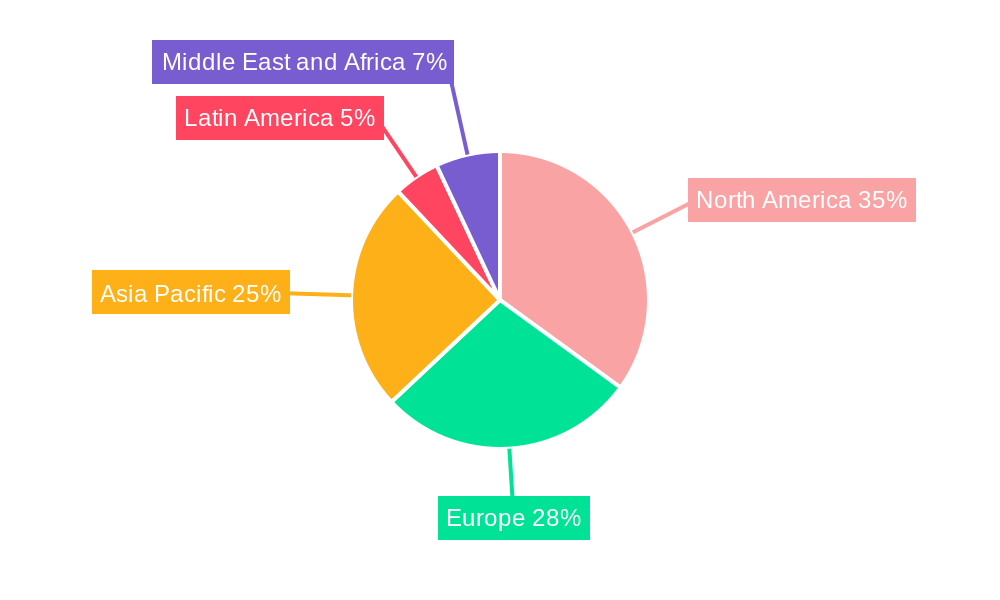
The market is dominated by North America, Europe, and Asia-Pacific. Within these regions, specific countries like the United States, Russia, China, and France lead in both production and operation of submarines across all segments. The SSN segment dominates in terms of volume, reflecting global naval priorities.
- Key Drivers:
- Geopolitical instability: Ongoing conflicts and territorial disputes drive demand for enhanced submarine capabilities.
- Modernization of existing fleets: Aging submarine fleets require replacement and upgrades.
- Technological advancements: New technologies provide improved performance, stealth, and operational capabilities.
- Dominance Factors:
- Large defense budgets: Countries with significant defense budgets contribute heavily to market growth.
- Established industrial base: Countries with a strong shipbuilding infrastructure and skilled workforce retain a competitive edge.
- Strategic partnerships: International collaborations in submarine development contribute to technological advancements and market expansion.
Submarine Industry Product Landscape
The submarine industry showcases a diverse product landscape, ranging from nuclear-powered attack submarines with advanced sonar and weaponry to diesel-electric submarines emphasizing stealth and cost-effectiveness. Key innovations include increased automation, enhanced sensor technologies, and improved propulsion systems. Unique selling propositions frequently revolve around stealth capabilities, payload capacity, and operational endurance. Technological advancements such as AI-driven navigation, improved acoustic signature reduction, and advanced weapons systems represent ongoing key developments.
Key Drivers, Barriers & Challenges in Submarine Industry
Key Drivers: Increasing geopolitical tensions, the need for strategic deterrence, technological advancements in submarine design and capabilities, and rising defense budgets in several key nations are the major drivers of market growth.
Challenges and Restraints: High production costs, stringent regulatory frameworks and export controls, complex supply chains vulnerable to disruptions, and intense competition among major players represent significant barriers to entry and sustained growth. These factors can lead to project delays and cost overruns, potentially impacting market expansion. The estimated impact of supply chain disruptions on market growth is xx%.
Emerging Opportunities in Submarine Industry
Emerging opportunities include the growing adoption of unmanned underwater vehicles (UUVs) for reconnaissance and surveillance, the development of more fuel-efficient propulsion systems, and expanding opportunities in emerging markets with growing naval capabilities. Advanced sensor technologies, autonomous navigation, and AI integration represent significant potential for future market expansion.
Growth Accelerators in the Submarine Industry Industry
Technological breakthroughs in propulsion systems, sensor technologies, and autonomous capabilities are accelerating growth. Strategic partnerships between governments and defense contractors are fostering innovation and expanding market reach. Market expansion into new regions with growing naval needs is also a key driver of future growth.
Key Players Shaping the Submarine Industry Market
- General Dynamics Corporation
- Naval Group
- FINCANTIERI S p A
- HD Hyundai Heavy Industries
- thyssenkrupp AG
- Daewoo Shipbuilding & Marine Engineering Co Ltd
- Huntington Ingalls Industries Inc
- Navantia S A SM E
- BAE Systems plc
- United Shipbuilding Corporation
- Saab AB
- Mitsubishi Heavy Industries Ltd
Notable Milestones in Submarine Industry Sector
- December 2022: Indian shipbuilder Mazagon Dock Limited (MDL) delivered "Vagir," the fifth Scorpene-type submarine to the Indian Navy, demonstrating continued growth in the Asia-Pacific region.
- December 2022: Russia commissioned the Generalissimus Suvorov nuclear-powered submarine, highlighting ongoing efforts to modernize its naval capabilities.
- December 2022: The UK Royal Navy ordered its first crewless submarine, the Cetus, indicating a significant shift towards autonomous underwater systems.
In-Depth Submarine Industry Market Outlook
The future of the submarine industry is marked by continued growth driven by sustained geopolitical uncertainties, technological advancements, and the expansion of submarine capabilities. Strategic opportunities exist in developing advanced autonomous systems, improving energy efficiency, and exploring new markets. The long-term outlook remains positive, with continued investment in research and development and the expansion of global naval forces creating significant market potential.
Submarine Industry Segmentation
- 1. Production Analysis
- 2. Consumption Analysis
- 3. Import Market Analysis (Value & Volume)
- 4. Export Market Analysis (Value & Volume)
- 5. Price Trend Analysis
Submarine Industry Segmentation By Geography
-
1. North America
- 1.1. United States
- 1.2. Canada
- 1.3. Mexico
-
2. South America
- 2.1. Brazil
- 2.2. Argentina
- 2.3. Rest of South America
-
3. Europe
- 3.1. United Kingdom
- 3.2. Germany
- 3.3. France
- 3.4. Italy
- 3.5. Spain
- 3.6. Russia
- 3.7. Benelux
- 3.8. Nordics
- 3.9. Rest of Europe
-
4. Middle East & Africa
- 4.1. Turkey
- 4.2. Israel
- 4.3. GCC
- 4.4. North Africa
- 4.5. South Africa
- 4.6. Rest of Middle East & Africa
-
5. Asia Pacific
- 5.1. China
- 5.2. India
- 5.3. Japan
- 5.4. South Korea
- 5.5. ASEAN
- 5.6. Oceania
- 5.7. Rest of Asia Pacific
Submarine Industry REPORT HIGHLIGHTS
| Aspects | Details |
|---|---|
| Study Period | 2019-2033 |
| Base Year | 2024 |
| Estimated Year | 2025 |
| Forecast Period | 2025-2033 |
| Historical Period | 2019-2024 |
| Growth Rate | CAGR of > 4.00% from 2019-2033 |
| Segmentation |
|
Table of Contents
- 1. Introduction
- 1.1. Research Scope
- 1.2. Market Segmentation
- 1.3. Research Methodology
- 1.4. Definitions and Assumptions
- 2. Executive Summary
- 2.1. Introduction
- 3. Market Dynamics
- 3.1. Introduction
- 3.2. Market Drivers
- 3.2.1. Increase in Internet of Things (IoT) and Autonomous Systems; Rise in Demand for Military and Defense Satellite Communication Solutions
- 3.3. Market Restrains
- 3.3.1. Cybersecurity Threats to Satellite Communication; Interference in Transmission of Data
- 3.4. Market Trends
- 3.4.1. Nuclear-Powered Submarines (SSN) Segment Is Anticipated to Grow with the Highest CAGR During the Forecast Period
- 4. Market Factor Analysis
- 4.1. Porters Five Forces
- 4.2. Supply/Value Chain
- 4.3. PESTEL analysis
- 4.4. Market Entropy
- 4.5. Patent/Trademark Analysis
- 5. Global Submarine Industry Analysis, Insights and Forecast, 2019-2031
- 5.1. Market Analysis, Insights and Forecast - by Production Analysis
- 5.2. Market Analysis, Insights and Forecast - by Consumption Analysis
- 5.3. Market Analysis, Insights and Forecast - by Import Market Analysis (Value & Volume)
- 5.4. Market Analysis, Insights and Forecast - by Export Market Analysis (Value & Volume)
- 5.5. Market Analysis, Insights and Forecast - by Price Trend Analysis
- 5.6. Market Analysis, Insights and Forecast - by Region
- 5.6.1. North America
- 5.6.2. South America
- 5.6.3. Europe
- 5.6.4. Middle East & Africa
- 5.6.5. Asia Pacific
- 5.1. Market Analysis, Insights and Forecast - by Production Analysis
- 6. North America Submarine Industry Analysis, Insights and Forecast, 2019-2031
- 6.1. Market Analysis, Insights and Forecast - by Production Analysis
- 6.2. Market Analysis, Insights and Forecast - by Consumption Analysis
- 6.3. Market Analysis, Insights and Forecast - by Import Market Analysis (Value & Volume)
- 6.4. Market Analysis, Insights and Forecast - by Export Market Analysis (Value & Volume)
- 6.5. Market Analysis, Insights and Forecast - by Price Trend Analysis
- 6.1. Market Analysis, Insights and Forecast - by Production Analysis
- 7. South America Submarine Industry Analysis, Insights and Forecast, 2019-2031
- 7.1. Market Analysis, Insights and Forecast - by Production Analysis
- 7.2. Market Analysis, Insights and Forecast - by Consumption Analysis
- 7.3. Market Analysis, Insights and Forecast - by Import Market Analysis (Value & Volume)
- 7.4. Market Analysis, Insights and Forecast - by Export Market Analysis (Value & Volume)
- 7.5. Market Analysis, Insights and Forecast - by Price Trend Analysis
- 7.1. Market Analysis, Insights and Forecast - by Production Analysis
- 8. Europe Submarine Industry Analysis, Insights and Forecast, 2019-2031
- 8.1. Market Analysis, Insights and Forecast - by Production Analysis
- 8.2. Market Analysis, Insights and Forecast - by Consumption Analysis
- 8.3. Market Analysis, Insights and Forecast - by Import Market Analysis (Value & Volume)
- 8.4. Market Analysis, Insights and Forecast - by Export Market Analysis (Value & Volume)
- 8.5. Market Analysis, Insights and Forecast - by Price Trend Analysis
- 8.1. Market Analysis, Insights and Forecast - by Production Analysis
- 9. Middle East & Africa Submarine Industry Analysis, Insights and Forecast, 2019-2031
- 9.1. Market Analysis, Insights and Forecast - by Production Analysis
- 9.2. Market Analysis, Insights and Forecast - by Consumption Analysis
- 9.3. Market Analysis, Insights and Forecast - by Import Market Analysis (Value & Volume)
- 9.4. Market Analysis, Insights and Forecast - by Export Market Analysis (Value & Volume)
- 9.5. Market Analysis, Insights and Forecast - by Price Trend Analysis
- 9.1. Market Analysis, Insights and Forecast - by Production Analysis
- 10. Asia Pacific Submarine Industry Analysis, Insights and Forecast, 2019-2031
- 10.1. Market Analysis, Insights and Forecast - by Production Analysis
- 10.2. Market Analysis, Insights and Forecast - by Consumption Analysis
- 10.3. Market Analysis, Insights and Forecast - by Import Market Analysis (Value & Volume)
- 10.4. Market Analysis, Insights and Forecast - by Export Market Analysis (Value & Volume)
- 10.5. Market Analysis, Insights and Forecast - by Price Trend Analysis
- 10.1. Market Analysis, Insights and Forecast - by Production Analysis
- 11. North America Submarine Industry Analysis, Insights and Forecast, 2019-2031
- 11.1. Market Analysis, Insights and Forecast - By Country/Sub-region
- 11.1.1 United States
- 11.1.2 Canada
- 12. Europe Submarine Industry Analysis, Insights and Forecast, 2019-2031
- 12.1. Market Analysis, Insights and Forecast - By Country/Sub-region
- 12.1.1 Germany
- 12.1.2 United Kingdom
- 12.1.3 France
- 12.1.4 Rest of Europe
- 13. Asia Pacific Submarine Industry Analysis, Insights and Forecast, 2019-2031
- 13.1. Market Analysis, Insights and Forecast - By Country/Sub-region
- 13.1.1 China
- 13.1.2 India
- 13.1.3 Japan
- 13.1.4 Australia
- 13.1.5 Rest of Asia Pacific
- 14. Latin America Submarine Industry Analysis, Insights and Forecast, 2019-2031
- 14.1. Market Analysis, Insights and Forecast - By Country/Sub-region
- 14.1.1 Brazil
- 14.1.2 Rest of Latin America
- 15. Middle East and Africa Submarine Industry Analysis, Insights and Forecast, 2019-2031
- 15.1. Market Analysis, Insights and Forecast - By Country/Sub-region
- 15.1.1 South Africa
- 15.1.2 Rest of Middle East and Africa
- 16. Competitive Analysis
- 16.1. Global Market Share Analysis 2024
- 16.2. Company Profiles
- 16.2.1 General Dynamics Corporation
- 16.2.1.1. Overview
- 16.2.1.2. Products
- 16.2.1.3. SWOT Analysis
- 16.2.1.4. Recent Developments
- 16.2.1.5. Financials (Based on Availability)
- 16.2.2 Naval Group
- 16.2.2.1. Overview
- 16.2.2.2. Products
- 16.2.2.3. SWOT Analysis
- 16.2.2.4. Recent Developments
- 16.2.2.5. Financials (Based on Availability)
- 16.2.3 FINCANTIERI S p A
- 16.2.3.1. Overview
- 16.2.3.2. Products
- 16.2.3.3. SWOT Analysis
- 16.2.3.4. Recent Developments
- 16.2.3.5. Financials (Based on Availability)
- 16.2.4 HD Hyundai Heavy Industries
- 16.2.4.1. Overview
- 16.2.4.2. Products
- 16.2.4.3. SWOT Analysis
- 16.2.4.4. Recent Developments
- 16.2.4.5. Financials (Based on Availability)
- 16.2.5 thyssenkrupp AG
- 16.2.5.1. Overview
- 16.2.5.2. Products
- 16.2.5.3. SWOT Analysis
- 16.2.5.4. Recent Developments
- 16.2.5.5. Financials (Based on Availability)
- 16.2.6 Daewoo Shipbuilding & Marine Engineering Co Ltd
- 16.2.6.1. Overview
- 16.2.6.2. Products
- 16.2.6.3. SWOT Analysis
- 16.2.6.4. Recent Developments
- 16.2.6.5. Financials (Based on Availability)
- 16.2.7 Huntington Ingalls Industries Inc
- 16.2.7.1. Overview
- 16.2.7.2. Products
- 16.2.7.3. SWOT Analysis
- 16.2.7.4. Recent Developments
- 16.2.7.5. Financials (Based on Availability)
- 16.2.8 Navantia S A SM E
- 16.2.8.1. Overview
- 16.2.8.2. Products
- 16.2.8.3. SWOT Analysis
- 16.2.8.4. Recent Developments
- 16.2.8.5. Financials (Based on Availability)
- 16.2.9 BAE Systems plc
- 16.2.9.1. Overview
- 16.2.9.2. Products
- 16.2.9.3. SWOT Analysis
- 16.2.9.4. Recent Developments
- 16.2.9.5. Financials (Based on Availability)
- 16.2.10 United Shipbuilding Corporation
- 16.2.10.1. Overview
- 16.2.10.2. Products
- 16.2.10.3. SWOT Analysis
- 16.2.10.4. Recent Developments
- 16.2.10.5. Financials (Based on Availability)
- 16.2.11 Saab AB
- 16.2.11.1. Overview
- 16.2.11.2. Products
- 16.2.11.3. SWOT Analysis
- 16.2.11.4. Recent Developments
- 16.2.11.5. Financials (Based on Availability)
- 16.2.12 Mitsubishi Heavy Industries Ltd
- 16.2.12.1. Overview
- 16.2.12.2. Products
- 16.2.12.3. SWOT Analysis
- 16.2.12.4. Recent Developments
- 16.2.12.5. Financials (Based on Availability)
- 16.2.1 General Dynamics Corporation
List of Figures
- Figure 1: Global Submarine Industry Revenue Breakdown (Million, %) by Region 2024 & 2032
- Figure 2: North America Submarine Industry Revenue (Million), by Country 2024 & 2032
- Figure 3: North America Submarine Industry Revenue Share (%), by Country 2024 & 2032
- Figure 4: Europe Submarine Industry Revenue (Million), by Country 2024 & 2032
- Figure 5: Europe Submarine Industry Revenue Share (%), by Country 2024 & 2032
- Figure 6: Asia Pacific Submarine Industry Revenue (Million), by Country 2024 & 2032
- Figure 7: Asia Pacific Submarine Industry Revenue Share (%), by Country 2024 & 2032
- Figure 8: Latin America Submarine Industry Revenue (Million), by Country 2024 & 2032
- Figure 9: Latin America Submarine Industry Revenue Share (%), by Country 2024 & 2032
- Figure 10: Middle East and Africa Submarine Industry Revenue (Million), by Country 2024 & 2032
- Figure 11: Middle East and Africa Submarine Industry Revenue Share (%), by Country 2024 & 2032
- Figure 12: North America Submarine Industry Revenue (Million), by Production Analysis 2024 & 2032
- Figure 13: North America Submarine Industry Revenue Share (%), by Production Analysis 2024 & 2032
- Figure 14: North America Submarine Industry Revenue (Million), by Consumption Analysis 2024 & 2032
- Figure 15: North America Submarine Industry Revenue Share (%), by Consumption Analysis 2024 & 2032
- Figure 16: North America Submarine Industry Revenue (Million), by Import Market Analysis (Value & Volume) 2024 & 2032
- Figure 17: North America Submarine Industry Revenue Share (%), by Import Market Analysis (Value & Volume) 2024 & 2032
- Figure 18: North America Submarine Industry Revenue (Million), by Export Market Analysis (Value & Volume) 2024 & 2032
- Figure 19: North America Submarine Industry Revenue Share (%), by Export Market Analysis (Value & Volume) 2024 & 2032
- Figure 20: North America Submarine Industry Revenue (Million), by Price Trend Analysis 2024 & 2032
- Figure 21: North America Submarine Industry Revenue Share (%), by Price Trend Analysis 2024 & 2032
- Figure 22: North America Submarine Industry Revenue (Million), by Country 2024 & 2032
- Figure 23: North America Submarine Industry Revenue Share (%), by Country 2024 & 2032
- Figure 24: South America Submarine Industry Revenue (Million), by Production Analysis 2024 & 2032
- Figure 25: South America Submarine Industry Revenue Share (%), by Production Analysis 2024 & 2032
- Figure 26: South America Submarine Industry Revenue (Million), by Consumption Analysis 2024 & 2032
- Figure 27: South America Submarine Industry Revenue Share (%), by Consumption Analysis 2024 & 2032
- Figure 28: South America Submarine Industry Revenue (Million), by Import Market Analysis (Value & Volume) 2024 & 2032
- Figure 29: South America Submarine Industry Revenue Share (%), by Import Market Analysis (Value & Volume) 2024 & 2032
- Figure 30: South America Submarine Industry Revenue (Million), by Export Market Analysis (Value & Volume) 2024 & 2032
- Figure 31: South America Submarine Industry Revenue Share (%), by Export Market Analysis (Value & Volume) 2024 & 2032
- Figure 32: South America Submarine Industry Revenue (Million), by Price Trend Analysis 2024 & 2032
- Figure 33: South America Submarine Industry Revenue Share (%), by Price Trend Analysis 2024 & 2032
- Figure 34: South America Submarine Industry Revenue (Million), by Country 2024 & 2032
- Figure 35: South America Submarine Industry Revenue Share (%), by Country 2024 & 2032
- Figure 36: Europe Submarine Industry Revenue (Million), by Production Analysis 2024 & 2032
- Figure 37: Europe Submarine Industry Revenue Share (%), by Production Analysis 2024 & 2032
- Figure 38: Europe Submarine Industry Revenue (Million), by Consumption Analysis 2024 & 2032
- Figure 39: Europe Submarine Industry Revenue Share (%), by Consumption Analysis 2024 & 2032
- Figure 40: Europe Submarine Industry Revenue (Million), by Import Market Analysis (Value & Volume) 2024 & 2032
- Figure 41: Europe Submarine Industry Revenue Share (%), by Import Market Analysis (Value & Volume) 2024 & 2032
- Figure 42: Europe Submarine Industry Revenue (Million), by Export Market Analysis (Value & Volume) 2024 & 2032
- Figure 43: Europe Submarine Industry Revenue Share (%), by Export Market Analysis (Value & Volume) 2024 & 2032
- Figure 44: Europe Submarine Industry Revenue (Million), by Price Trend Analysis 2024 & 2032
- Figure 45: Europe Submarine Industry Revenue Share (%), by Price Trend Analysis 2024 & 2032
- Figure 46: Europe Submarine Industry Revenue (Million), by Country 2024 & 2032
- Figure 47: Europe Submarine Industry Revenue Share (%), by Country 2024 & 2032
- Figure 48: Middle East & Africa Submarine Industry Revenue (Million), by Production Analysis 2024 & 2032
- Figure 49: Middle East & Africa Submarine Industry Revenue Share (%), by Production Analysis 2024 & 2032
- Figure 50: Middle East & Africa Submarine Industry Revenue (Million), by Consumption Analysis 2024 & 2032
- Figure 51: Middle East & Africa Submarine Industry Revenue Share (%), by Consumption Analysis 2024 & 2032
- Figure 52: Middle East & Africa Submarine Industry Revenue (Million), by Import Market Analysis (Value & Volume) 2024 & 2032
- Figure 53: Middle East & Africa Submarine Industry Revenue Share (%), by Import Market Analysis (Value & Volume) 2024 & 2032
- Figure 54: Middle East & Africa Submarine Industry Revenue (Million), by Export Market Analysis (Value & Volume) 2024 & 2032
- Figure 55: Middle East & Africa Submarine Industry Revenue Share (%), by Export Market Analysis (Value & Volume) 2024 & 2032
- Figure 56: Middle East & Africa Submarine Industry Revenue (Million), by Price Trend Analysis 2024 & 2032
- Figure 57: Middle East & Africa Submarine Industry Revenue Share (%), by Price Trend Analysis 2024 & 2032
- Figure 58: Middle East & Africa Submarine Industry Revenue (Million), by Country 2024 & 2032
- Figure 59: Middle East & Africa Submarine Industry Revenue Share (%), by Country 2024 & 2032
- Figure 60: Asia Pacific Submarine Industry Revenue (Million), by Production Analysis 2024 & 2032
- Figure 61: Asia Pacific Submarine Industry Revenue Share (%), by Production Analysis 2024 & 2032
- Figure 62: Asia Pacific Submarine Industry Revenue (Million), by Consumption Analysis 2024 & 2032
- Figure 63: Asia Pacific Submarine Industry Revenue Share (%), by Consumption Analysis 2024 & 2032
- Figure 64: Asia Pacific Submarine Industry Revenue (Million), by Import Market Analysis (Value & Volume) 2024 & 2032
- Figure 65: Asia Pacific Submarine Industry Revenue Share (%), by Import Market Analysis (Value & Volume) 2024 & 2032
- Figure 66: Asia Pacific Submarine Industry Revenue (Million), by Export Market Analysis (Value & Volume) 2024 & 2032
- Figure 67: Asia Pacific Submarine Industry Revenue Share (%), by Export Market Analysis (Value & Volume) 2024 & 2032
- Figure 68: Asia Pacific Submarine Industry Revenue (Million), by Price Trend Analysis 2024 & 2032
- Figure 69: Asia Pacific Submarine Industry Revenue Share (%), by Price Trend Analysis 2024 & 2032
- Figure 70: Asia Pacific Submarine Industry Revenue (Million), by Country 2024 & 2032
- Figure 71: Asia Pacific Submarine Industry Revenue Share (%), by Country 2024 & 2032
List of Tables
- Table 1: Global Submarine Industry Revenue Million Forecast, by Region 2019 & 2032
- Table 2: Global Submarine Industry Revenue Million Forecast, by Production Analysis 2019 & 2032
- Table 3: Global Submarine Industry Revenue Million Forecast, by Consumption Analysis 2019 & 2032
- Table 4: Global Submarine Industry Revenue Million Forecast, by Import Market Analysis (Value & Volume) 2019 & 2032
- Table 5: Global Submarine Industry Revenue Million Forecast, by Export Market Analysis (Value & Volume) 2019 & 2032
- Table 6: Global Submarine Industry Revenue Million Forecast, by Price Trend Analysis 2019 & 2032
- Table 7: Global Submarine Industry Revenue Million Forecast, by Region 2019 & 2032
- Table 8: Global Submarine Industry Revenue Million Forecast, by Country 2019 & 2032
- Table 9: United States Submarine Industry Revenue (Million) Forecast, by Application 2019 & 2032
- Table 10: Canada Submarine Industry Revenue (Million) Forecast, by Application 2019 & 2032
- Table 11: Global Submarine Industry Revenue Million Forecast, by Country 2019 & 2032
- Table 12: Germany Submarine Industry Revenue (Million) Forecast, by Application 2019 & 2032
- Table 13: United Kingdom Submarine Industry Revenue (Million) Forecast, by Application 2019 & 2032
- Table 14: France Submarine Industry Revenue (Million) Forecast, by Application 2019 & 2032
- Table 15: Rest of Europe Submarine Industry Revenue (Million) Forecast, by Application 2019 & 2032
- Table 16: Global Submarine Industry Revenue Million Forecast, by Country 2019 & 2032
- Table 17: China Submarine Industry Revenue (Million) Forecast, by Application 2019 & 2032
- Table 18: India Submarine Industry Revenue (Million) Forecast, by Application 2019 & 2032
- Table 19: Japan Submarine Industry Revenue (Million) Forecast, by Application 2019 & 2032
- Table 20: Australia Submarine Industry Revenue (Million) Forecast, by Application 2019 & 2032
- Table 21: Rest of Asia Pacific Submarine Industry Revenue (Million) Forecast, by Application 2019 & 2032
- Table 22: Global Submarine Industry Revenue Million Forecast, by Country 2019 & 2032
- Table 23: Brazil Submarine Industry Revenue (Million) Forecast, by Application 2019 & 2032
- Table 24: Rest of Latin America Submarine Industry Revenue (Million) Forecast, by Application 2019 & 2032
- Table 25: Global Submarine Industry Revenue Million Forecast, by Country 2019 & 2032
- Table 26: South Africa Submarine Industry Revenue (Million) Forecast, by Application 2019 & 2032
- Table 27: Rest of Middle East and Africa Submarine Industry Revenue (Million) Forecast, by Application 2019 & 2032
- Table 28: Global Submarine Industry Revenue Million Forecast, by Production Analysis 2019 & 2032
- Table 29: Global Submarine Industry Revenue Million Forecast, by Consumption Analysis 2019 & 2032
- Table 30: Global Submarine Industry Revenue Million Forecast, by Import Market Analysis (Value & Volume) 2019 & 2032
- Table 31: Global Submarine Industry Revenue Million Forecast, by Export Market Analysis (Value & Volume) 2019 & 2032
- Table 32: Global Submarine Industry Revenue Million Forecast, by Price Trend Analysis 2019 & 2032
- Table 33: Global Submarine Industry Revenue Million Forecast, by Country 2019 & 2032
- Table 34: United States Submarine Industry Revenue (Million) Forecast, by Application 2019 & 2032
- Table 35: Canada Submarine Industry Revenue (Million) Forecast, by Application 2019 & 2032
- Table 36: Mexico Submarine Industry Revenue (Million) Forecast, by Application 2019 & 2032
- Table 37: Global Submarine Industry Revenue Million Forecast, by Production Analysis 2019 & 2032
- Table 38: Global Submarine Industry Revenue Million Forecast, by Consumption Analysis 2019 & 2032
- Table 39: Global Submarine Industry Revenue Million Forecast, by Import Market Analysis (Value & Volume) 2019 & 2032
- Table 40: Global Submarine Industry Revenue Million Forecast, by Export Market Analysis (Value & Volume) 2019 & 2032
- Table 41: Global Submarine Industry Revenue Million Forecast, by Price Trend Analysis 2019 & 2032
- Table 42: Global Submarine Industry Revenue Million Forecast, by Country 2019 & 2032
- Table 43: Brazil Submarine Industry Revenue (Million) Forecast, by Application 2019 & 2032
- Table 44: Argentina Submarine Industry Revenue (Million) Forecast, by Application 2019 & 2032
- Table 45: Rest of South America Submarine Industry Revenue (Million) Forecast, by Application 2019 & 2032
- Table 46: Global Submarine Industry Revenue Million Forecast, by Production Analysis 2019 & 2032
- Table 47: Global Submarine Industry Revenue Million Forecast, by Consumption Analysis 2019 & 2032
- Table 48: Global Submarine Industry Revenue Million Forecast, by Import Market Analysis (Value & Volume) 2019 & 2032
- Table 49: Global Submarine Industry Revenue Million Forecast, by Export Market Analysis (Value & Volume) 2019 & 2032
- Table 50: Global Submarine Industry Revenue Million Forecast, by Price Trend Analysis 2019 & 2032
- Table 51: Global Submarine Industry Revenue Million Forecast, by Country 2019 & 2032
- Table 52: United Kingdom Submarine Industry Revenue (Million) Forecast, by Application 2019 & 2032
- Table 53: Germany Submarine Industry Revenue (Million) Forecast, by Application 2019 & 2032
- Table 54: France Submarine Industry Revenue (Million) Forecast, by Application 2019 & 2032
- Table 55: Italy Submarine Industry Revenue (Million) Forecast, by Application 2019 & 2032
- Table 56: Spain Submarine Industry Revenue (Million) Forecast, by Application 2019 & 2032
- Table 57: Russia Submarine Industry Revenue (Million) Forecast, by Application 2019 & 2032
- Table 58: Benelux Submarine Industry Revenue (Million) Forecast, by Application 2019 & 2032
- Table 59: Nordics Submarine Industry Revenue (Million) Forecast, by Application 2019 & 2032
- Table 60: Rest of Europe Submarine Industry Revenue (Million) Forecast, by Application 2019 & 2032
- Table 61: Global Submarine Industry Revenue Million Forecast, by Production Analysis 2019 & 2032
- Table 62: Global Submarine Industry Revenue Million Forecast, by Consumption Analysis 2019 & 2032
- Table 63: Global Submarine Industry Revenue Million Forecast, by Import Market Analysis (Value & Volume) 2019 & 2032
- Table 64: Global Submarine Industry Revenue Million Forecast, by Export Market Analysis (Value & Volume) 2019 & 2032
- Table 65: Global Submarine Industry Revenue Million Forecast, by Price Trend Analysis 2019 & 2032
- Table 66: Global Submarine Industry Revenue Million Forecast, by Country 2019 & 2032
- Table 67: Turkey Submarine Industry Revenue (Million) Forecast, by Application 2019 & 2032
- Table 68: Israel Submarine Industry Revenue (Million) Forecast, by Application 2019 & 2032
- Table 69: GCC Submarine Industry Revenue (Million) Forecast, by Application 2019 & 2032
- Table 70: North Africa Submarine Industry Revenue (Million) Forecast, by Application 2019 & 2032
- Table 71: South Africa Submarine Industry Revenue (Million) Forecast, by Application 2019 & 2032
- Table 72: Rest of Middle East & Africa Submarine Industry Revenue (Million) Forecast, by Application 2019 & 2032
- Table 73: Global Submarine Industry Revenue Million Forecast, by Production Analysis 2019 & 2032
- Table 74: Global Submarine Industry Revenue Million Forecast, by Consumption Analysis 2019 & 2032
- Table 75: Global Submarine Industry Revenue Million Forecast, by Import Market Analysis (Value & Volume) 2019 & 2032
- Table 76: Global Submarine Industry Revenue Million Forecast, by Export Market Analysis (Value & Volume) 2019 & 2032
- Table 77: Global Submarine Industry Revenue Million Forecast, by Price Trend Analysis 2019 & 2032
- Table 78: Global Submarine Industry Revenue Million Forecast, by Country 2019 & 2032
- Table 79: China Submarine Industry Revenue (Million) Forecast, by Application 2019 & 2032
- Table 80: India Submarine Industry Revenue (Million) Forecast, by Application 2019 & 2032
- Table 81: Japan Submarine Industry Revenue (Million) Forecast, by Application 2019 & 2032
- Table 82: South Korea Submarine Industry Revenue (Million) Forecast, by Application 2019 & 2032
- Table 83: ASEAN Submarine Industry Revenue (Million) Forecast, by Application 2019 & 2032
- Table 84: Oceania Submarine Industry Revenue (Million) Forecast, by Application 2019 & 2032
- Table 85: Rest of Asia Pacific Submarine Industry Revenue (Million) Forecast, by Application 2019 & 2032
Frequently Asked Questions
1. What is the projected Compound Annual Growth Rate (CAGR) of the Submarine Industry?
The projected CAGR is approximately > 4.00%.
2. Which companies are prominent players in the Submarine Industry?
Key companies in the market include General Dynamics Corporation, Naval Group, FINCANTIERI S p A, HD Hyundai Heavy Industries, thyssenkrupp AG, Daewoo Shipbuilding & Marine Engineering Co Ltd, Huntington Ingalls Industries Inc, Navantia S A SM E, BAE Systems plc, United Shipbuilding Corporation, Saab AB, Mitsubishi Heavy Industries Ltd.
3. What are the main segments of the Submarine Industry?
The market segments include Production Analysis, Consumption Analysis, Import Market Analysis (Value & Volume), Export Market Analysis (Value & Volume), Price Trend Analysis.
4. Can you provide details about the market size?
The market size is estimated to be USD XX Million as of 2022.
5. What are some drivers contributing to market growth?
Increase in Internet of Things (IoT) and Autonomous Systems; Rise in Demand for Military and Defense Satellite Communication Solutions.
6. What are the notable trends driving market growth?
Nuclear-Powered Submarines (SSN) Segment Is Anticipated to Grow with the Highest CAGR During the Forecast Period.
7. Are there any restraints impacting market growth?
Cybersecurity Threats to Satellite Communication; Interference in Transmission of Data.
8. Can you provide examples of recent developments in the market?
December 2022: Indian shipbuilder Mazagon Dock Limited (MDL) announced that they delivered "Vagir," the fifth Scorpene-type submarine (Kalvari-class), to the Indian Navy.
9. What pricing options are available for accessing the report?
Pricing options include single-user, multi-user, and enterprise licenses priced at USD 4750, USD 5250, and USD 8750 respectively.
10. Is the market size provided in terms of value or volume?
The market size is provided in terms of value, measured in Million.
11. Are there any specific market keywords associated with the report?
Yes, the market keyword associated with the report is "Submarine Industry," which aids in identifying and referencing the specific market segment covered.
12. How do I determine which pricing option suits my needs best?
The pricing options vary based on user requirements and access needs. Individual users may opt for single-user licenses, while businesses requiring broader access may choose multi-user or enterprise licenses for cost-effective access to the report.
13. Are there any additional resources or data provided in the Submarine Industry report?
While the report offers comprehensive insights, it's advisable to review the specific contents or supplementary materials provided to ascertain if additional resources or data are available.
14. How can I stay updated on further developments or reports in the Submarine Industry?
To stay informed about further developments, trends, and reports in the Submarine Industry, consider subscribing to industry newsletters, following relevant companies and organizations, or regularly checking reputable industry news sources and publications.
Methodology
Step 1 - Identification of Relevant Samples Size from Population Database


Step 2 - Approaches for Defining Global Market Size (Value, Volume* & Price*)

Note*: In applicable scenarios
Step 3 - Data Sources
Primary Research
- Web Analytics
- Survey Reports
- Research Institute
- Latest Research Reports
- Opinion Leaders
Secondary Research
- Annual Reports
- White Paper
- Latest Press Release
- Industry Association
- Paid Database
- Investor Presentations

Step 4 - Data Triangulation
Involves using different sources of information in order to increase the validity of a study
These sources are likely to be stakeholders in a program - participants, other researchers, program staff, other community members, and so on.
Then we put all data in single framework & apply various statistical tools to find out the dynamic on the market.
During the analysis stage, feedback from the stakeholder groups would be compared to determine areas of agreement as well as areas of divergence
