

Key Insights
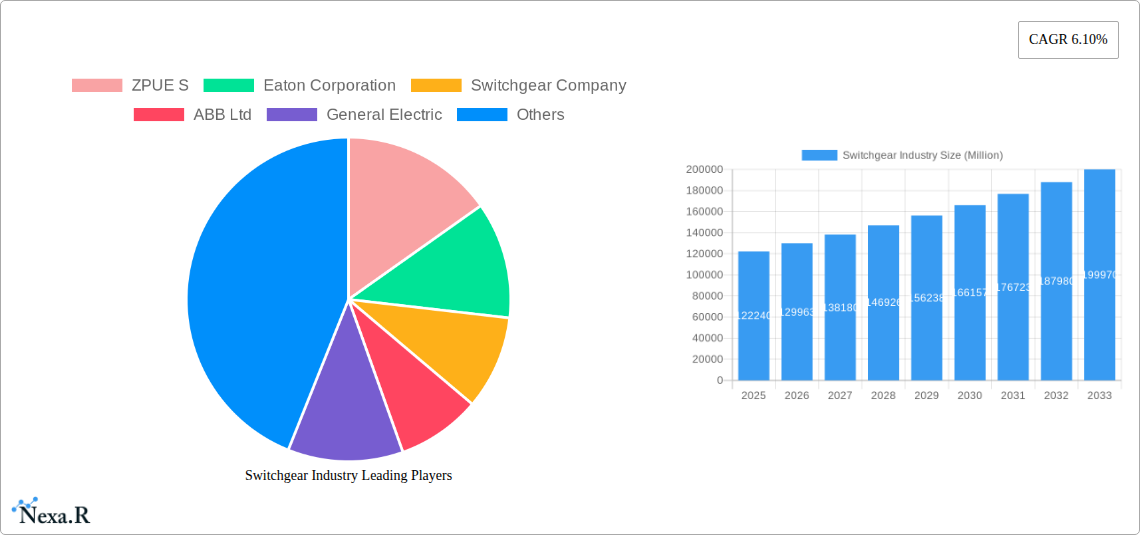
The global switchgear market, valued at $122.24 billion in 2025, is projected to experience robust growth, driven by the increasing demand for reliable and efficient power distribution across various sectors. A Compound Annual Growth Rate (CAGR) of 6.10% from 2025 to 2033 indicates a significant expansion, fueled by several key factors. The rising adoption of renewable energy sources, coupled with the expansion of smart grids and the growing industrial automation sector, is significantly boosting market demand. Furthermore, stringent government regulations regarding electrical safety and energy efficiency are compelling businesses to upgrade their existing switchgear infrastructure, creating a substantial market opportunity. The market segmentation reveals a strong emphasis on high-voltage insulation within the type segment, reflecting the crucial role of switchgear in managing high-power applications. Similarly, the industrial end-user segment dominates, underscoring the reliance on robust switchgear solutions in manufacturing and heavy industries. Geographical analysis shows considerable growth potential across emerging economies in Asia, driven by rapid industrialization and infrastructure development, while North America and Europe are expected to maintain steady growth driven by upgrades and modernization. Competition is intense, with major players like ABB, Siemens, and Eaton vying for market share through technological innovation and strategic partnerships.
The competitive landscape is characterized by both established global players and regional manufacturers. Established companies leverage their extensive experience and global reach to maintain their market share, while smaller, specialized companies focus on niche applications or specific geographical regions. Technological advancements, such as the integration of digital technologies and the development of smart switchgear, are reshaping the market. These advancements improve efficiency, enhance monitoring capabilities, and facilitate predictive maintenance, leading to cost savings and reduced downtime. However, challenges such as high initial investment costs for advanced switchgear and concerns about cybersecurity for smart grids may act as potential restraints. Nevertheless, the long-term growth prospects for the switchgear market remain positive, driven by consistent demand for reliable and efficient power management solutions across industries and geographies.
Switchgear Industry Market Report: 2019-2033
This comprehensive report provides an in-depth analysis of the global switchgear industry, encompassing market dynamics, growth trends, competitive landscape, and future outlook. The report covers the period from 2019 to 2033, with a focus on the 2025 market. Key segments analyzed include voltage (high-voltage and other insulation types), installation methods, and end-user industries (commercial, residential, and industrial). Market values are presented in million units.
Switchgear Industry Market Dynamics & Structure
The global switchgear market is characterized by moderate concentration, with several major players holding significant market share. Technological innovation, driven by the increasing demand for smart grids and renewable energy integration, is a key driver. Stringent regulatory frameworks concerning safety and environmental standards significantly influence market dynamics. Competitive pressures stem from the availability of substitute technologies and continuous product advancements. End-user demographics, particularly the growth of industrial and commercial sectors, fuel market expansion. M&A activities in the industry have been relatively stable in recent years, with xx deals recorded between 2019 and 2024, representing a total transaction value of xx million units.
- Market Concentration: Moderately concentrated, with top 5 players holding approximately xx% market share in 2024.
- Technological Innovation: Focus on smart switchgear, digitalization, and eco-friendly designs.
- Regulatory Landscape: Stringent safety and environmental regulations impacting product design and manufacturing.
- Competitive Substitutes: Limited, but advancements in alternative technologies pose a potential threat.
- M&A Activity: xx deals between 2019-2024, valued at approximately xx million units.
Switchgear Industry Growth Trends & Insights
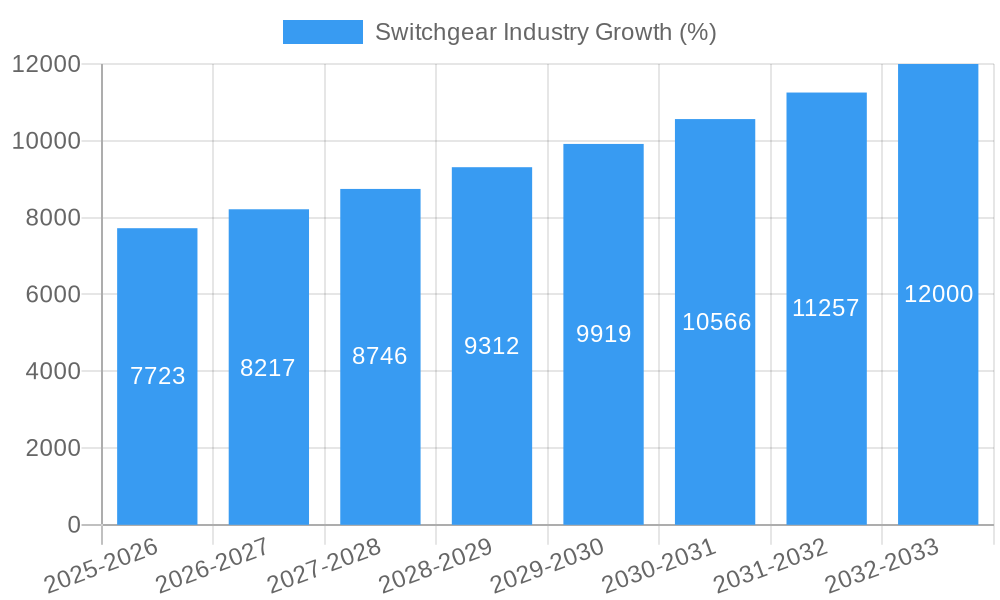
The global switchgear market exhibited a CAGR of xx% during the historical period (2019-2024), reaching a market size of xx million units in 2024. The market is projected to grow at a CAGR of xx% during the forecast period (2025-2033), driven by factors including increasing infrastructure development, rising energy demand, and the growing adoption of renewable energy sources. Technological advancements, such as the integration of digital technologies and smart sensors, are significantly impacting market growth. Consumer behavior shifts towards energy efficiency and sustainability are also propelling market adoption. Market penetration is expected to reach xx% by 2033.
Dominant Regions, Countries, or Segments in Switchgear Industry
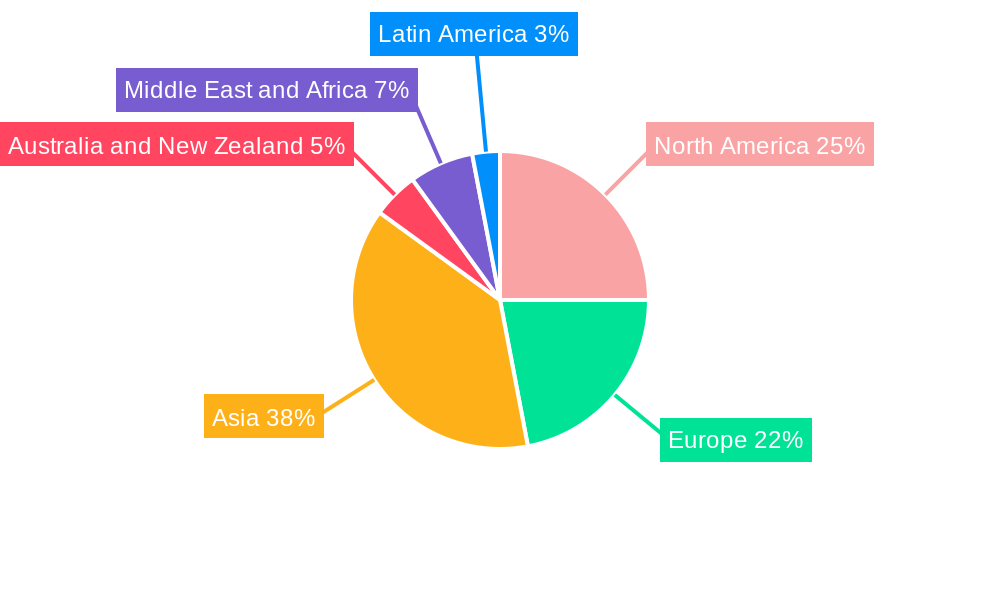
The Asia-Pacific region dominated the switchgear market in 2024, holding approximately xx% market share, primarily driven by rapid infrastructure development and industrialization in countries like China and India. Within the segments, high-voltage switchgear accounted for a larger market share compared to other voltage categories, owing to its crucial role in power transmission and distribution. The industrial end-user segment also exhibited strong growth, driven by the increasing demand for reliable power solutions in various industries.
- Key Drivers (Asia-Pacific): Rapid infrastructure development, industrialization, and increasing energy demand.
- Key Drivers (High-Voltage Segment): Essential role in power transmission and distribution networks.
- Key Drivers (Industrial End-User): Strong demand for reliable power solutions across various industries.
Switchgear Industry Product Landscape
Switchgear products are increasingly incorporating advanced features like digital monitoring, remote control capabilities, and enhanced safety mechanisms. Innovative designs focus on improving efficiency, reliability, and sustainability. Key selling propositions include improved lifecycle management, reduced downtime, and enhanced grid stability. Technological advancements are focused on incorporating AI, IoT, and cloud-based technologies for predictive maintenance and optimized grid management.
Key Drivers, Barriers & Challenges in Switchgear Industry
Key Drivers:
- Increasing demand for renewable energy integration.
- Growth of smart grids and digitalization.
- Stringent safety and environmental regulations.
- Rising industrialization and infrastructure development.
Key Challenges:
- Supply chain disruptions leading to material cost increases (estimated impact: xx% increase in production costs in 2024).
- Intense competition and price pressures.
- Regulatory hurdles and compliance requirements.
Emerging Opportunities in Switchgear Industry
- Growing demand for smart and eco-friendly switchgear in emerging economies.
- Increasing adoption of renewable energy technologies.
- Expanding applications in data centers and electric vehicle charging infrastructure.
- Development of innovative solutions for microgrids and distributed energy resources.
Growth Accelerators in the Switchgear Industry
The switchgear industry's long-term growth is poised to be accelerated by ongoing technological innovation, particularly in digitalization and sustainability. Strategic partnerships between manufacturers and utilities are key, driving the adoption of next-generation switchgear solutions. Expansion into emerging markets and diversification of product portfolios will further propel market growth.
Key Players Shaping the Switchgear Industry Market
- ZPUE S.A.
- Eaton Corporation
- Switchgear Company
- ABB Ltd
- General Electric
- Orecco Electric
- Fuji Electric Co Ltd
- Crompton Greaves Power and Industrial Solutions Limited
- Toshiba International Corporation
- Hubbell Incorporated
- Hitachi Ltd
- Mitsubishi Electric Corporation
- Siemens AG
- Schneider Electric SE
- Powell Industries Inc
- Meidensha Corporation
- Havells India Limited
Notable Milestones in Switchgear Industry Sector
- October 2023: Siemens Smart Infrastructure launched eco-friendly, digital medium-voltage switchgear, promoting sustainable grids.
- February 2024: Schneider Electric introduced SureSeT MV switchgear for the Canadian market, enhancing digital capabilities and minimizing downtime.
In-Depth Switchgear Industry Market Outlook
The future of the switchgear industry is bright, driven by the increasing need for reliable, efficient, and sustainable power solutions. Strategic investments in research and development, coupled with the adoption of innovative technologies, will unlock significant growth potential. Expanding into emerging markets and focusing on niche applications will further strengthen market positions. The long-term outlook suggests a sustained period of growth, driven by the ongoing global transition to cleaner energy and the increasing adoption of smart grid technologies.
Switchgear Industry Segmentation
-
1. Type
-
1.1. Voltage
- 1.1.1. Low-voltage
- 1.1.2. Medium-voltage
- 1.1.3. High-voltage
-
1.2. Insulation
- 1.2.1. Gas -insulated Switchgear (GIS)
- 1.2.2. Air-insulated Switchgear (AIS)
- 1.2.3. Other Insulation Types
-
1.3. Installation
- 1.3.1. Indoor
- 1.3.2. Outdoor
-
1.1. Voltage
-
2. End-user Industry
- 2.1. Commercial
- 2.2. Residential
- 2.3. Industrial
Switchgear Industry Segmentation By Geography
- 1. North America
- 2. Europe
- 3. Asia
- 4. Australia and New Zealand
- 5. Middle East and Africa
- 6. Latin America
Switchgear Industry REPORT HIGHLIGHTS
| Aspects | Details |
|---|---|
| Study Period | 2019-2033 |
| Base Year | 2024 |
| Estimated Year | 2025 |
| Forecast Period | 2025-2033 |
| Historical Period | 2019-2024 |
| Growth Rate | CAGR of 6.10% from 2019-2033 |
| Segmentation |
|
Table of Contents
- 1. Introduction
- 1.1. Research Scope
- 1.2. Market Segmentation
- 1.3. Research Methodology
- 1.4. Definitions and Assumptions
- 2. Executive Summary
- 2.1. Introduction
- 3. Market Dynamics
- 3.1. Introduction
- 3.2. Market Drivers
- 3.2.1. Growth of Smart Electricity Grid Infrastructure; Growing Focus on Infrastructure and Renewable Energy Sources; Increased Investment in Industrial Production
- 3.3. Market Restrains
- 3.3.1. Stringent Environmental and Safety Regulations; Increasing Competition from the Unorganized Sectors
- 3.4. Market Trends
- 3.4.1. The Residential Segment to Witness a Significant Growth
- 4. Market Factor Analysis
- 4.1. Porters Five Forces
- 4.2. Supply/Value Chain
- 4.3. PESTEL analysis
- 4.4. Market Entropy
- 4.5. Patent/Trademark Analysis
- 5. Global Switchgear Industry Analysis, Insights and Forecast, 2019-2031
- 5.1. Market Analysis, Insights and Forecast - by Type
- 5.1.1. Voltage
- 5.1.1.1. Low-voltage
- 5.1.1.2. Medium-voltage
- 5.1.1.3. High-voltage
- 5.1.2. Insulation
- 5.1.2.1. Gas -insulated Switchgear (GIS)
- 5.1.2.2. Air-insulated Switchgear (AIS)
- 5.1.2.3. Other Insulation Types
- 5.1.3. Installation
- 5.1.3.1. Indoor
- 5.1.3.2. Outdoor
- 5.1.1. Voltage
- 5.2. Market Analysis, Insights and Forecast - by End-user Industry
- 5.2.1. Commercial
- 5.2.2. Residential
- 5.2.3. Industrial
- 5.3. Market Analysis, Insights and Forecast - by Region
- 5.3.1. North America
- 5.3.2. Europe
- 5.3.3. Asia
- 5.3.4. Australia and New Zealand
- 5.3.5. Middle East and Africa
- 5.3.6. Latin America
- 5.1. Market Analysis, Insights and Forecast - by Type
- 6. North America Switchgear Industry Analysis, Insights and Forecast, 2019-2031
- 6.1. Market Analysis, Insights and Forecast - by Type
- 6.1.1. Voltage
- 6.1.1.1. Low-voltage
- 6.1.1.2. Medium-voltage
- 6.1.1.3. High-voltage
- 6.1.2. Insulation
- 6.1.2.1. Gas -insulated Switchgear (GIS)
- 6.1.2.2. Air-insulated Switchgear (AIS)
- 6.1.2.3. Other Insulation Types
- 6.1.3. Installation
- 6.1.3.1. Indoor
- 6.1.3.2. Outdoor
- 6.1.1. Voltage
- 6.2. Market Analysis, Insights and Forecast - by End-user Industry
- 6.2.1. Commercial
- 6.2.2. Residential
- 6.2.3. Industrial
- 6.1. Market Analysis, Insights and Forecast - by Type
- 7. Europe Switchgear Industry Analysis, Insights and Forecast, 2019-2031
- 7.1. Market Analysis, Insights and Forecast - by Type
- 7.1.1. Voltage
- 7.1.1.1. Low-voltage
- 7.1.1.2. Medium-voltage
- 7.1.1.3. High-voltage
- 7.1.2. Insulation
- 7.1.2.1. Gas -insulated Switchgear (GIS)
- 7.1.2.2. Air-insulated Switchgear (AIS)
- 7.1.2.3. Other Insulation Types
- 7.1.3. Installation
- 7.1.3.1. Indoor
- 7.1.3.2. Outdoor
- 7.1.1. Voltage
- 7.2. Market Analysis, Insights and Forecast - by End-user Industry
- 7.2.1. Commercial
- 7.2.2. Residential
- 7.2.3. Industrial
- 7.1. Market Analysis, Insights and Forecast - by Type
- 8. Asia Switchgear Industry Analysis, Insights and Forecast, 2019-2031
- 8.1. Market Analysis, Insights and Forecast - by Type
- 8.1.1. Voltage
- 8.1.1.1. Low-voltage
- 8.1.1.2. Medium-voltage
- 8.1.1.3. High-voltage
- 8.1.2. Insulation
- 8.1.2.1. Gas -insulated Switchgear (GIS)
- 8.1.2.2. Air-insulated Switchgear (AIS)
- 8.1.2.3. Other Insulation Types
- 8.1.3. Installation
- 8.1.3.1. Indoor
- 8.1.3.2. Outdoor
- 8.1.1. Voltage
- 8.2. Market Analysis, Insights and Forecast - by End-user Industry
- 8.2.1. Commercial
- 8.2.2. Residential
- 8.2.3. Industrial
- 8.1. Market Analysis, Insights and Forecast - by Type
- 9. Australia and New Zealand Switchgear Industry Analysis, Insights and Forecast, 2019-2031
- 9.1. Market Analysis, Insights and Forecast - by Type
- 9.1.1. Voltage
- 9.1.1.1. Low-voltage
- 9.1.1.2. Medium-voltage
- 9.1.1.3. High-voltage
- 9.1.2. Insulation
- 9.1.2.1. Gas -insulated Switchgear (GIS)
- 9.1.2.2. Air-insulated Switchgear (AIS)
- 9.1.2.3. Other Insulation Types
- 9.1.3. Installation
- 9.1.3.1. Indoor
- 9.1.3.2. Outdoor
- 9.1.1. Voltage
- 9.2. Market Analysis, Insights and Forecast - by End-user Industry
- 9.2.1. Commercial
- 9.2.2. Residential
- 9.2.3. Industrial
- 9.1. Market Analysis, Insights and Forecast - by Type
- 10. Middle East and Africa Switchgear Industry Analysis, Insights and Forecast, 2019-2031
- 10.1. Market Analysis, Insights and Forecast - by Type
- 10.1.1. Voltage
- 10.1.1.1. Low-voltage
- 10.1.1.2. Medium-voltage
- 10.1.1.3. High-voltage
- 10.1.2. Insulation
- 10.1.2.1. Gas -insulated Switchgear (GIS)
- 10.1.2.2. Air-insulated Switchgear (AIS)
- 10.1.2.3. Other Insulation Types
- 10.1.3. Installation
- 10.1.3.1. Indoor
- 10.1.3.2. Outdoor
- 10.1.1. Voltage
- 10.2. Market Analysis, Insights and Forecast - by End-user Industry
- 10.2.1. Commercial
- 10.2.2. Residential
- 10.2.3. Industrial
- 10.1. Market Analysis, Insights and Forecast - by Type
- 11. Latin America Switchgear Industry Analysis, Insights and Forecast, 2019-2031
- 11.1. Market Analysis, Insights and Forecast - by Type
- 11.1.1. Voltage
- 11.1.1.1. Low-voltage
- 11.1.1.2. Medium-voltage
- 11.1.1.3. High-voltage
- 11.1.2. Insulation
- 11.1.2.1. Gas -insulated Switchgear (GIS)
- 11.1.2.2. Air-insulated Switchgear (AIS)
- 11.1.2.3. Other Insulation Types
- 11.1.3. Installation
- 11.1.3.1. Indoor
- 11.1.3.2. Outdoor
- 11.1.1. Voltage
- 11.2. Market Analysis, Insights and Forecast - by End-user Industry
- 11.2.1. Commercial
- 11.2.2. Residential
- 11.2.3. Industrial
- 11.1. Market Analysis, Insights and Forecast - by Type
- 12. North America Switchgear Industry Analysis, Insights and Forecast, 2019-2031
- 12.1. Market Analysis, Insights and Forecast - By Country/Sub-region
- 12.1.1.
- 13. Europe Switchgear Industry Analysis, Insights and Forecast, 2019-2031
- 13.1. Market Analysis, Insights and Forecast - By Country/Sub-region
- 13.1.1.
- 14. Asia Switchgear Industry Analysis, Insights and Forecast, 2019-2031
- 14.1. Market Analysis, Insights and Forecast - By Country/Sub-region
- 14.1.1.
- 15. Australia and New Zealand Switchgear Industry Analysis, Insights and Forecast, 2019-2031
- 15.1. Market Analysis, Insights and Forecast - By Country/Sub-region
- 15.1.1.
- 16. Middle East and Africa Switchgear Industry Analysis, Insights and Forecast, 2019-2031
- 16.1. Market Analysis, Insights and Forecast - By Country/Sub-region
- 16.1.1.
- 17. Latin America Switchgear Industry Analysis, Insights and Forecast, 2019-2031
- 17.1. Market Analysis, Insights and Forecast - By Country/Sub-region
- 17.1.1.
- 18. Competitive Analysis
- 18.1. Global Market Share Analysis 2024
- 18.2. Company Profiles
- 18.2.1 ZPUE S
- 18.2.1.1. Overview
- 18.2.1.2. Products
- 18.2.1.3. SWOT Analysis
- 18.2.1.4. Recent Developments
- 18.2.1.5. Financials (Based on Availability)
- 18.2.2 Eaton Corporation
- 18.2.2.1. Overview
- 18.2.2.2. Products
- 18.2.2.3. SWOT Analysis
- 18.2.2.4. Recent Developments
- 18.2.2.5. Financials (Based on Availability)
- 18.2.3 Switchgear Company
- 18.2.3.1. Overview
- 18.2.3.2. Products
- 18.2.3.3. SWOT Analysis
- 18.2.3.4. Recent Developments
- 18.2.3.5. Financials (Based on Availability)
- 18.2.4 ABB Ltd
- 18.2.4.1. Overview
- 18.2.4.2. Products
- 18.2.4.3. SWOT Analysis
- 18.2.4.4. Recent Developments
- 18.2.4.5. Financials (Based on Availability)
- 18.2.5 General Electric
- 18.2.5.1. Overview
- 18.2.5.2. Products
- 18.2.5.3. SWOT Analysis
- 18.2.5.4. Recent Developments
- 18.2.5.5. Financials (Based on Availability)
- 18.2.6 Orecco Electric
- 18.2.6.1. Overview
- 18.2.6.2. Products
- 18.2.6.3. SWOT Analysis
- 18.2.6.4. Recent Developments
- 18.2.6.5. Financials (Based on Availability)
- 18.2.7 Fuji Electric Co Ltd
- 18.2.7.1. Overview
- 18.2.7.2. Products
- 18.2.7.3. SWOT Analysis
- 18.2.7.4. Recent Developments
- 18.2.7.5. Financials (Based on Availability)
- 18.2.8 Crompton Greaves Power and Industrial Solutions Limited
- 18.2.8.1. Overview
- 18.2.8.2. Products
- 18.2.8.3. SWOT Analysis
- 18.2.8.4. Recent Developments
- 18.2.8.5. Financials (Based on Availability)
- 18.2.9 Toshiba International Corporation
- 18.2.9.1. Overview
- 18.2.9.2. Products
- 18.2.9.3. SWOT Analysis
- 18.2.9.4. Recent Developments
- 18.2.9.5. Financials (Based on Availability)
- 18.2.10 Hubbell Incorporated
- 18.2.10.1. Overview
- 18.2.10.2. Products
- 18.2.10.3. SWOT Analysis
- 18.2.10.4. Recent Developments
- 18.2.10.5. Financials (Based on Availability)
- 18.2.11 Hitachi Ltd
- 18.2.11.1. Overview
- 18.2.11.2. Products
- 18.2.11.3. SWOT Analysis
- 18.2.11.4. Recent Developments
- 18.2.11.5. Financials (Based on Availability)
- 18.2.12 Mitsubishi Electric Corporation
- 18.2.12.1. Overview
- 18.2.12.2. Products
- 18.2.12.3. SWOT Analysis
- 18.2.12.4. Recent Developments
- 18.2.12.5. Financials (Based on Availability)
- 18.2.13 Siemens AG
- 18.2.13.1. Overview
- 18.2.13.2. Products
- 18.2.13.3. SWOT Analysis
- 18.2.13.4. Recent Developments
- 18.2.13.5. Financials (Based on Availability)
- 18.2.14 Schneider Electric SE
- 18.2.14.1. Overview
- 18.2.14.2. Products
- 18.2.14.3. SWOT Analysis
- 18.2.14.4. Recent Developments
- 18.2.14.5. Financials (Based on Availability)
- 18.2.15 Powell Industries Inc
- 18.2.15.1. Overview
- 18.2.15.2. Products
- 18.2.15.3. SWOT Analysis
- 18.2.15.4. Recent Developments
- 18.2.15.5. Financials (Based on Availability)
- 18.2.16 Meidensha Corporation
- 18.2.16.1. Overview
- 18.2.16.2. Products
- 18.2.16.3. SWOT Analysis
- 18.2.16.4. Recent Developments
- 18.2.16.5. Financials (Based on Availability)
- 18.2.17 Havells India Limited
- 18.2.17.1. Overview
- 18.2.17.2. Products
- 18.2.17.3. SWOT Analysis
- 18.2.17.4. Recent Developments
- 18.2.17.5. Financials (Based on Availability)
- 18.2.1 ZPUE S
List of Figures
- Figure 1: Global Switchgear Industry Revenue Breakdown (Million, %) by Region 2024 & 2032
- Figure 2: North America Switchgear Industry Revenue (Million), by Country 2024 & 2032
- Figure 3: North America Switchgear Industry Revenue Share (%), by Country 2024 & 2032
- Figure 4: Europe Switchgear Industry Revenue (Million), by Country 2024 & 2032
- Figure 5: Europe Switchgear Industry Revenue Share (%), by Country 2024 & 2032
- Figure 6: Asia Switchgear Industry Revenue (Million), by Country 2024 & 2032
- Figure 7: Asia Switchgear Industry Revenue Share (%), by Country 2024 & 2032
- Figure 8: Australia and New Zealand Switchgear Industry Revenue (Million), by Country 2024 & 2032
- Figure 9: Australia and New Zealand Switchgear Industry Revenue Share (%), by Country 2024 & 2032
- Figure 10: Middle East and Africa Switchgear Industry Revenue (Million), by Country 2024 & 2032
- Figure 11: Middle East and Africa Switchgear Industry Revenue Share (%), by Country 2024 & 2032
- Figure 12: Latin America Switchgear Industry Revenue (Million), by Country 2024 & 2032
- Figure 13: Latin America Switchgear Industry Revenue Share (%), by Country 2024 & 2032
- Figure 14: North America Switchgear Industry Revenue (Million), by Type 2024 & 2032
- Figure 15: North America Switchgear Industry Revenue Share (%), by Type 2024 & 2032
- Figure 16: North America Switchgear Industry Revenue (Million), by End-user Industry 2024 & 2032
- Figure 17: North America Switchgear Industry Revenue Share (%), by End-user Industry 2024 & 2032
- Figure 18: North America Switchgear Industry Revenue (Million), by Country 2024 & 2032
- Figure 19: North America Switchgear Industry Revenue Share (%), by Country 2024 & 2032
- Figure 20: Europe Switchgear Industry Revenue (Million), by Type 2024 & 2032
- Figure 21: Europe Switchgear Industry Revenue Share (%), by Type 2024 & 2032
- Figure 22: Europe Switchgear Industry Revenue (Million), by End-user Industry 2024 & 2032
- Figure 23: Europe Switchgear Industry Revenue Share (%), by End-user Industry 2024 & 2032
- Figure 24: Europe Switchgear Industry Revenue (Million), by Country 2024 & 2032
- Figure 25: Europe Switchgear Industry Revenue Share (%), by Country 2024 & 2032
- Figure 26: Asia Switchgear Industry Revenue (Million), by Type 2024 & 2032
- Figure 27: Asia Switchgear Industry Revenue Share (%), by Type 2024 & 2032
- Figure 28: Asia Switchgear Industry Revenue (Million), by End-user Industry 2024 & 2032
- Figure 29: Asia Switchgear Industry Revenue Share (%), by End-user Industry 2024 & 2032
- Figure 30: Asia Switchgear Industry Revenue (Million), by Country 2024 & 2032
- Figure 31: Asia Switchgear Industry Revenue Share (%), by Country 2024 & 2032
- Figure 32: Australia and New Zealand Switchgear Industry Revenue (Million), by Type 2024 & 2032
- Figure 33: Australia and New Zealand Switchgear Industry Revenue Share (%), by Type 2024 & 2032
- Figure 34: Australia and New Zealand Switchgear Industry Revenue (Million), by End-user Industry 2024 & 2032
- Figure 35: Australia and New Zealand Switchgear Industry Revenue Share (%), by End-user Industry 2024 & 2032
- Figure 36: Australia and New Zealand Switchgear Industry Revenue (Million), by Country 2024 & 2032
- Figure 37: Australia and New Zealand Switchgear Industry Revenue Share (%), by Country 2024 & 2032
- Figure 38: Middle East and Africa Switchgear Industry Revenue (Million), by Type 2024 & 2032
- Figure 39: Middle East and Africa Switchgear Industry Revenue Share (%), by Type 2024 & 2032
- Figure 40: Middle East and Africa Switchgear Industry Revenue (Million), by End-user Industry 2024 & 2032
- Figure 41: Middle East and Africa Switchgear Industry Revenue Share (%), by End-user Industry 2024 & 2032
- Figure 42: Middle East and Africa Switchgear Industry Revenue (Million), by Country 2024 & 2032
- Figure 43: Middle East and Africa Switchgear Industry Revenue Share (%), by Country 2024 & 2032
- Figure 44: Latin America Switchgear Industry Revenue (Million), by Type 2024 & 2032
- Figure 45: Latin America Switchgear Industry Revenue Share (%), by Type 2024 & 2032
- Figure 46: Latin America Switchgear Industry Revenue (Million), by End-user Industry 2024 & 2032
- Figure 47: Latin America Switchgear Industry Revenue Share (%), by End-user Industry 2024 & 2032
- Figure 48: Latin America Switchgear Industry Revenue (Million), by Country 2024 & 2032
- Figure 49: Latin America Switchgear Industry Revenue Share (%), by Country 2024 & 2032
List of Tables
- Table 1: Global Switchgear Industry Revenue Million Forecast, by Region 2019 & 2032
- Table 2: Global Switchgear Industry Revenue Million Forecast, by Type 2019 & 2032
- Table 3: Global Switchgear Industry Revenue Million Forecast, by End-user Industry 2019 & 2032
- Table 4: Global Switchgear Industry Revenue Million Forecast, by Region 2019 & 2032
- Table 5: Global Switchgear Industry Revenue Million Forecast, by Country 2019 & 2032
- Table 6: Switchgear Industry Revenue (Million) Forecast, by Application 2019 & 2032
- Table 7: Global Switchgear Industry Revenue Million Forecast, by Country 2019 & 2032
- Table 8: Switchgear Industry Revenue (Million) Forecast, by Application 2019 & 2032
- Table 9: Global Switchgear Industry Revenue Million Forecast, by Country 2019 & 2032
- Table 10: Switchgear Industry Revenue (Million) Forecast, by Application 2019 & 2032
- Table 11: Global Switchgear Industry Revenue Million Forecast, by Country 2019 & 2032
- Table 12: Switchgear Industry Revenue (Million) Forecast, by Application 2019 & 2032
- Table 13: Global Switchgear Industry Revenue Million Forecast, by Country 2019 & 2032
- Table 14: Switchgear Industry Revenue (Million) Forecast, by Application 2019 & 2032
- Table 15: Global Switchgear Industry Revenue Million Forecast, by Country 2019 & 2032
- Table 16: Switchgear Industry Revenue (Million) Forecast, by Application 2019 & 2032
- Table 17: Global Switchgear Industry Revenue Million Forecast, by Type 2019 & 2032
- Table 18: Global Switchgear Industry Revenue Million Forecast, by End-user Industry 2019 & 2032
- Table 19: Global Switchgear Industry Revenue Million Forecast, by Country 2019 & 2032
- Table 20: Global Switchgear Industry Revenue Million Forecast, by Type 2019 & 2032
- Table 21: Global Switchgear Industry Revenue Million Forecast, by End-user Industry 2019 & 2032
- Table 22: Global Switchgear Industry Revenue Million Forecast, by Country 2019 & 2032
- Table 23: Global Switchgear Industry Revenue Million Forecast, by Type 2019 & 2032
- Table 24: Global Switchgear Industry Revenue Million Forecast, by End-user Industry 2019 & 2032
- Table 25: Global Switchgear Industry Revenue Million Forecast, by Country 2019 & 2032
- Table 26: Global Switchgear Industry Revenue Million Forecast, by Type 2019 & 2032
- Table 27: Global Switchgear Industry Revenue Million Forecast, by End-user Industry 2019 & 2032
- Table 28: Global Switchgear Industry Revenue Million Forecast, by Country 2019 & 2032
- Table 29: Global Switchgear Industry Revenue Million Forecast, by Type 2019 & 2032
- Table 30: Global Switchgear Industry Revenue Million Forecast, by End-user Industry 2019 & 2032
- Table 31: Global Switchgear Industry Revenue Million Forecast, by Country 2019 & 2032
- Table 32: Global Switchgear Industry Revenue Million Forecast, by Type 2019 & 2032
- Table 33: Global Switchgear Industry Revenue Million Forecast, by End-user Industry 2019 & 2032
- Table 34: Global Switchgear Industry Revenue Million Forecast, by Country 2019 & 2032
Frequently Asked Questions
1. What is the projected Compound Annual Growth Rate (CAGR) of the Switchgear Industry?
The projected CAGR is approximately 6.10%.
2. Which companies are prominent players in the Switchgear Industry?
Key companies in the market include ZPUE S, Eaton Corporation, Switchgear Company, ABB Ltd, General Electric, Orecco Electric, Fuji Electric Co Ltd, Crompton Greaves Power and Industrial Solutions Limited, Toshiba International Corporation, Hubbell Incorporated, Hitachi Ltd, Mitsubishi Electric Corporation, Siemens AG, Schneider Electric SE, Powell Industries Inc, Meidensha Corporation, Havells India Limited.
3. What are the main segments of the Switchgear Industry?
The market segments include Type, End-user Industry.
4. Can you provide details about the market size?
The market size is estimated to be USD 122.24 Million as of 2022.
5. What are some drivers contributing to market growth?
Growth of Smart Electricity Grid Infrastructure; Growing Focus on Infrastructure and Renewable Energy Sources; Increased Investment in Industrial Production.
6. What are the notable trends driving market growth?
The Residential Segment to Witness a Significant Growth.
7. Are there any restraints impacting market growth?
Stringent Environmental and Safety Regulations; Increasing Competition from the Unorganized Sectors.
8. Can you provide examples of recent developments in the market?
February 2024: Schneider Electric introduced a new product called SureSeT Medium Voltage (MV) switchgear for the Canadian market. This innovative solution, which features the EvoPacT circuit breaker, aims to provide a more efficient and advanced option for primary switchgear applications that can handle digital operations effectively. SureSeT thoroughly monitors thermal, environmental, and circuit breaker health and is durable and compact. SureSeT can minimize downtime and enable faster detection of problems for quicker repairs by offering features like remote control and digital services utilizing real-time data.
9. What pricing options are available for accessing the report?
Pricing options include single-user, multi-user, and enterprise licenses priced at USD 4750, USD 5250, and USD 8750 respectively.
10. Is the market size provided in terms of value or volume?
The market size is provided in terms of value, measured in Million.
11. Are there any specific market keywords associated with the report?
Yes, the market keyword associated with the report is "Switchgear Industry," which aids in identifying and referencing the specific market segment covered.
12. How do I determine which pricing option suits my needs best?
The pricing options vary based on user requirements and access needs. Individual users may opt for single-user licenses, while businesses requiring broader access may choose multi-user or enterprise licenses for cost-effective access to the report.
13. Are there any additional resources or data provided in the Switchgear Industry report?
While the report offers comprehensive insights, it's advisable to review the specific contents or supplementary materials provided to ascertain if additional resources or data are available.
14. How can I stay updated on further developments or reports in the Switchgear Industry?
To stay informed about further developments, trends, and reports in the Switchgear Industry, consider subscribing to industry newsletters, following relevant companies and organizations, or regularly checking reputable industry news sources and publications.
Methodology
Step 1 - Identification of Relevant Samples Size from Population Database


Step 2 - Approaches for Defining Global Market Size (Value, Volume* & Price*)

Note*: In applicable scenarios
Step 3 - Data Sources
Primary Research
- Web Analytics
- Survey Reports
- Research Institute
- Latest Research Reports
- Opinion Leaders
Secondary Research
- Annual Reports
- White Paper
- Latest Press Release
- Industry Association
- Paid Database
- Investor Presentations

Step 4 - Data Triangulation
Involves using different sources of information in order to increase the validity of a study
These sources are likely to be stakeholders in a program - participants, other researchers, program staff, other community members, and so on.
Then we put all data in single framework & apply various statistical tools to find out the dynamic on the market.
During the analysis stage, feedback from the stakeholder groups would be compared to determine areas of agreement as well as areas of divergence
