

Key Insights
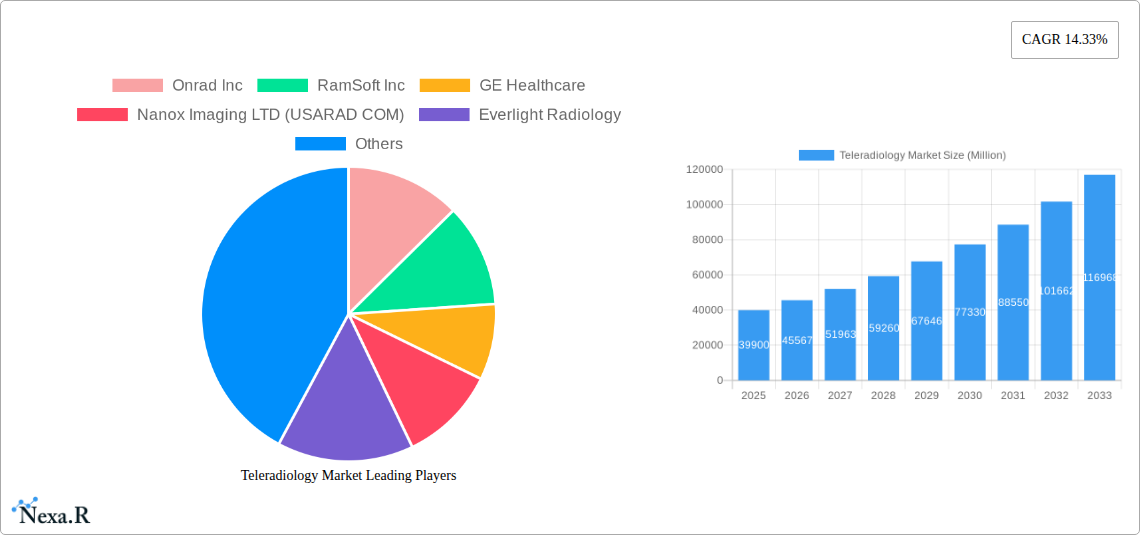
The global teleradiology market is experiencing robust growth, projected to reach $39.90 billion in 2025 and exhibiting a Compound Annual Growth Rate (CAGR) of 14.33% from 2025 to 2033. This expansion is driven by several key factors. The increasing prevalence of chronic diseases requiring frequent imaging, coupled with a global shortage of radiologists, fuels the demand for remote diagnostic services. Technological advancements, such as the development of high-resolution imaging techniques and improved telecommunication infrastructure, are further accelerating market growth. The rising adoption of cloud-based platforms and artificial intelligence (AI) in image analysis enhances efficiency and accuracy, making teleradiology a more attractive and cost-effective solution for healthcare providers. Furthermore, government initiatives promoting telehealth and remote healthcare access in various regions contribute significantly to market expansion. The market segmentation reveals a strong preference for hardware components within the market, followed by software solutions. Hospitals and diagnostic centers constitute the largest end-user segments, while X-rays and CT scans remain the most prevalent imaging techniques utilized in teleradiology. North America currently holds a significant market share, driven by advanced technological infrastructure and high healthcare expenditure, but the Asia-Pacific region is expected to witness significant growth in the coming years due to expanding healthcare infrastructure and increasing adoption rates.
Competition in the teleradiology market is intense, with established players like GE Healthcare and Philips competing alongside emerging companies specializing in AI-powered solutions and cloud-based platforms. Strategic partnerships and acquisitions are prevalent, as companies seek to expand their service offerings and geographical reach. The market faces certain challenges, including concerns regarding data security and privacy, regulatory hurdles related to telehealth adoption, and the need for robust internet connectivity in all regions, particularly in developing countries. However, ongoing technological innovations, coupled with increasing investments in digital healthcare infrastructure, are expected to mitigate these challenges and further propel the market's growth trajectory throughout the forecast period. The market's future hinges on overcoming infrastructural limitations, ensuring data security, and fostering collaborations between technology providers and healthcare institutions.
Teleradiology Market: A Comprehensive Report (2019-2033)
This comprehensive report provides an in-depth analysis of the global Teleradiology market, encompassing market dynamics, growth trends, regional analysis, key players, and future outlook. The study period covers 2019-2033, with 2025 as the base year and a forecast period of 2025-2033. The report segments the market by component (hardware, software), end-user (hospitals, diagnostic centers, other end-users), and imaging technique (X-rays, CT, Ultrasound, MRI, Nuclear Imaging, other imaging techniques). This detailed examination is crucial for healthcare providers, technology vendors, investors, and anyone seeking to understand this rapidly evolving market. The market is expected to reach xx Million by 2033.
Teleradiology Market Dynamics & Structure
The teleradiology market is characterized by a moderately concentrated landscape, with key players such as GE Healthcare, Koninklijke Philips NV, and Agfa-Gevaert Group holding significant market share. However, the market is also witnessing increased competition from smaller, specialized providers. Technological innovation, particularly in AI-powered image analysis and cloud-based solutions, is a key driver of growth. Regulatory frameworks, varying across countries, influence market adoption. The increasing demand for remote radiology services, driven by factors like physician shortages and improved connectivity, is a major impetus for growth. Furthermore, the rise of telemedicine and the increasing focus on cost-effectiveness are creating new opportunities within the sector. M&A activity in the sector has been moderate, with a few notable deals focusing on technology integration and market expansion.
- Market Concentration: Moderately concentrated, with top players holding xx% market share in 2025.
- Technological Innovation: AI-powered image analysis, cloud-based platforms are driving growth.
- Regulatory Frameworks: Varying regulations across regions impact market penetration.
- Competitive Substitutes: Limited direct substitutes, primarily alternative diagnostic methods.
- End-User Demographics: Growth driven by increasing demand in developing economies and aging populations in developed countries.
- M&A Trends: Moderate M&A activity, focused on technology integration and market expansion; xx deals in the last 5 years.
Teleradiology Market Growth Trends & Insights
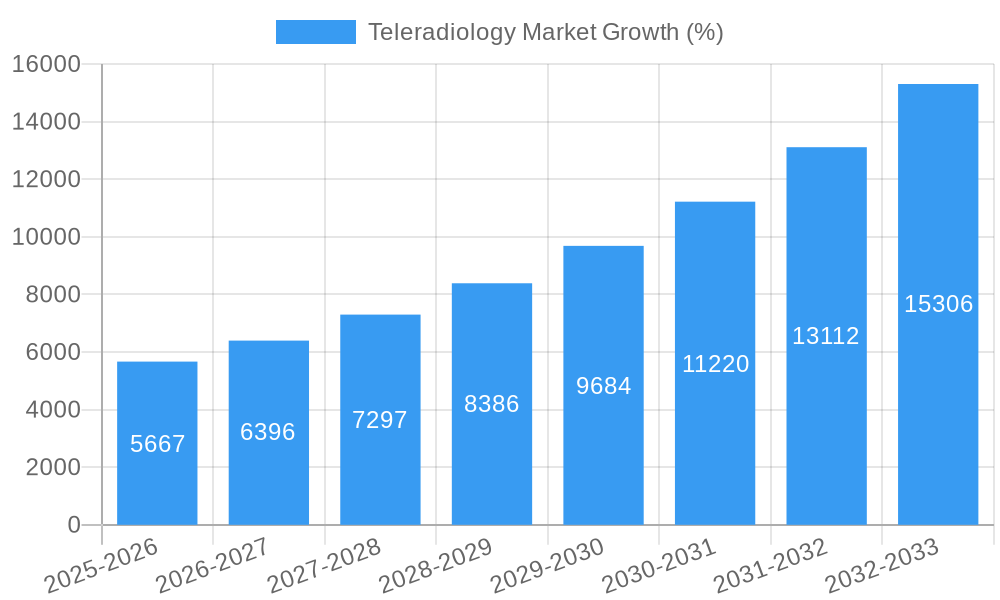
The teleradiology market experienced robust growth during the historical period (2019-2024), driven primarily by increasing demand for efficient and cost-effective radiology services. The market is projected to continue its growth trajectory throughout the forecast period (2025-2033), exhibiting a Compound Annual Growth Rate (CAGR) of xx% during this period. This growth is fueled by factors like the rising prevalence of chronic diseases, increasing adoption of telehealth, and technological advancements enabling seamless remote image interpretation. Market penetration is expected to significantly increase, particularly in underserved regions and those with limited access to specialized radiologists. Technological disruptions, such as the integration of AI and improved image transmission technologies, are further accelerating market expansion. Shifts in consumer behavior, with greater acceptance of remote healthcare services, are also contributing to this growth.
Dominant Regions, Countries, or Segments in Teleradiology Market
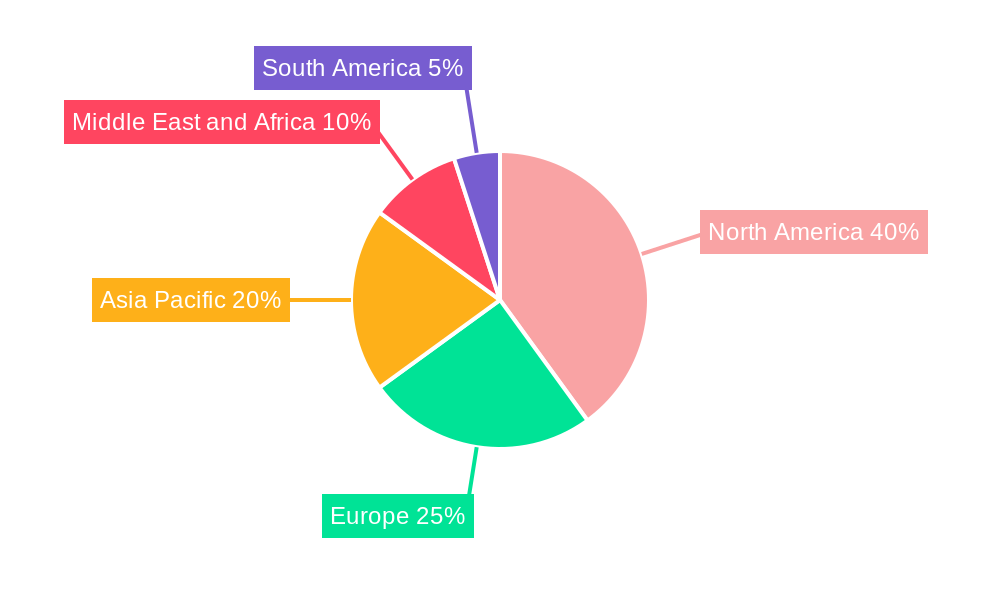
North America currently holds the largest market share in the teleradiology market, driven by factors like advanced healthcare infrastructure, high adoption of digital technologies, and substantial investments in healthcare IT. However, the Asia-Pacific region is projected to witness the fastest growth rate due to its rapidly expanding healthcare sector, increasing prevalence of chronic diseases, and rising government initiatives to improve healthcare access. Within the market segmentation, the Software segment is expected to witness significant growth because of the increasing demand for efficient and cost effective diagnostic services. The Hospitals segment dominates the end-user landscape because of higher adoption rates, better equipped infrastructure.
- North America: Largest market share, driven by advanced infrastructure and high technology adoption.
- Asia-Pacific: Fastest-growing region, fueled by expanding healthcare sector and government initiatives.
- Software Segment: High growth due to demand for efficient diagnostic services and improved workflow.
- Hospitals Segment: Dominant end-user, attributed to higher adoption rates and better equipped infrastructure.
Teleradiology Market Product Landscape
The teleradiology market features a diverse range of products, including advanced image analysis software, cloud-based platforms, secure image transmission systems, and specialized hardware for image acquisition and display. Product innovations focus on enhancing image quality, improving diagnostic accuracy through AI integration, ensuring data security and compliance with HIPAA and other regulations, streamlining workflow efficiency, and reducing costs. Key selling propositions include improved diagnostic accuracy, reduced turnaround time, increased accessibility to specialists, and enhanced cost-effectiveness. Technological advancements, such as the use of deep learning algorithms in image analysis, promise significant improvements in diagnostic performance and speed.
Key Drivers, Barriers & Challenges in Teleradiology Market
Key Drivers:
- Increasing demand for improved access to specialists.
- Growing adoption of telemedicine and remote healthcare services.
- Technological advancements in image analysis and transmission.
- Cost-effectiveness compared to traditional radiology practices.
Challenges & Restraints:
- Regulatory hurdles and compliance requirements in various countries.
- Data security and privacy concerns related to patient information.
- Ensuring consistent image quality and diagnostic accuracy across different platforms and locations.
- High initial investment costs for implementing teleradiology systems.
Emerging Opportunities in Teleradiology Market
Emerging opportunities lie in expanding teleradiology services to underserved regions, particularly in developing countries, integrating AI for enhanced diagnostics, offering specialized teleradiology services like AI-based triage, and providing personalized patient care. The rising use of mobile technologies and remote patient monitoring systems presents further opportunities for growth. Expanding the types of imaging modalities supported by teleradiology systems is another promising direction.
Growth Accelerators in the Teleradiology Market Industry
Technological breakthroughs, strategic partnerships between technology vendors and healthcare providers, and expansion into new geographic markets are accelerating the growth of the teleradiology market. The integration of AI and machine learning is significantly improving diagnostic accuracy and efficiency. Government regulations and incentives supporting telemedicine are also playing a vital role in stimulating market growth.
Key Players Shaping the Teleradiology Market Market
- Onrad Inc
- RamSoft Inc
- GE Healthcare
- Nanox Imaging LTD (USARAD COM)
- Everlight Radiology
- HealthWatch TeleDiagnostics Private Limited
- Koninklijke Philips NV
- 4ways Healthcare Ltd
- Teleradiology Solutions
- Carestream Health
- Agfa-Gevaert Group
Notable Milestones in Teleradiology Market Sector
- April 2023: Aster DM Healthcare launched a Telecommand Center and Digital Health facility in India, integrating teleradiology services.
- April 2022: Teleradiology Solutions partnered with Andhra Med Tech Zone (AMTZ) to establish a remote radiology hub utilizing AI solutions.
In-Depth Teleradiology Market Market Outlook
The teleradiology market is poised for continued strong growth, driven by ongoing technological advancements, increasing demand for remote healthcare services, and favorable regulatory environments. Strategic partnerships, expansion into emerging markets, and the integration of AI will create significant opportunities for market players. The market's future potential is substantial, presenting attractive prospects for investors and healthcare providers alike.
Teleradiology Market Segmentation
-
1. Imaging Technique
- 1.1. X-rays
- 1.2. Computed Tomography (CT)
- 1.3. Ultrasound
- 1.4. Magnetic Resonance Imaging (MRI)
- 1.5. Nuclear Imaging
- 1.6. Other Imaging Techniques
-
2. Component
- 2.1. Hardware
- 2.2. Software
-
3. End User
- 3.1. Hospitals
- 3.2. Diagnostic Centers
- 3.3. Other End Users
Teleradiology Market Segmentation By Geography
-
1. North America
- 1.1. United States
- 1.2. Canada
- 1.3. Mexico
-
2. Europe
- 2.1. Germany
- 2.2. United Kingdom
- 2.3. France
- 2.4. Italy
- 2.5. Spain
- 2.6. Rest of Europe
-
3. Asia Pacific
- 3.1. China
- 3.2. Japan
- 3.3. India
- 3.4. Australia
- 3.5. South Korea
- 3.6. Rest of Asia Pacific
-
4. Middle East and Africa
- 4.1. GCC
- 4.2. South Africa
- 4.3. Rest of Middle East and Africa
-
5. South America
- 5.1. Brazil
- 5.2. Argentina
- 5.3. Rest of South America
Teleradiology Market REPORT HIGHLIGHTS
| Aspects | Details |
|---|---|
| Study Period | 2019-2033 |
| Base Year | 2024 |
| Estimated Year | 2025 |
| Forecast Period | 2025-2033 |
| Historical Period | 2019-2024 |
| Growth Rate | CAGR of 14.33% from 2019-2033 |
| Segmentation |
|
Table of Contents
- 1. Introduction
- 1.1. Research Scope
- 1.2. Market Segmentation
- 1.3. Research Methodology
- 1.4. Definitions and Assumptions
- 2. Executive Summary
- 2.1. Introduction
- 3. Market Dynamics
- 3.1. Introduction
- 3.2. Market Drivers
- 3.2.1. Rising Number of Imaging Procedures; Development of IT Infrastructure and Rise in Healthcare Expenditure; Increasing Prevalence of Osteoarthritis and Chronic Diseases
- 3.3. Market Restrains
- 3.3.1. Lack of Skilled Professionals; Security Concerns Associated with Teleradiology
- 3.4. Market Trends
- 3.4.1. Software Segment is Expected to Register Fastest Growth Over the Forecast Period
- 4. Market Factor Analysis
- 4.1. Porters Five Forces
- 4.2. Supply/Value Chain
- 4.3. PESTEL analysis
- 4.4. Market Entropy
- 4.5. Patent/Trademark Analysis
- 5. Global Teleradiology Market Analysis, Insights and Forecast, 2019-2031
- 5.1. Market Analysis, Insights and Forecast - by Imaging Technique
- 5.1.1. X-rays
- 5.1.2. Computed Tomography (CT)
- 5.1.3. Ultrasound
- 5.1.4. Magnetic Resonance Imaging (MRI)
- 5.1.5. Nuclear Imaging
- 5.1.6. Other Imaging Techniques
- 5.2. Market Analysis, Insights and Forecast - by Component
- 5.2.1. Hardware
- 5.2.2. Software
- 5.3. Market Analysis, Insights and Forecast - by End User
- 5.3.1. Hospitals
- 5.3.2. Diagnostic Centers
- 5.3.3. Other End Users
- 5.4. Market Analysis, Insights and Forecast - by Region
- 5.4.1. North America
- 5.4.2. Europe
- 5.4.3. Asia Pacific
- 5.4.4. Middle East and Africa
- 5.4.5. South America
- 5.1. Market Analysis, Insights and Forecast - by Imaging Technique
- 6. North America Teleradiology Market Analysis, Insights and Forecast, 2019-2031
- 6.1. Market Analysis, Insights and Forecast - by Imaging Technique
- 6.1.1. X-rays
- 6.1.2. Computed Tomography (CT)
- 6.1.3. Ultrasound
- 6.1.4. Magnetic Resonance Imaging (MRI)
- 6.1.5. Nuclear Imaging
- 6.1.6. Other Imaging Techniques
- 6.2. Market Analysis, Insights and Forecast - by Component
- 6.2.1. Hardware
- 6.2.2. Software
- 6.3. Market Analysis, Insights and Forecast - by End User
- 6.3.1. Hospitals
- 6.3.2. Diagnostic Centers
- 6.3.3. Other End Users
- 6.1. Market Analysis, Insights and Forecast - by Imaging Technique
- 7. Europe Teleradiology Market Analysis, Insights and Forecast, 2019-2031
- 7.1. Market Analysis, Insights and Forecast - by Imaging Technique
- 7.1.1. X-rays
- 7.1.2. Computed Tomography (CT)
- 7.1.3. Ultrasound
- 7.1.4. Magnetic Resonance Imaging (MRI)
- 7.1.5. Nuclear Imaging
- 7.1.6. Other Imaging Techniques
- 7.2. Market Analysis, Insights and Forecast - by Component
- 7.2.1. Hardware
- 7.2.2. Software
- 7.3. Market Analysis, Insights and Forecast - by End User
- 7.3.1. Hospitals
- 7.3.2. Diagnostic Centers
- 7.3.3. Other End Users
- 7.1. Market Analysis, Insights and Forecast - by Imaging Technique
- 8. Asia Pacific Teleradiology Market Analysis, Insights and Forecast, 2019-2031
- 8.1. Market Analysis, Insights and Forecast - by Imaging Technique
- 8.1.1. X-rays
- 8.1.2. Computed Tomography (CT)
- 8.1.3. Ultrasound
- 8.1.4. Magnetic Resonance Imaging (MRI)
- 8.1.5. Nuclear Imaging
- 8.1.6. Other Imaging Techniques
- 8.2. Market Analysis, Insights and Forecast - by Component
- 8.2.1. Hardware
- 8.2.2. Software
- 8.3. Market Analysis, Insights and Forecast - by End User
- 8.3.1. Hospitals
- 8.3.2. Diagnostic Centers
- 8.3.3. Other End Users
- 8.1. Market Analysis, Insights and Forecast - by Imaging Technique
- 9. Middle East and Africa Teleradiology Market Analysis, Insights and Forecast, 2019-2031
- 9.1. Market Analysis, Insights and Forecast - by Imaging Technique
- 9.1.1. X-rays
- 9.1.2. Computed Tomography (CT)
- 9.1.3. Ultrasound
- 9.1.4. Magnetic Resonance Imaging (MRI)
- 9.1.5. Nuclear Imaging
- 9.1.6. Other Imaging Techniques
- 9.2. Market Analysis, Insights and Forecast - by Component
- 9.2.1. Hardware
- 9.2.2. Software
- 9.3. Market Analysis, Insights and Forecast - by End User
- 9.3.1. Hospitals
- 9.3.2. Diagnostic Centers
- 9.3.3. Other End Users
- 9.1. Market Analysis, Insights and Forecast - by Imaging Technique
- 10. South America Teleradiology Market Analysis, Insights and Forecast, 2019-2031
- 10.1. Market Analysis, Insights and Forecast - by Imaging Technique
- 10.1.1. X-rays
- 10.1.2. Computed Tomography (CT)
- 10.1.3. Ultrasound
- 10.1.4. Magnetic Resonance Imaging (MRI)
- 10.1.5. Nuclear Imaging
- 10.1.6. Other Imaging Techniques
- 10.2. Market Analysis, Insights and Forecast - by Component
- 10.2.1. Hardware
- 10.2.2. Software
- 10.3. Market Analysis, Insights and Forecast - by End User
- 10.3.1. Hospitals
- 10.3.2. Diagnostic Centers
- 10.3.3. Other End Users
- 10.1. Market Analysis, Insights and Forecast - by Imaging Technique
- 11. North America Teleradiology Market Analysis, Insights and Forecast, 2019-2031
- 11.1. Market Analysis, Insights and Forecast - By Country/Sub-region
- 11.1.1 United States
- 11.1.2 Canada
- 11.1.3 Mexico
- 12. Europe Teleradiology Market Analysis, Insights and Forecast, 2019-2031
- 12.1. Market Analysis, Insights and Forecast - By Country/Sub-region
- 12.1.1 Germany
- 12.1.2 United Kingdom
- 12.1.3 France
- 12.1.4 Italy
- 12.1.5 Spain
- 12.1.6 Rest of Europe
- 13. Asia Pacific Teleradiology Market Analysis, Insights and Forecast, 2019-2031
- 13.1. Market Analysis, Insights and Forecast - By Country/Sub-region
- 13.1.1 China
- 13.1.2 Japan
- 13.1.3 India
- 13.1.4 Australia
- 13.1.5 South Korea
- 13.1.6 Rest of Asia Pacific
- 14. Middle East and Africa Teleradiology Market Analysis, Insights and Forecast, 2019-2031
- 14.1. Market Analysis, Insights and Forecast - By Country/Sub-region
- 14.1.1 GCC
- 14.1.2 South Africa
- 14.1.3 Rest of Middle East and Africa
- 15. South America Teleradiology Market Analysis, Insights and Forecast, 2019-2031
- 15.1. Market Analysis, Insights and Forecast - By Country/Sub-region
- 15.1.1 Brazil
- 15.1.2 Argentina
- 15.1.3 Rest of South America
- 16. Competitive Analysis
- 16.1. Global Market Share Analysis 2024
- 16.2. Company Profiles
- 16.2.1 Onrad Inc
- 16.2.1.1. Overview
- 16.2.1.2. Products
- 16.2.1.3. SWOT Analysis
- 16.2.1.4. Recent Developments
- 16.2.1.5. Financials (Based on Availability)
- 16.2.2 RamSoft Inc
- 16.2.2.1. Overview
- 16.2.2.2. Products
- 16.2.2.3. SWOT Analysis
- 16.2.2.4. Recent Developments
- 16.2.2.5. Financials (Based on Availability)
- 16.2.3 GE Healthcare
- 16.2.3.1. Overview
- 16.2.3.2. Products
- 16.2.3.3. SWOT Analysis
- 16.2.3.4. Recent Developments
- 16.2.3.5. Financials (Based on Availability)
- 16.2.4 Nanox Imaging LTD (USARAD COM)
- 16.2.4.1. Overview
- 16.2.4.2. Products
- 16.2.4.3. SWOT Analysis
- 16.2.4.4. Recent Developments
- 16.2.4.5. Financials (Based on Availability)
- 16.2.5 Everlight Radiology
- 16.2.5.1. Overview
- 16.2.5.2. Products
- 16.2.5.3. SWOT Analysis
- 16.2.5.4. Recent Developments
- 16.2.5.5. Financials (Based on Availability)
- 16.2.6 HealthWatch TeleDiagnostics Private Limited
- 16.2.6.1. Overview
- 16.2.6.2. Products
- 16.2.6.3. SWOT Analysis
- 16.2.6.4. Recent Developments
- 16.2.6.5. Financials (Based on Availability)
- 16.2.7 Koninklijke Philips NV
- 16.2.7.1. Overview
- 16.2.7.2. Products
- 16.2.7.3. SWOT Analysis
- 16.2.7.4. Recent Developments
- 16.2.7.5. Financials (Based on Availability)
- 16.2.8 4ways Healthcare Ltd
- 16.2.8.1. Overview
- 16.2.8.2. Products
- 16.2.8.3. SWOT Analysis
- 16.2.8.4. Recent Developments
- 16.2.8.5. Financials (Based on Availability)
- 16.2.9 Teleradiology Solutions
- 16.2.9.1. Overview
- 16.2.9.2. Products
- 16.2.9.3. SWOT Analysis
- 16.2.9.4. Recent Developments
- 16.2.9.5. Financials (Based on Availability)
- 16.2.10 Carestream Health
- 16.2.10.1. Overview
- 16.2.10.2. Products
- 16.2.10.3. SWOT Analysis
- 16.2.10.4. Recent Developments
- 16.2.10.5. Financials (Based on Availability)
- 16.2.11 Agfa-Gevaert Group
- 16.2.11.1. Overview
- 16.2.11.2. Products
- 16.2.11.3. SWOT Analysis
- 16.2.11.4. Recent Developments
- 16.2.11.5. Financials (Based on Availability)
- 16.2.1 Onrad Inc
List of Figures
- Figure 1: Global Teleradiology Market Revenue Breakdown (Million, %) by Region 2024 & 2032
- Figure 2: Global Teleradiology Market Volume Breakdown (K Unit, %) by Region 2024 & 2032
- Figure 3: North America Teleradiology Market Revenue (Million), by Country 2024 & 2032
- Figure 4: North America Teleradiology Market Volume (K Unit), by Country 2024 & 2032
- Figure 5: North America Teleradiology Market Revenue Share (%), by Country 2024 & 2032
- Figure 6: North America Teleradiology Market Volume Share (%), by Country 2024 & 2032
- Figure 7: Europe Teleradiology Market Revenue (Million), by Country 2024 & 2032
- Figure 8: Europe Teleradiology Market Volume (K Unit), by Country 2024 & 2032
- Figure 9: Europe Teleradiology Market Revenue Share (%), by Country 2024 & 2032
- Figure 10: Europe Teleradiology Market Volume Share (%), by Country 2024 & 2032
- Figure 11: Asia Pacific Teleradiology Market Revenue (Million), by Country 2024 & 2032
- Figure 12: Asia Pacific Teleradiology Market Volume (K Unit), by Country 2024 & 2032
- Figure 13: Asia Pacific Teleradiology Market Revenue Share (%), by Country 2024 & 2032
- Figure 14: Asia Pacific Teleradiology Market Volume Share (%), by Country 2024 & 2032
- Figure 15: Middle East and Africa Teleradiology Market Revenue (Million), by Country 2024 & 2032
- Figure 16: Middle East and Africa Teleradiology Market Volume (K Unit), by Country 2024 & 2032
- Figure 17: Middle East and Africa Teleradiology Market Revenue Share (%), by Country 2024 & 2032
- Figure 18: Middle East and Africa Teleradiology Market Volume Share (%), by Country 2024 & 2032
- Figure 19: South America Teleradiology Market Revenue (Million), by Country 2024 & 2032
- Figure 20: South America Teleradiology Market Volume (K Unit), by Country 2024 & 2032
- Figure 21: South America Teleradiology Market Revenue Share (%), by Country 2024 & 2032
- Figure 22: South America Teleradiology Market Volume Share (%), by Country 2024 & 2032
- Figure 23: North America Teleradiology Market Revenue (Million), by Imaging Technique 2024 & 2032
- Figure 24: North America Teleradiology Market Volume (K Unit), by Imaging Technique 2024 & 2032
- Figure 25: North America Teleradiology Market Revenue Share (%), by Imaging Technique 2024 & 2032
- Figure 26: North America Teleradiology Market Volume Share (%), by Imaging Technique 2024 & 2032
- Figure 27: North America Teleradiology Market Revenue (Million), by Component 2024 & 2032
- Figure 28: North America Teleradiology Market Volume (K Unit), by Component 2024 & 2032
- Figure 29: North America Teleradiology Market Revenue Share (%), by Component 2024 & 2032
- Figure 30: North America Teleradiology Market Volume Share (%), by Component 2024 & 2032
- Figure 31: North America Teleradiology Market Revenue (Million), by End User 2024 & 2032
- Figure 32: North America Teleradiology Market Volume (K Unit), by End User 2024 & 2032
- Figure 33: North America Teleradiology Market Revenue Share (%), by End User 2024 & 2032
- Figure 34: North America Teleradiology Market Volume Share (%), by End User 2024 & 2032
- Figure 35: North America Teleradiology Market Revenue (Million), by Country 2024 & 2032
- Figure 36: North America Teleradiology Market Volume (K Unit), by Country 2024 & 2032
- Figure 37: North America Teleradiology Market Revenue Share (%), by Country 2024 & 2032
- Figure 38: North America Teleradiology Market Volume Share (%), by Country 2024 & 2032
- Figure 39: Europe Teleradiology Market Revenue (Million), by Imaging Technique 2024 & 2032
- Figure 40: Europe Teleradiology Market Volume (K Unit), by Imaging Technique 2024 & 2032
- Figure 41: Europe Teleradiology Market Revenue Share (%), by Imaging Technique 2024 & 2032
- Figure 42: Europe Teleradiology Market Volume Share (%), by Imaging Technique 2024 & 2032
- Figure 43: Europe Teleradiology Market Revenue (Million), by Component 2024 & 2032
- Figure 44: Europe Teleradiology Market Volume (K Unit), by Component 2024 & 2032
- Figure 45: Europe Teleradiology Market Revenue Share (%), by Component 2024 & 2032
- Figure 46: Europe Teleradiology Market Volume Share (%), by Component 2024 & 2032
- Figure 47: Europe Teleradiology Market Revenue (Million), by End User 2024 & 2032
- Figure 48: Europe Teleradiology Market Volume (K Unit), by End User 2024 & 2032
- Figure 49: Europe Teleradiology Market Revenue Share (%), by End User 2024 & 2032
- Figure 50: Europe Teleradiology Market Volume Share (%), by End User 2024 & 2032
- Figure 51: Europe Teleradiology Market Revenue (Million), by Country 2024 & 2032
- Figure 52: Europe Teleradiology Market Volume (K Unit), by Country 2024 & 2032
- Figure 53: Europe Teleradiology Market Revenue Share (%), by Country 2024 & 2032
- Figure 54: Europe Teleradiology Market Volume Share (%), by Country 2024 & 2032
- Figure 55: Asia Pacific Teleradiology Market Revenue (Million), by Imaging Technique 2024 & 2032
- Figure 56: Asia Pacific Teleradiology Market Volume (K Unit), by Imaging Technique 2024 & 2032
- Figure 57: Asia Pacific Teleradiology Market Revenue Share (%), by Imaging Technique 2024 & 2032
- Figure 58: Asia Pacific Teleradiology Market Volume Share (%), by Imaging Technique 2024 & 2032
- Figure 59: Asia Pacific Teleradiology Market Revenue (Million), by Component 2024 & 2032
- Figure 60: Asia Pacific Teleradiology Market Volume (K Unit), by Component 2024 & 2032
- Figure 61: Asia Pacific Teleradiology Market Revenue Share (%), by Component 2024 & 2032
- Figure 62: Asia Pacific Teleradiology Market Volume Share (%), by Component 2024 & 2032
- Figure 63: Asia Pacific Teleradiology Market Revenue (Million), by End User 2024 & 2032
- Figure 64: Asia Pacific Teleradiology Market Volume (K Unit), by End User 2024 & 2032
- Figure 65: Asia Pacific Teleradiology Market Revenue Share (%), by End User 2024 & 2032
- Figure 66: Asia Pacific Teleradiology Market Volume Share (%), by End User 2024 & 2032
- Figure 67: Asia Pacific Teleradiology Market Revenue (Million), by Country 2024 & 2032
- Figure 68: Asia Pacific Teleradiology Market Volume (K Unit), by Country 2024 & 2032
- Figure 69: Asia Pacific Teleradiology Market Revenue Share (%), by Country 2024 & 2032
- Figure 70: Asia Pacific Teleradiology Market Volume Share (%), by Country 2024 & 2032
- Figure 71: Middle East and Africa Teleradiology Market Revenue (Million), by Imaging Technique 2024 & 2032
- Figure 72: Middle East and Africa Teleradiology Market Volume (K Unit), by Imaging Technique 2024 & 2032
- Figure 73: Middle East and Africa Teleradiology Market Revenue Share (%), by Imaging Technique 2024 & 2032
- Figure 74: Middle East and Africa Teleradiology Market Volume Share (%), by Imaging Technique 2024 & 2032
- Figure 75: Middle East and Africa Teleradiology Market Revenue (Million), by Component 2024 & 2032
- Figure 76: Middle East and Africa Teleradiology Market Volume (K Unit), by Component 2024 & 2032
- Figure 77: Middle East and Africa Teleradiology Market Revenue Share (%), by Component 2024 & 2032
- Figure 78: Middle East and Africa Teleradiology Market Volume Share (%), by Component 2024 & 2032
- Figure 79: Middle East and Africa Teleradiology Market Revenue (Million), by End User 2024 & 2032
- Figure 80: Middle East and Africa Teleradiology Market Volume (K Unit), by End User 2024 & 2032
- Figure 81: Middle East and Africa Teleradiology Market Revenue Share (%), by End User 2024 & 2032
- Figure 82: Middle East and Africa Teleradiology Market Volume Share (%), by End User 2024 & 2032
- Figure 83: Middle East and Africa Teleradiology Market Revenue (Million), by Country 2024 & 2032
- Figure 84: Middle East and Africa Teleradiology Market Volume (K Unit), by Country 2024 & 2032
- Figure 85: Middle East and Africa Teleradiology Market Revenue Share (%), by Country 2024 & 2032
- Figure 86: Middle East and Africa Teleradiology Market Volume Share (%), by Country 2024 & 2032
- Figure 87: South America Teleradiology Market Revenue (Million), by Imaging Technique 2024 & 2032
- Figure 88: South America Teleradiology Market Volume (K Unit), by Imaging Technique 2024 & 2032
- Figure 89: South America Teleradiology Market Revenue Share (%), by Imaging Technique 2024 & 2032
- Figure 90: South America Teleradiology Market Volume Share (%), by Imaging Technique 2024 & 2032
- Figure 91: South America Teleradiology Market Revenue (Million), by Component 2024 & 2032
- Figure 92: South America Teleradiology Market Volume (K Unit), by Component 2024 & 2032
- Figure 93: South America Teleradiology Market Revenue Share (%), by Component 2024 & 2032
- Figure 94: South America Teleradiology Market Volume Share (%), by Component 2024 & 2032
- Figure 95: South America Teleradiology Market Revenue (Million), by End User 2024 & 2032
- Figure 96: South America Teleradiology Market Volume (K Unit), by End User 2024 & 2032
- Figure 97: South America Teleradiology Market Revenue Share (%), by End User 2024 & 2032
- Figure 98: South America Teleradiology Market Volume Share (%), by End User 2024 & 2032
- Figure 99: South America Teleradiology Market Revenue (Million), by Country 2024 & 2032
- Figure 100: South America Teleradiology Market Volume (K Unit), by Country 2024 & 2032
- Figure 101: South America Teleradiology Market Revenue Share (%), by Country 2024 & 2032
- Figure 102: South America Teleradiology Market Volume Share (%), by Country 2024 & 2032
List of Tables
- Table 1: Global Teleradiology Market Revenue Million Forecast, by Region 2019 & 2032
- Table 2: Global Teleradiology Market Volume K Unit Forecast, by Region 2019 & 2032
- Table 3: Global Teleradiology Market Revenue Million Forecast, by Imaging Technique 2019 & 2032
- Table 4: Global Teleradiology Market Volume K Unit Forecast, by Imaging Technique 2019 & 2032
- Table 5: Global Teleradiology Market Revenue Million Forecast, by Component 2019 & 2032
- Table 6: Global Teleradiology Market Volume K Unit Forecast, by Component 2019 & 2032
- Table 7: Global Teleradiology Market Revenue Million Forecast, by End User 2019 & 2032
- Table 8: Global Teleradiology Market Volume K Unit Forecast, by End User 2019 & 2032
- Table 9: Global Teleradiology Market Revenue Million Forecast, by Region 2019 & 2032
- Table 10: Global Teleradiology Market Volume K Unit Forecast, by Region 2019 & 2032
- Table 11: Global Teleradiology Market Revenue Million Forecast, by Country 2019 & 2032
- Table 12: Global Teleradiology Market Volume K Unit Forecast, by Country 2019 & 2032
- Table 13: United States Teleradiology Market Revenue (Million) Forecast, by Application 2019 & 2032
- Table 14: United States Teleradiology Market Volume (K Unit) Forecast, by Application 2019 & 2032
- Table 15: Canada Teleradiology Market Revenue (Million) Forecast, by Application 2019 & 2032
- Table 16: Canada Teleradiology Market Volume (K Unit) Forecast, by Application 2019 & 2032
- Table 17: Mexico Teleradiology Market Revenue (Million) Forecast, by Application 2019 & 2032
- Table 18: Mexico Teleradiology Market Volume (K Unit) Forecast, by Application 2019 & 2032
- Table 19: Global Teleradiology Market Revenue Million Forecast, by Country 2019 & 2032
- Table 20: Global Teleradiology Market Volume K Unit Forecast, by Country 2019 & 2032
- Table 21: Germany Teleradiology Market Revenue (Million) Forecast, by Application 2019 & 2032
- Table 22: Germany Teleradiology Market Volume (K Unit) Forecast, by Application 2019 & 2032
- Table 23: United Kingdom Teleradiology Market Revenue (Million) Forecast, by Application 2019 & 2032
- Table 24: United Kingdom Teleradiology Market Volume (K Unit) Forecast, by Application 2019 & 2032
- Table 25: France Teleradiology Market Revenue (Million) Forecast, by Application 2019 & 2032
- Table 26: France Teleradiology Market Volume (K Unit) Forecast, by Application 2019 & 2032
- Table 27: Italy Teleradiology Market Revenue (Million) Forecast, by Application 2019 & 2032
- Table 28: Italy Teleradiology Market Volume (K Unit) Forecast, by Application 2019 & 2032
- Table 29: Spain Teleradiology Market Revenue (Million) Forecast, by Application 2019 & 2032
- Table 30: Spain Teleradiology Market Volume (K Unit) Forecast, by Application 2019 & 2032
- Table 31: Rest of Europe Teleradiology Market Revenue (Million) Forecast, by Application 2019 & 2032
- Table 32: Rest of Europe Teleradiology Market Volume (K Unit) Forecast, by Application 2019 & 2032
- Table 33: Global Teleradiology Market Revenue Million Forecast, by Country 2019 & 2032
- Table 34: Global Teleradiology Market Volume K Unit Forecast, by Country 2019 & 2032
- Table 35: China Teleradiology Market Revenue (Million) Forecast, by Application 2019 & 2032
- Table 36: China Teleradiology Market Volume (K Unit) Forecast, by Application 2019 & 2032
- Table 37: Japan Teleradiology Market Revenue (Million) Forecast, by Application 2019 & 2032
- Table 38: Japan Teleradiology Market Volume (K Unit) Forecast, by Application 2019 & 2032
- Table 39: India Teleradiology Market Revenue (Million) Forecast, by Application 2019 & 2032
- Table 40: India Teleradiology Market Volume (K Unit) Forecast, by Application 2019 & 2032
- Table 41: Australia Teleradiology Market Revenue (Million) Forecast, by Application 2019 & 2032
- Table 42: Australia Teleradiology Market Volume (K Unit) Forecast, by Application 2019 & 2032
- Table 43: South Korea Teleradiology Market Revenue (Million) Forecast, by Application 2019 & 2032
- Table 44: South Korea Teleradiology Market Volume (K Unit) Forecast, by Application 2019 & 2032
- Table 45: Rest of Asia Pacific Teleradiology Market Revenue (Million) Forecast, by Application 2019 & 2032
- Table 46: Rest of Asia Pacific Teleradiology Market Volume (K Unit) Forecast, by Application 2019 & 2032
- Table 47: Global Teleradiology Market Revenue Million Forecast, by Country 2019 & 2032
- Table 48: Global Teleradiology Market Volume K Unit Forecast, by Country 2019 & 2032
- Table 49: GCC Teleradiology Market Revenue (Million) Forecast, by Application 2019 & 2032
- Table 50: GCC Teleradiology Market Volume (K Unit) Forecast, by Application 2019 & 2032
- Table 51: South Africa Teleradiology Market Revenue (Million) Forecast, by Application 2019 & 2032
- Table 52: South Africa Teleradiology Market Volume (K Unit) Forecast, by Application 2019 & 2032
- Table 53: Rest of Middle East and Africa Teleradiology Market Revenue (Million) Forecast, by Application 2019 & 2032
- Table 54: Rest of Middle East and Africa Teleradiology Market Volume (K Unit) Forecast, by Application 2019 & 2032
- Table 55: Global Teleradiology Market Revenue Million Forecast, by Country 2019 & 2032
- Table 56: Global Teleradiology Market Volume K Unit Forecast, by Country 2019 & 2032
- Table 57: Brazil Teleradiology Market Revenue (Million) Forecast, by Application 2019 & 2032
- Table 58: Brazil Teleradiology Market Volume (K Unit) Forecast, by Application 2019 & 2032
- Table 59: Argentina Teleradiology Market Revenue (Million) Forecast, by Application 2019 & 2032
- Table 60: Argentina Teleradiology Market Volume (K Unit) Forecast, by Application 2019 & 2032
- Table 61: Rest of South America Teleradiology Market Revenue (Million) Forecast, by Application 2019 & 2032
- Table 62: Rest of South America Teleradiology Market Volume (K Unit) Forecast, by Application 2019 & 2032
- Table 63: Global Teleradiology Market Revenue Million Forecast, by Imaging Technique 2019 & 2032
- Table 64: Global Teleradiology Market Volume K Unit Forecast, by Imaging Technique 2019 & 2032
- Table 65: Global Teleradiology Market Revenue Million Forecast, by Component 2019 & 2032
- Table 66: Global Teleradiology Market Volume K Unit Forecast, by Component 2019 & 2032
- Table 67: Global Teleradiology Market Revenue Million Forecast, by End User 2019 & 2032
- Table 68: Global Teleradiology Market Volume K Unit Forecast, by End User 2019 & 2032
- Table 69: Global Teleradiology Market Revenue Million Forecast, by Country 2019 & 2032
- Table 70: Global Teleradiology Market Volume K Unit Forecast, by Country 2019 & 2032
- Table 71: United States Teleradiology Market Revenue (Million) Forecast, by Application 2019 & 2032
- Table 72: United States Teleradiology Market Volume (K Unit) Forecast, by Application 2019 & 2032
- Table 73: Canada Teleradiology Market Revenue (Million) Forecast, by Application 2019 & 2032
- Table 74: Canada Teleradiology Market Volume (K Unit) Forecast, by Application 2019 & 2032
- Table 75: Mexico Teleradiology Market Revenue (Million) Forecast, by Application 2019 & 2032
- Table 76: Mexico Teleradiology Market Volume (K Unit) Forecast, by Application 2019 & 2032
- Table 77: Global Teleradiology Market Revenue Million Forecast, by Imaging Technique 2019 & 2032
- Table 78: Global Teleradiology Market Volume K Unit Forecast, by Imaging Technique 2019 & 2032
- Table 79: Global Teleradiology Market Revenue Million Forecast, by Component 2019 & 2032
- Table 80: Global Teleradiology Market Volume K Unit Forecast, by Component 2019 & 2032
- Table 81: Global Teleradiology Market Revenue Million Forecast, by End User 2019 & 2032
- Table 82: Global Teleradiology Market Volume K Unit Forecast, by End User 2019 & 2032
- Table 83: Global Teleradiology Market Revenue Million Forecast, by Country 2019 & 2032
- Table 84: Global Teleradiology Market Volume K Unit Forecast, by Country 2019 & 2032
- Table 85: Germany Teleradiology Market Revenue (Million) Forecast, by Application 2019 & 2032
- Table 86: Germany Teleradiology Market Volume (K Unit) Forecast, by Application 2019 & 2032
- Table 87: United Kingdom Teleradiology Market Revenue (Million) Forecast, by Application 2019 & 2032
- Table 88: United Kingdom Teleradiology Market Volume (K Unit) Forecast, by Application 2019 & 2032
- Table 89: France Teleradiology Market Revenue (Million) Forecast, by Application 2019 & 2032
- Table 90: France Teleradiology Market Volume (K Unit) Forecast, by Application 2019 & 2032
- Table 91: Italy Teleradiology Market Revenue (Million) Forecast, by Application 2019 & 2032
- Table 92: Italy Teleradiology Market Volume (K Unit) Forecast, by Application 2019 & 2032
- Table 93: Spain Teleradiology Market Revenue (Million) Forecast, by Application 2019 & 2032
- Table 94: Spain Teleradiology Market Volume (K Unit) Forecast, by Application 2019 & 2032
- Table 95: Rest of Europe Teleradiology Market Revenue (Million) Forecast, by Application 2019 & 2032
- Table 96: Rest of Europe Teleradiology Market Volume (K Unit) Forecast, by Application 2019 & 2032
- Table 97: Global Teleradiology Market Revenue Million Forecast, by Imaging Technique 2019 & 2032
- Table 98: Global Teleradiology Market Volume K Unit Forecast, by Imaging Technique 2019 & 2032
- Table 99: Global Teleradiology Market Revenue Million Forecast, by Component 2019 & 2032
- Table 100: Global Teleradiology Market Volume K Unit Forecast, by Component 2019 & 2032
- Table 101: Global Teleradiology Market Revenue Million Forecast, by End User 2019 & 2032
- Table 102: Global Teleradiology Market Volume K Unit Forecast, by End User 2019 & 2032
- Table 103: Global Teleradiology Market Revenue Million Forecast, by Country 2019 & 2032
- Table 104: Global Teleradiology Market Volume K Unit Forecast, by Country 2019 & 2032
- Table 105: China Teleradiology Market Revenue (Million) Forecast, by Application 2019 & 2032
- Table 106: China Teleradiology Market Volume (K Unit) Forecast, by Application 2019 & 2032
- Table 107: Japan Teleradiology Market Revenue (Million) Forecast, by Application 2019 & 2032
- Table 108: Japan Teleradiology Market Volume (K Unit) Forecast, by Application 2019 & 2032
- Table 109: India Teleradiology Market Revenue (Million) Forecast, by Application 2019 & 2032
- Table 110: India Teleradiology Market Volume (K Unit) Forecast, by Application 2019 & 2032
- Table 111: Australia Teleradiology Market Revenue (Million) Forecast, by Application 2019 & 2032
- Table 112: Australia Teleradiology Market Volume (K Unit) Forecast, by Application 2019 & 2032
- Table 113: South Korea Teleradiology Market Revenue (Million) Forecast, by Application 2019 & 2032
- Table 114: South Korea Teleradiology Market Volume (K Unit) Forecast, by Application 2019 & 2032
- Table 115: Rest of Asia Pacific Teleradiology Market Revenue (Million) Forecast, by Application 2019 & 2032
- Table 116: Rest of Asia Pacific Teleradiology Market Volume (K Unit) Forecast, by Application 2019 & 2032
- Table 117: Global Teleradiology Market Revenue Million Forecast, by Imaging Technique 2019 & 2032
- Table 118: Global Teleradiology Market Volume K Unit Forecast, by Imaging Technique 2019 & 2032
- Table 119: Global Teleradiology Market Revenue Million Forecast, by Component 2019 & 2032
- Table 120: Global Teleradiology Market Volume K Unit Forecast, by Component 2019 & 2032
- Table 121: Global Teleradiology Market Revenue Million Forecast, by End User 2019 & 2032
- Table 122: Global Teleradiology Market Volume K Unit Forecast, by End User 2019 & 2032
- Table 123: Global Teleradiology Market Revenue Million Forecast, by Country 2019 & 2032
- Table 124: Global Teleradiology Market Volume K Unit Forecast, by Country 2019 & 2032
- Table 125: GCC Teleradiology Market Revenue (Million) Forecast, by Application 2019 & 2032
- Table 126: GCC Teleradiology Market Volume (K Unit) Forecast, by Application 2019 & 2032
- Table 127: South Africa Teleradiology Market Revenue (Million) Forecast, by Application 2019 & 2032
- Table 128: South Africa Teleradiology Market Volume (K Unit) Forecast, by Application 2019 & 2032
- Table 129: Rest of Middle East and Africa Teleradiology Market Revenue (Million) Forecast, by Application 2019 & 2032
- Table 130: Rest of Middle East and Africa Teleradiology Market Volume (K Unit) Forecast, by Application 2019 & 2032
- Table 131: Global Teleradiology Market Revenue Million Forecast, by Imaging Technique 2019 & 2032
- Table 132: Global Teleradiology Market Volume K Unit Forecast, by Imaging Technique 2019 & 2032
- Table 133: Global Teleradiology Market Revenue Million Forecast, by Component 2019 & 2032
- Table 134: Global Teleradiology Market Volume K Unit Forecast, by Component 2019 & 2032
- Table 135: Global Teleradiology Market Revenue Million Forecast, by End User 2019 & 2032
- Table 136: Global Teleradiology Market Volume K Unit Forecast, by End User 2019 & 2032
- Table 137: Global Teleradiology Market Revenue Million Forecast, by Country 2019 & 2032
- Table 138: Global Teleradiology Market Volume K Unit Forecast, by Country 2019 & 2032
- Table 139: Brazil Teleradiology Market Revenue (Million) Forecast, by Application 2019 & 2032
- Table 140: Brazil Teleradiology Market Volume (K Unit) Forecast, by Application 2019 & 2032
- Table 141: Argentina Teleradiology Market Revenue (Million) Forecast, by Application 2019 & 2032
- Table 142: Argentina Teleradiology Market Volume (K Unit) Forecast, by Application 2019 & 2032
- Table 143: Rest of South America Teleradiology Market Revenue (Million) Forecast, by Application 2019 & 2032
- Table 144: Rest of South America Teleradiology Market Volume (K Unit) Forecast, by Application 2019 & 2032
Frequently Asked Questions
1. What is the projected Compound Annual Growth Rate (CAGR) of the Teleradiology Market?
The projected CAGR is approximately 14.33%.
2. Which companies are prominent players in the Teleradiology Market?
Key companies in the market include Onrad Inc, RamSoft Inc, GE Healthcare, Nanox Imaging LTD (USARAD COM), Everlight Radiology, HealthWatch TeleDiagnostics Private Limited, Koninklijke Philips NV, 4ways Healthcare Ltd, Teleradiology Solutions, Carestream Health, Agfa-Gevaert Group.
3. What are the main segments of the Teleradiology Market?
The market segments include Imaging Technique, Component, End User.
4. Can you provide details about the market size?
The market size is estimated to be USD 39.90 Million as of 2022.
5. What are some drivers contributing to market growth?
Rising Number of Imaging Procedures; Development of IT Infrastructure and Rise in Healthcare Expenditure; Increasing Prevalence of Osteoarthritis and Chronic Diseases.
6. What are the notable trends driving market growth?
Software Segment is Expected to Register Fastest Growth Over the Forecast Period.
7. Are there any restraints impacting market growth?
Lack of Skilled Professionals; Security Concerns Associated with Teleradiology.
8. Can you provide examples of recent developments in the market?
April 2023: Aster DM Healthcare opened its Telecommand Center and Digital Health facility in India, which uses cutting-edge technology to provide all telehealth services under one roof, including teleradiology.
9. What pricing options are available for accessing the report?
Pricing options include single-user, multi-user, and enterprise licenses priced at USD 4750, USD 5250, and USD 8750 respectively.
10. Is the market size provided in terms of value or volume?
The market size is provided in terms of value, measured in Million and volume, measured in K Unit.
11. Are there any specific market keywords associated with the report?
Yes, the market keyword associated with the report is "Teleradiology Market," which aids in identifying and referencing the specific market segment covered.
12. How do I determine which pricing option suits my needs best?
The pricing options vary based on user requirements and access needs. Individual users may opt for single-user licenses, while businesses requiring broader access may choose multi-user or enterprise licenses for cost-effective access to the report.
13. Are there any additional resources or data provided in the Teleradiology Market report?
While the report offers comprehensive insights, it's advisable to review the specific contents or supplementary materials provided to ascertain if additional resources or data are available.
14. How can I stay updated on further developments or reports in the Teleradiology Market?
To stay informed about further developments, trends, and reports in the Teleradiology Market, consider subscribing to industry newsletters, following relevant companies and organizations, or regularly checking reputable industry news sources and publications.
Methodology
Step 1 - Identification of Relevant Samples Size from Population Database


Step 2 - Approaches for Defining Global Market Size (Value, Volume* & Price*)

Note*: In applicable scenarios
Step 3 - Data Sources
Primary Research
- Web Analytics
- Survey Reports
- Research Institute
- Latest Research Reports
- Opinion Leaders
Secondary Research
- Annual Reports
- White Paper
- Latest Press Release
- Industry Association
- Paid Database
- Investor Presentations

Step 4 - Data Triangulation
Involves using different sources of information in order to increase the validity of a study
These sources are likely to be stakeholders in a program - participants, other researchers, program staff, other community members, and so on.
Then we put all data in single framework & apply various statistical tools to find out the dynamic on the market.
During the analysis stage, feedback from the stakeholder groups would be compared to determine areas of agreement as well as areas of divergence
