

Key Insights
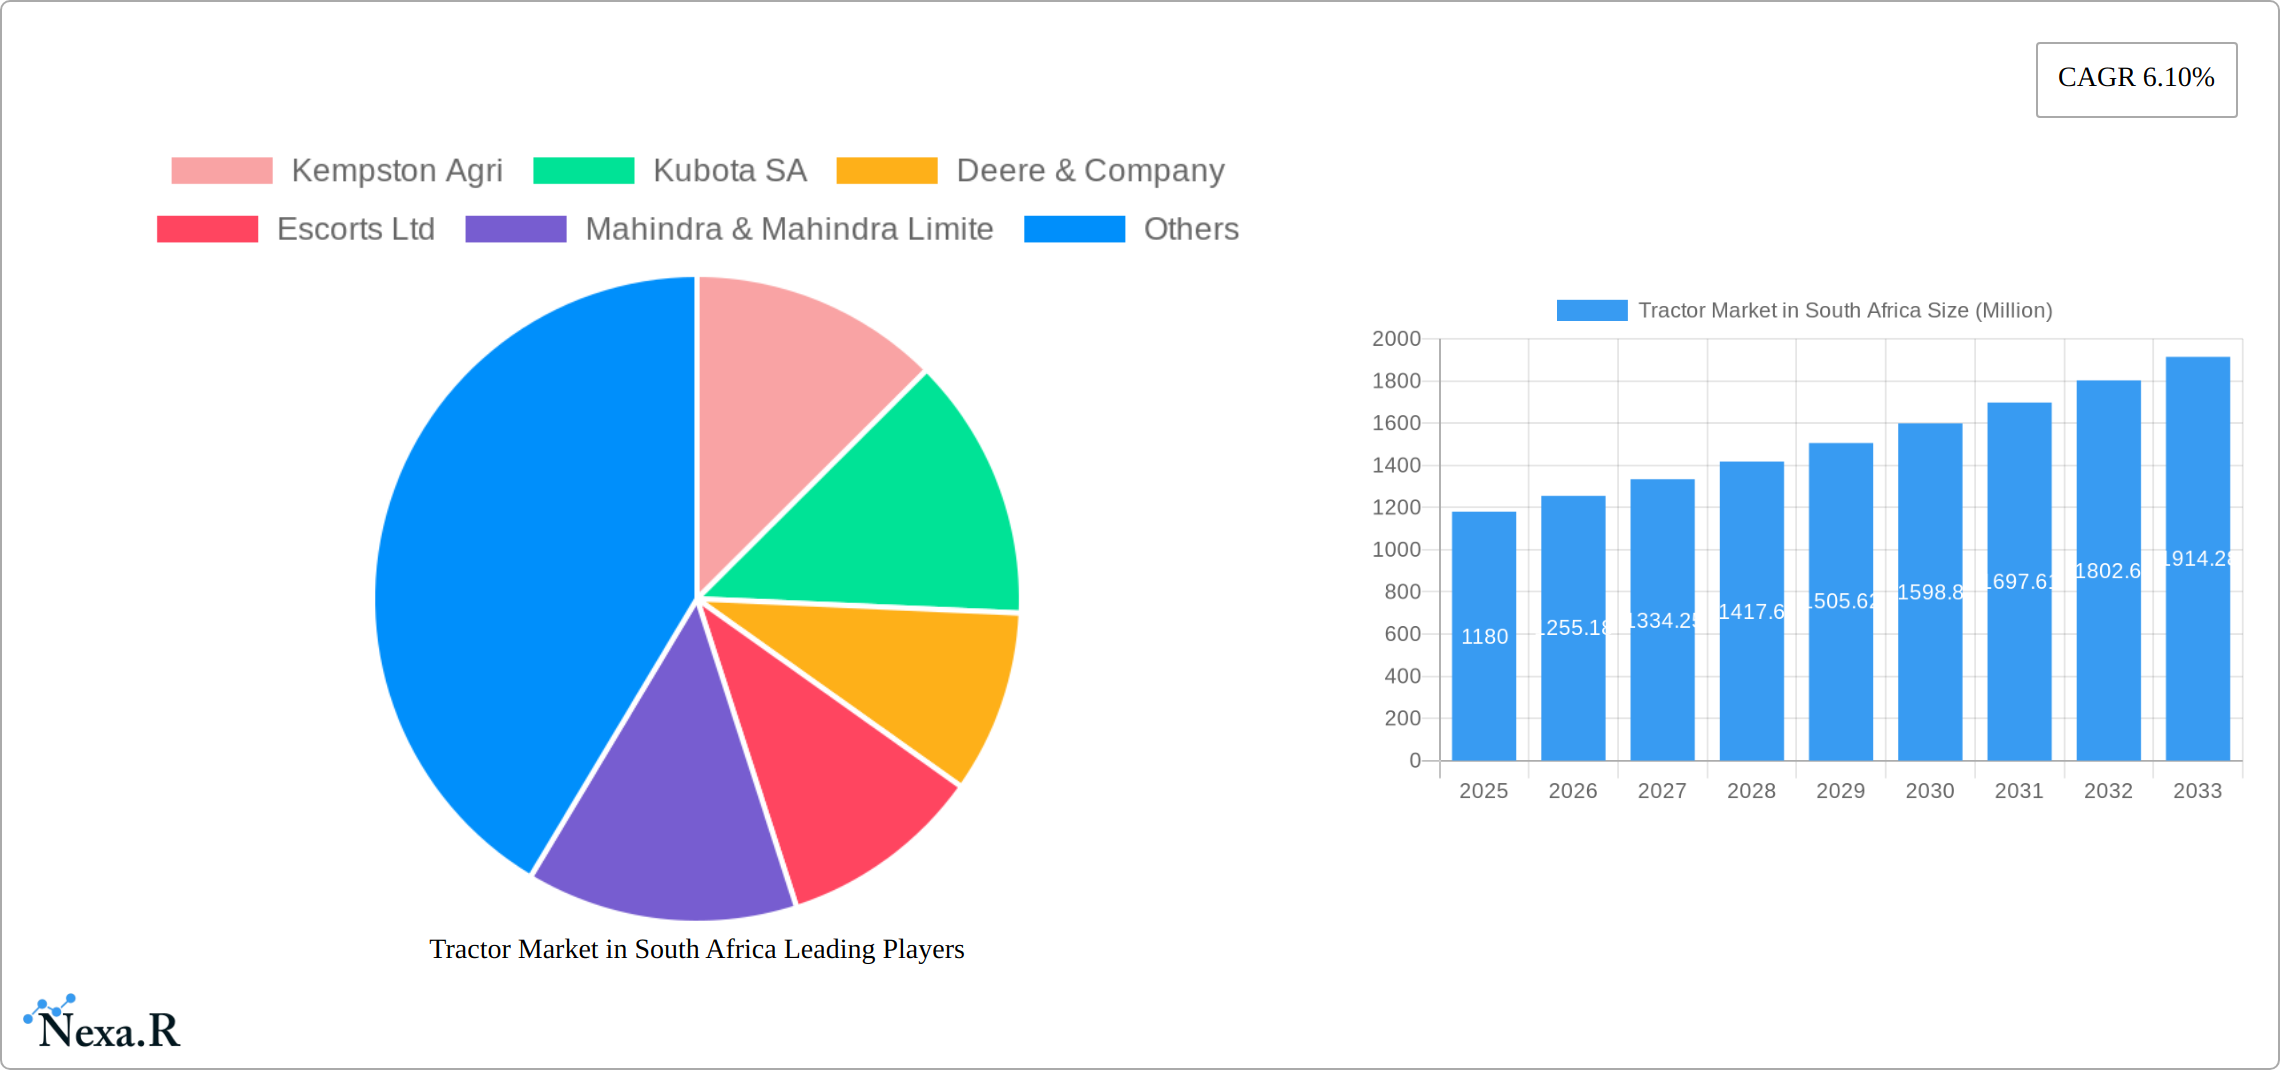
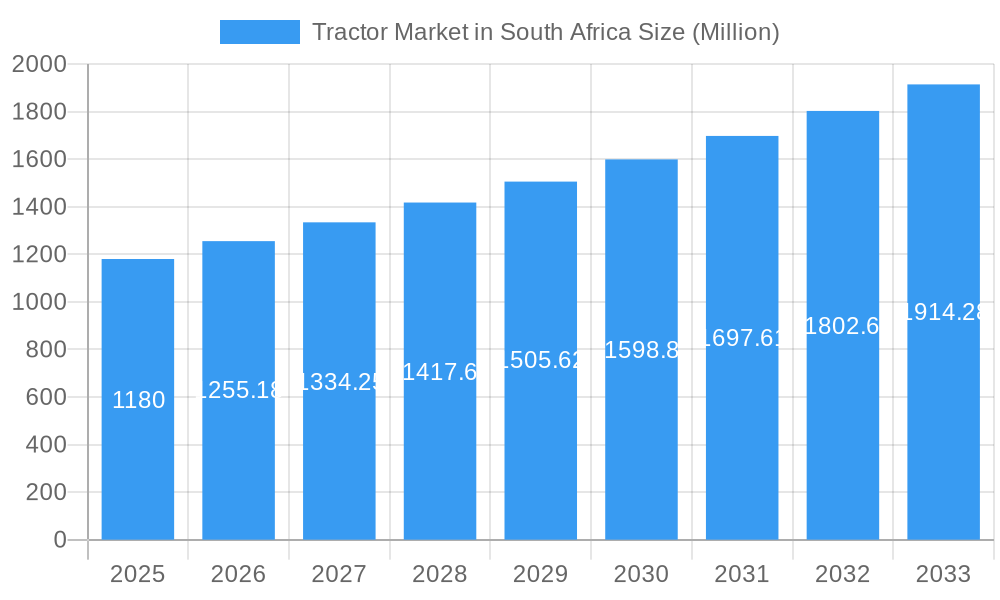
The South African tractor market, valued at $1.18 billion in 2025, is projected to experience robust growth, driven by increasing agricultural mechanization needs and government initiatives promoting agricultural modernization. A Compound Annual Growth Rate (CAGR) of 6.10% is anticipated from 2025 to 2033, indicating a significant expansion of the market. Key drivers include rising demand for high-efficiency tractors, particularly in the 35-100 HP range, fueled by the need for increased productivity and reduced labor costs across diverse farming operations. Expanding agricultural land under cultivation and the government's focus on food security further bolster market growth. However, factors like fluctuating fuel prices, high initial investment costs for advanced machinery, and the potential impact of climate change on agricultural yields represent potential restraints. Market segmentation reveals a strong preference for tractors within the 35-75 HP segment, reflecting the prevalent farm sizes and crop types. Leading players like Kubota, Deere & Company, Mahindra & Mahindra, and Escorts Ltd. are key competitors in this dynamic market. South Africa's significant role as an agricultural hub within Africa positions it for continued growth, although regional economic factors and infrastructure development will influence the overall expansion trajectory. The market’s future success hinges on addressing challenges related to affordability, technological adoption, and sustainable agricultural practices.
Tractor Market in South Africa Market Size (In Billion)
The competitive landscape is intense, with both international and domestic players vying for market share. The focus is shifting towards technologically advanced tractors equipped with precision farming technologies like GPS-guided systems and automated features. This trend increases efficiency, reduces waste, and improves yields. Moreover, the growing awareness of sustainable agricultural practices and the demand for fuel-efficient tractors are creating new opportunities for manufacturers offering environmentally friendly solutions. The South African government’s initiatives promoting agricultural development and farmer training programs will play a crucial role in driving market growth in the coming years. The strategic alliances and partnerships forged between manufacturers and local distributors will play a crucial role in ensuring market penetration and reaching a wider range of farmers. Understanding the specific needs of various agricultural segments—from smallholder farmers to large-scale commercial operations—is key to success within this competitive and expanding market.
Tractor Market in South Africa Company Market Share
Tractor Market in South Africa: A Comprehensive Market Report (2019-2033)
This comprehensive report provides a detailed analysis of the South African tractor market, encompassing market dynamics, growth trends, key players, and future outlook. With a focus on the parent market (Agricultural Machinery) and child market (Tractors), this report is invaluable for industry professionals, investors, and strategic decision-makers seeking to understand and capitalize on opportunities within this dynamic sector. The study period covers 2019-2033, with 2025 as the base year. Projected market values are presented in million units.
Tractor Market in South Africa: Market Dynamics & Structure
The South African tractor market is characterized by a moderately concentrated landscape, with several multinational and local players competing for market share. Technological innovation, driven by precision agriculture and automation, is a significant driver, but adoption is influenced by factors such as affordability and farmer digital literacy. Regulatory frameworks, including import tariffs and safety standards, also play a crucial role. Competitive product substitutes, such as animal labor and smaller machinery, still exist, particularly in smaller farming operations. The end-user demographics consist primarily of commercial farms, but a growing segment of smallholder farmers presents a notable opportunity. Mergers and acquisitions (M&A) activity has been relatively moderate in recent years, with xx deals recorded between 2019 and 2024.
- Market Concentration: Moderately concentrated, with the top 5 players holding an estimated xx% market share in 2024.
- Technological Innovation: Significant advancements in automation, GPS guidance, and precision spraying are increasing efficiency but face adoption barriers related to cost and training.
- Regulatory Framework: Import tariffs and safety regulations influence pricing and product availability.
- Competitive Substitutes: Animal labor and smaller scale equipment remain competitive, particularly in smaller farming operations.
- End-User Demographics: Dominated by commercial farms, with a growing segment of smallholder farmers.
- M&A Activity: xx deals recorded between 2019 and 2024, indicating moderate consolidation.
Tractor Market in South Africa: Growth Trends & Insights
The South African tractor market experienced a fluctuating growth trajectory between 2019 and 2024, influenced by factors such as economic conditions, agricultural output, and government policies. While the market experienced a contraction in xx due to [specific reason, e.g., drought], a rebound is anticipated. The adoption rate of modern tractors is steadily increasing, driven by the growing need for enhanced productivity and efficiency. Technological disruptions, such as the rise of precision agriculture technologies and the increasing integration of digital tools, are accelerating market transformation. Consumer behavior shifts towards larger and more technologically advanced tractors are also observed, especially among larger commercial farming operations. The market is projected to grow at a CAGR of xx% during the forecast period (2025-2033), reaching a market size of xx million units by 2033. Market penetration is estimated to reach xx% by 2033.
Dominant Regions, Countries, or Segments in Tractor Market in South Africa
The market is geographically concentrated, with the majority of tractor sales occurring in the major agricultural provinces. Within the engine power segments, the 51-75 HP range represents the largest segment, driven by the prevalence of medium-sized farms. However, the higher HP segments (above 100 HP) are exhibiting faster growth rates, driven by large-scale commercial farming operations seeking to increase efficiency and output.
- Key Drivers:
- Favorable government policies: Support for agricultural modernization and access to financing.
- Growing agricultural output: Increased demand for efficient farming practices.
- Infrastructure development: Improved road networks facilitating transportation and distribution.
- Dominance Factors:
- Market Share: The 51-75 HP segment holds the largest market share (xx%) in 2024.
- Growth Potential: The above 100 HP segment is projected to experience the fastest growth in the forecast period.
Tractor Market in South Africa: Product Landscape
The South African tractor market offers a diverse range of products, encompassing various engine powers, features, and functionalities. Technological advancements include increased automation, improved fuel efficiency, and enhanced precision capabilities. Key selling propositions focus on reliability, durability, and affordability. Manufacturers are increasingly incorporating GPS-guided systems and other smart technologies to enhance precision agriculture practices.
Key Drivers, Barriers & Challenges in Tractor Market in South Africa
Key Drivers: The South African tractor market is propelled by a multifaceted set of factors. The persistent and escalating demand for food security, driven by a growing population, necessitates increased agricultural output. This, in turn, fuels the drive towards greater mechanization of agricultural processes, enhancing efficiency and productivity. Government initiatives aimed at modernizing the agricultural sector, including subsidies and policy support, play a crucial role. Furthermore, the availability of favorable financing options and accessible credit schemes for both large-scale and emerging farmers significantly lowers the barrier to entry and investment.
Challenges: Despite the positive momentum, the market faces substantial hurdles. The high initial investment costs associated with purchasing new tractors remain a significant deterrent for many farmers, particularly smallholders. Limited access to affordable credit, despite existing schemes, continues to restrict the ability of many smallholder farmers to acquire essential machinery. Volatile fuel prices introduce unpredictability into operational costs, impacting profitability. The robust market for secondhand tractors offers a more budget-friendly alternative, posing a competitive challenge to new tractor sales. The lingering effects of supply chain disruptions, exacerbated by global events like the COVID-19 pandemic, have led to extended lead times and uncertainty regarding the availability of both new equipment and crucial spare parts. This logistical strain contributed to an estimated 15% reduction in tractor sales in 2022, highlighting the vulnerability of the market to external shocks.
Emerging Opportunities in Tractor Market in South Africa
The South African tractor market is ripe with emerging opportunities. The rapidly expanding segment of smallholder farmers presents a substantial market for smaller, more agile, and affordably priced tractor models, tailored to their specific needs and financial capacities. Concurrently, the increasing adoption of precision agriculture technologies, such as GPS guidance, variable rate application, and sensor technology, opens avenues for growth in value-added services, including data analytics, farm management software, and precision farming consultancy. A growing emphasis on sustainable and environmentally friendly farming practices also presents a significant growth area, creating demand for electric or hybrid tractors and implements that minimize environmental impact and promote soil health.
Growth Accelerators in the Tractor Market in South Africa Industry
Technological advancements in automation and precision agriculture are key growth catalysts. Strategic partnerships between tractor manufacturers and agricultural technology companies are fostering innovation and market expansion. Government initiatives supporting agricultural modernization and providing access to financing further accelerate market growth.
Key Players Shaping the Tractor Market in South Africa Market
- Kempston Agri
- Kubota SA
- Deere & Company
- Escorts Ltd
- Mahindra & Mahindra Limited
- CNH Industrial America LLC
- Argo Tractors SpA
- AGCO Corporation
Notable Milestones in Tractor Market in South Africa Sector
- November 2021: Mahindra South Africa significantly expanded its product portfolio and market reach with the launch of a new, comprehensive range of tractors and farm equipment, catering to diverse agricultural needs.
- June 2022: Argo Tractors South Africa demonstrated its long-term commitment to the South African market by inaugurating a new, modern head office, which also bolstered its local assembly capabilities and operational efficiency.
- August 2022: A strategic investment by Deere & Company in Hello Tractor marked a pivotal moment, aiming to enhance access to farm equipment for smallholder farmers across the continent, with the potential to significantly expand market reach and adoption rates of modern farming techniques.
In-Depth Tractor Market in South Africa Market Outlook
The South African tractor market is poised for continued growth, driven by factors such as increasing agricultural output, technological advancements, and supportive government policies. Strategic partnerships and the expansion of financing options will further facilitate market penetration, particularly within the smallholder farmer segment. The focus on sustainable agricultural practices and the integration of precision agriculture technologies offer significant opportunities for innovation and growth in the coming years.
Tractor Market in South Africa Segmentation
-
1. Engine Power
- 1.1. Less than 35 HP
- 1.2. 35 to 50 HP
- 1.3. 51 to 75 HP
- 1.4. 76 to 100 HP
- 1.5. Above 100 HP
-
2. Geography
- 2.1. South Africa
- 2.2. Kenya
- 2.3. Egypt
- 2.4. Rest of Africa
-
3. Engine Power
- 3.1. Less than 35 HP
- 3.2. 35 to 50 HP
- 3.3. 51 to 75 HP
- 3.4. 76 to 100 HP
- 3.5. Above 100 HP
Tractor Market in South Africa Segmentation By Geography
- 1. South Africa
- 2. Kenya
- 3. Egypt
- 4. Rest of Africa
Tractor Market in South Africa Regional Market Share
Geographic Coverage of Tractor Market in South Africa
Tractor Market in South Africa REPORT HIGHLIGHTS
| Aspects | Details |
|---|---|
| Study Period | 2020-2034 |
| Base Year | 2025 |
| Estimated Year | 2026 |
| Forecast Period | 2026-2034 |
| Historical Period | 2020-2025 |
| Growth Rate | CAGR of 6.10% from 2020-2034 |
| Segmentation |
|
Table of Contents
- 1. Introduction
- 1.1. Research Scope
- 1.2. Market Segmentation
- 1.3. Research Objective
- 1.4. Definitions and Assumptions
- 2. Executive Summary
- 2.1. Market Snapshot
- 3. Market Dynamics
- 3.1. Market Drivers
- 3.2. Market Restrains
- 3.3. Market Trends
- 3.4. Market Opportunities
- 4. Market Factor Analysis
- 4.1. Porters Five Forces
- 4.1.1. Bargaining Power of Suppliers
- 4.1.2. Bargaining Power of Buyers
- 4.1.3. Threat of New Entrants
- 4.1.4. Threat of Substitutes
- 4.1.5. Competitive Rivalry
- 4.2. PESTEL analysis
- 4.3. BCG Analysis
- 4.3.1. Stars (High Growth, High Market Share)
- 4.3.2. Cash Cows (Low Growth, High Market Share)
- 4.3.3. Question Mark (High Growth, Low Market Share)
- 4.3.4. Dogs (Low Growth, Low Market Share)
- 4.4. Ansoff Matrix Analysis
- 4.5. Supply Chain Analysis
- 4.6. Regulatory Landscape
- 4.7. Current Market Potential and Opportunity Assessment (TAM–SAM–SOM Framework)
- 4.8. NRP Analyst Note
- 4.1. Porters Five Forces
- 5. Market Analysis, Insights and Forecast 2021-2033
- 5.1. Market Analysis, Insights and Forecast - by Engine Power
- 5.1.1. Less than 35 HP
- 5.1.2. 35 to 50 HP
- 5.1.3. 51 to 75 HP
- 5.1.4. 76 to 100 HP
- 5.1.5. Above 100 HP
- 5.2. Market Analysis, Insights and Forecast - by Geography
- 5.2.1. South Africa
- 5.2.2. Kenya
- 5.2.3. Egypt
- 5.2.4. Rest of Africa
- 5.3. Market Analysis, Insights and Forecast - by Engine Power
- 5.3.1. Less than 35 HP
- 5.3.2. 35 to 50 HP
- 5.3.3. 51 to 75 HP
- 5.3.4. 76 to 100 HP
- 5.3.5. Above 100 HP
- 5.4. Market Analysis, Insights and Forecast - by Region
- 5.4.1. South Africa
- 5.4.2. Kenya
- 5.4.3. Egypt
- 5.4.4. Rest of Africa
- 5.1. Market Analysis, Insights and Forecast - by Engine Power
- 6. Tractor Market in South Africa Analysis, Insights and Forecast, 2021-2033
- 6.1. Market Analysis, Insights and Forecast - by Engine Power
- 6.1.1. Less than 35 HP
- 6.1.2. 35 to 50 HP
- 6.1.3. 51 to 75 HP
- 6.1.4. 76 to 100 HP
- 6.1.5. Above 100 HP
- 6.2. Market Analysis, Insights and Forecast - by Geography
- 6.2.1. South Africa
- 6.2.2. Kenya
- 6.2.3. Egypt
- 6.2.4. Rest of Africa
- 6.3. Market Analysis, Insights and Forecast - by Engine Power
- 6.3.1. Less than 35 HP
- 6.3.2. 35 to 50 HP
- 6.3.3. 51 to 75 HP
- 6.3.4. 76 to 100 HP
- 6.3.5. Above 100 HP
- 6.1. Market Analysis, Insights and Forecast - by Engine Power
- 7. South Africa Tractor Market in South Africa Analysis, Insights and Forecast, 2020-2032
- 7.1. Market Analysis, Insights and Forecast - by Engine Power
- 7.1.1. Less than 35 HP
- 7.1.2. 35 to 50 HP
- 7.1.3. 51 to 75 HP
- 7.1.4. 76 to 100 HP
- 7.1.5. Above 100 HP
- 7.2. Market Analysis, Insights and Forecast - by Geography
- 7.2.1. South Africa
- 7.2.2. Kenya
- 7.2.3. Egypt
- 7.2.4. Rest of Africa
- 7.3. Market Analysis, Insights and Forecast - by Engine Power
- 7.3.1. Less than 35 HP
- 7.3.2. 35 to 50 HP
- 7.3.3. 51 to 75 HP
- 7.3.4. 76 to 100 HP
- 7.3.5. Above 100 HP
- 7.1. Market Analysis, Insights and Forecast - by Engine Power
- 8. Kenya Tractor Market in South Africa Analysis, Insights and Forecast, 2020-2032
- 8.1. Market Analysis, Insights and Forecast - by Engine Power
- 8.1.1. Less than 35 HP
- 8.1.2. 35 to 50 HP
- 8.1.3. 51 to 75 HP
- 8.1.4. 76 to 100 HP
- 8.1.5. Above 100 HP
- 8.2. Market Analysis, Insights and Forecast - by Geography
- 8.2.1. South Africa
- 8.2.2. Kenya
- 8.2.3. Egypt
- 8.2.4. Rest of Africa
- 8.3. Market Analysis, Insights and Forecast - by Engine Power
- 8.3.1. Less than 35 HP
- 8.3.2. 35 to 50 HP
- 8.3.3. 51 to 75 HP
- 8.3.4. 76 to 100 HP
- 8.3.5. Above 100 HP
- 8.1. Market Analysis, Insights and Forecast - by Engine Power
- 9. Egypt Tractor Market in South Africa Analysis, Insights and Forecast, 2020-2032
- 9.1. Market Analysis, Insights and Forecast - by Engine Power
- 9.1.1. Less than 35 HP
- 9.1.2. 35 to 50 HP
- 9.1.3. 51 to 75 HP
- 9.1.4. 76 to 100 HP
- 9.1.5. Above 100 HP
- 9.2. Market Analysis, Insights and Forecast - by Geography
- 9.2.1. South Africa
- 9.2.2. Kenya
- 9.2.3. Egypt
- 9.2.4. Rest of Africa
- 9.3. Market Analysis, Insights and Forecast - by Engine Power
- 9.3.1. Less than 35 HP
- 9.3.2. 35 to 50 HP
- 9.3.3. 51 to 75 HP
- 9.3.4. 76 to 100 HP
- 9.3.5. Above 100 HP
- 9.1. Market Analysis, Insights and Forecast - by Engine Power
- 10. Rest of Africa Tractor Market in South Africa Analysis, Insights and Forecast, 2020-2032
- 10.1. Market Analysis, Insights and Forecast - by Engine Power
- 10.1.1. Less than 35 HP
- 10.1.2. 35 to 50 HP
- 10.1.3. 51 to 75 HP
- 10.1.4. 76 to 100 HP
- 10.1.5. Above 100 HP
- 10.2. Market Analysis, Insights and Forecast - by Geography
- 10.2.1. South Africa
- 10.2.2. Kenya
- 10.2.3. Egypt
- 10.2.4. Rest of Africa
- 10.3. Market Analysis, Insights and Forecast - by Engine Power
- 10.3.1. Less than 35 HP
- 10.3.2. 35 to 50 HP
- 10.3.3. 51 to 75 HP
- 10.3.4. 76 to 100 HP
- 10.3.5. Above 100 HP
- 10.1. Market Analysis, Insights and Forecast - by Engine Power
- 11. Competitive Analysis
- 11.1. Company Profiles
- 11.1.1 Kempston Agri
- 11.1.1.1. Company Overview
- 11.1.1.2. Products
- 11.1.1.3. Company Financials
- 11.1.1.4. SWOT Analysis
- 11.1.2 Kubota SA
- 11.1.2.1. Company Overview
- 11.1.2.2. Products
- 11.1.2.3. Company Financials
- 11.1.2.4. SWOT Analysis
- 11.1.3 Deere & Company
- 11.1.3.1. Company Overview
- 11.1.3.2. Products
- 11.1.3.3. Company Financials
- 11.1.3.4. SWOT Analysis
- 11.1.4 Escorts Ltd
- 11.1.4.1. Company Overview
- 11.1.4.2. Products
- 11.1.4.3. Company Financials
- 11.1.4.4. SWOT Analysis
- 11.1.5 Mahindra & Mahindra Limite
- 11.1.5.1. Company Overview
- 11.1.5.2. Products
- 11.1.5.3. Company Financials
- 11.1.5.4. SWOT Analysis
- 11.1.6 CNH Industrial America LLC
- 11.1.6.1. Company Overview
- 11.1.6.2. Products
- 11.1.6.3. Company Financials
- 11.1.6.4. SWOT Analysis
- 11.1.7 Argo Tractors SpA
- 11.1.7.1. Company Overview
- 11.1.7.2. Products
- 11.1.7.3. Company Financials
- 11.1.7.4. SWOT Analysis
- 11.1.8 AGCO Corporation
- 11.1.8.1. Company Overview
- 11.1.8.2. Products
- 11.1.8.3. Company Financials
- 11.1.8.4. SWOT Analysis
- 11.1.1 Kempston Agri
- 11.2. Market Entropy
- 11.2.1 Company's Key Areas Served
- 11.2.2 Recent Developments
- 11.3. Company Market Share Analysis 2025
- 11.3.1 Top 5 Companies Market Share Analysis
- 11.3.2 Top 3 Companies Market Share Analysis
- 11.4. List of Potential Customers
- 12. Research Methodology
List of Figures
- Figure 1: Tractor Market in South Africa Revenue Breakdown (Million, %) by Product 2025 & 2033
- Figure 2: Tractor Market in South Africa Share (%) by Company 2025
List of Tables
- Table 1: Tractor Market in South Africa Revenue Million Forecast, by Engine Power 2020 & 2033
- Table 2: Tractor Market in South Africa Revenue Million Forecast, by Geography 2020 & 2033
- Table 3: Tractor Market in South Africa Revenue Million Forecast, by Engine Power 2020 & 2033
- Table 4: Tractor Market in South Africa Revenue Million Forecast, by Region 2020 & 2033
- Table 5: Tractor Market in South Africa Revenue Million Forecast, by Engine Power 2020 & 2033
- Table 6: Tractor Market in South Africa Revenue Million Forecast, by Geography 2020 & 2033
- Table 7: Tractor Market in South Africa Revenue Million Forecast, by Engine Power 2020 & 2033
- Table 8: Tractor Market in South Africa Revenue Million Forecast, by Country 2020 & 2033
- Table 9: Tractor Market in South Africa Revenue Million Forecast, by Engine Power 2020 & 2033
- Table 10: Tractor Market in South Africa Revenue Million Forecast, by Geography 2020 & 2033
- Table 11: Tractor Market in South Africa Revenue Million Forecast, by Engine Power 2020 & 2033
- Table 12: Tractor Market in South Africa Revenue Million Forecast, by Country 2020 & 2033
- Table 13: Tractor Market in South Africa Revenue Million Forecast, by Engine Power 2020 & 2033
- Table 14: Tractor Market in South Africa Revenue Million Forecast, by Geography 2020 & 2033
- Table 15: Tractor Market in South Africa Revenue Million Forecast, by Engine Power 2020 & 2033
- Table 16: Tractor Market in South Africa Revenue Million Forecast, by Country 2020 & 2033
- Table 17: Tractor Market in South Africa Revenue Million Forecast, by Engine Power 2020 & 2033
- Table 18: Tractor Market in South Africa Revenue Million Forecast, by Geography 2020 & 2033
- Table 19: Tractor Market in South Africa Revenue Million Forecast, by Engine Power 2020 & 2033
- Table 20: Tractor Market in South Africa Revenue Million Forecast, by Country 2020 & 2033
Frequently Asked Questions
1. What is the projected Compound Annual Growth Rate (CAGR) of the Tractor Market in South Africa?
The projected CAGR is approximately 6.10%.
2. Which companies are prominent players in the Tractor Market in South Africa?
Key companies in the market include Kempston Agri, Kubota SA, Deere & Company, Escorts Ltd, Mahindra & Mahindra Limite, CNH Industrial America LLC, Argo Tractors SpA, AGCO Corporation.
3. What are the main segments of the Tractor Market in South Africa?
The market segments include Engine Power, Geography, Engine Power.
4. Can you provide details about the market size?
The market size is estimated to be USD 1.18 Million as of 2022.
5. What are some drivers contributing to market growth?
Increasing Demand for Tomato; Adoption of Greenhouse Technology in Tomato Cultivation; Government support.
6. What are the notable trends driving market growth?
Increasing Focus on Sustainable Agricultural Mechanization.
7. Are there any restraints impacting market growth?
Increasing Loses due to Physiological Disorder. Pest and Disease; Unfavourable Climatic Condition.
8. Can you provide examples of recent developments in the market?
June 2022: Agricultural vehicle supplier Argo Tractors South Africa inaugurated its new head office in South Africa. The new premise was built at the cost of USD 5. 88 million, hosts a 6000 square meter building, including office space, a 650 square meter showroom, a 100 square meter training facility, 2300 square meters dedicated to assembly, and 2000 square meters designated for spares.
9. What pricing options are available for accessing the report?
Pricing options include single-user, multi-user, and enterprise licenses priced at USD 4750, USD 5250, and USD 8750 respectively.
10. Is the market size provided in terms of value or volume?
The market size is provided in terms of value, measured in Million.
11. Are there any specific market keywords associated with the report?
Yes, the market keyword associated with the report is "Tractor Market in South Africa," which aids in identifying and referencing the specific market segment covered.
12. How do I determine which pricing option suits my needs best?
The pricing options vary based on user requirements and access needs. Individual users may opt for single-user licenses, while businesses requiring broader access may choose multi-user or enterprise licenses for cost-effective access to the report.
13. Are there any additional resources or data provided in the Tractor Market in South Africa report?
While the report offers comprehensive insights, it's advisable to review the specific contents or supplementary materials provided to ascertain if additional resources or data are available.
14. How can I stay updated on further developments or reports in the Tractor Market in South Africa?
To stay informed about further developments, trends, and reports in the Tractor Market in South Africa, consider subscribing to industry newsletters, following relevant companies and organizations, or regularly checking reputable industry news sources and publications.
Methodology
Step 1 - Identification of Relevant Samples Size from Population Database


Step 2 - Approaches for Defining Global Market Size (Value, Volume* & Price*)

Note*: In applicable scenarios
Step 3 - Data Sources
Primary Research
- Web Analytics
- Survey Reports
- Research Institute
- Latest Research Reports
- Opinion Leaders
Secondary Research
- Annual Reports
- White Paper
- Latest Press Release
- Industry Association
- Paid Database
- Investor Presentations

Step 4 - Data Triangulation
Involves using different sources of information in order to increase the validity of a study
These sources are likely to be stakeholders in a program - participants, other researchers, program staff, other community members, and so on.
Then we put all data in single framework & apply various statistical tools to find out the dynamic on the market.
During the analysis stage, feedback from the stakeholder groups would be compared to determine areas of agreement as well as areas of divergence