

Key Insights
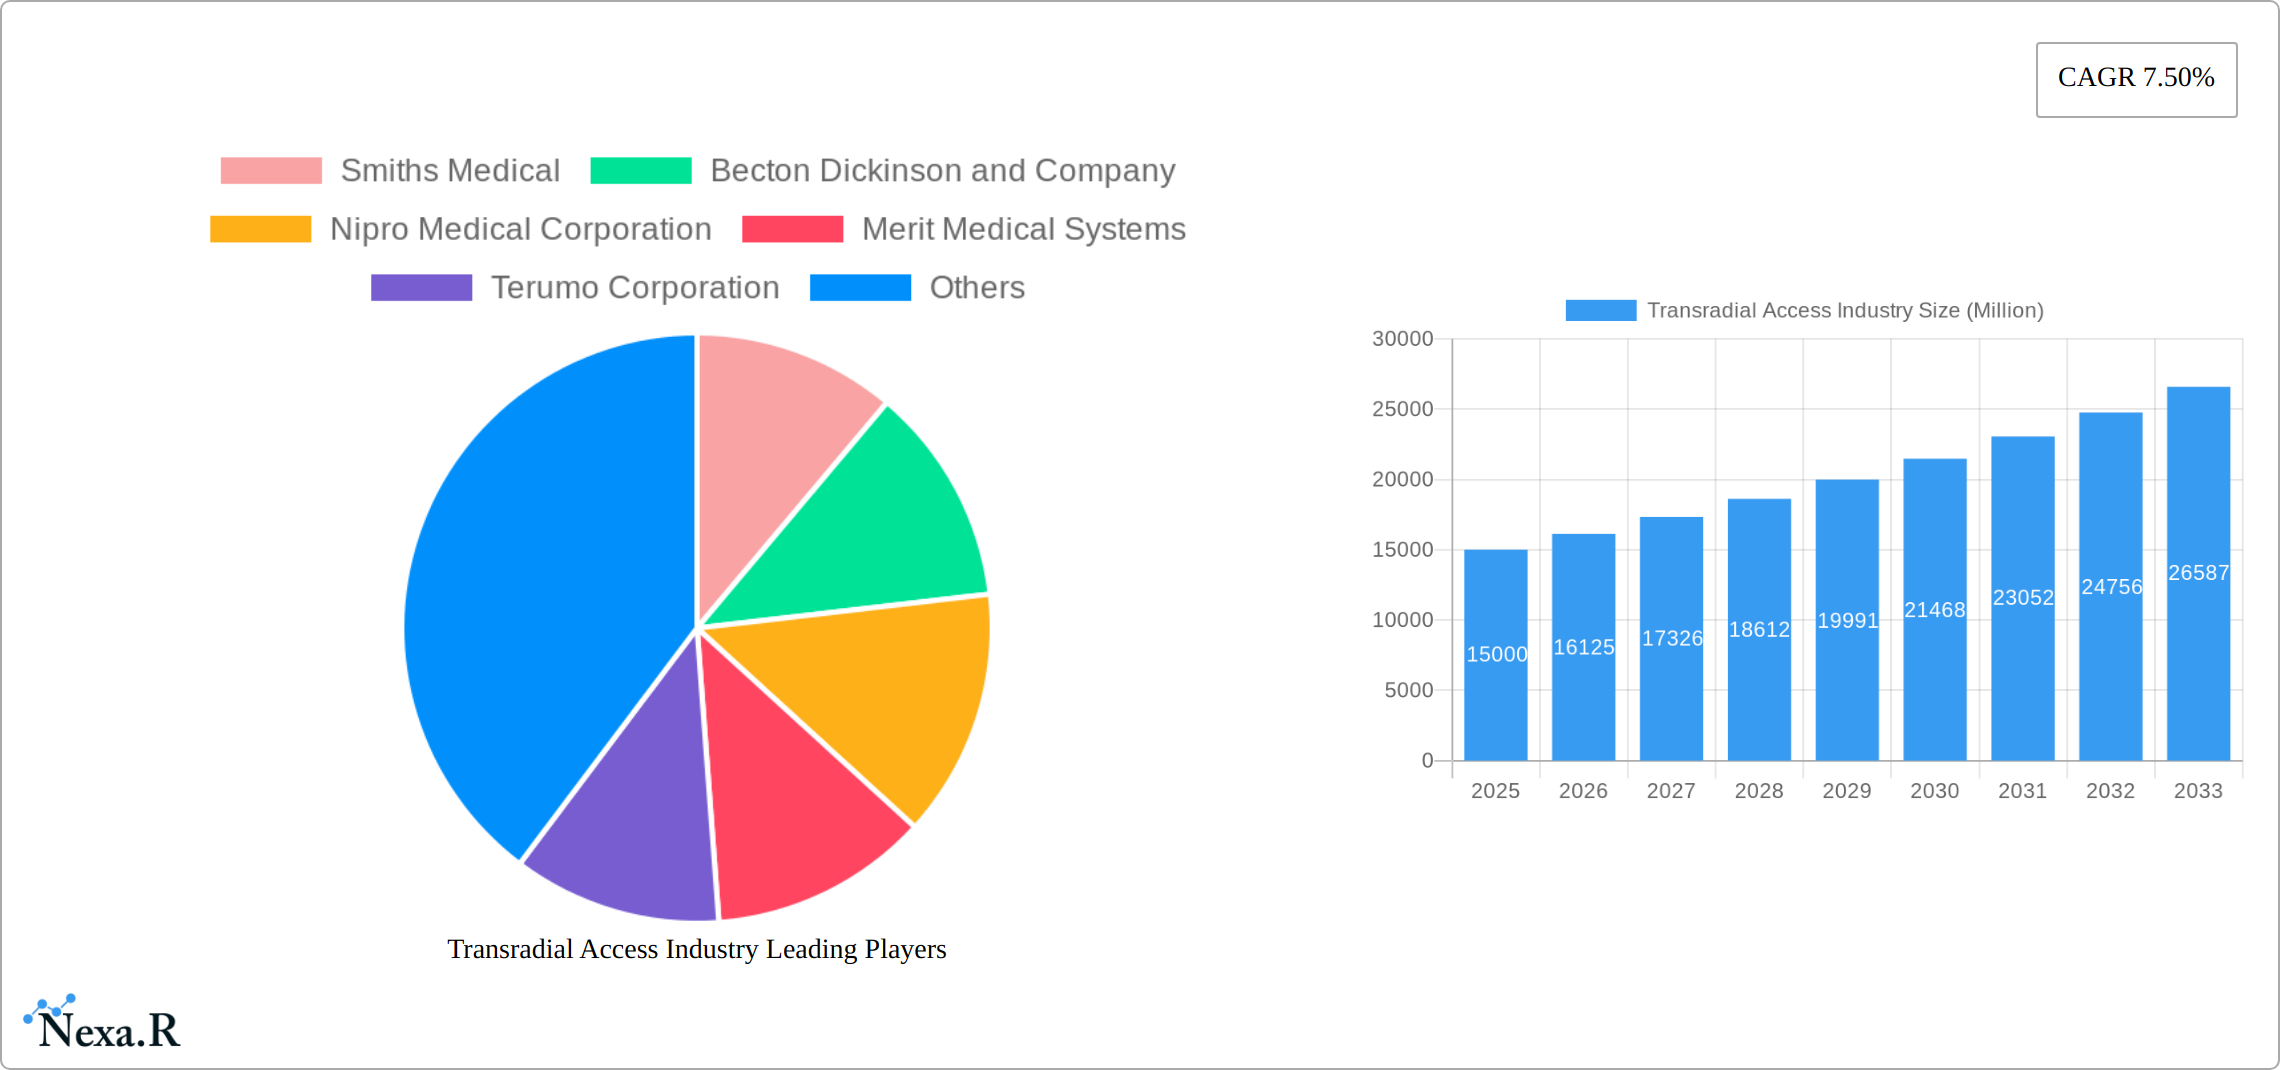
The transradial access market, encompassing catheters, guidewires, sheaths, and related accessories, is experiencing robust growth, driven by a rising preference for less invasive procedures and improved patient outcomes. The market's 7.50% CAGR from 2019-2024 suggests a substantial expansion, projected to continue into the forecast period (2025-2033). This growth is fueled by several key factors. Firstly, the increasing prevalence of cardiovascular diseases globally necessitates more frequent interventions, driving demand for minimally invasive techniques. Transradial access offers advantages such as reduced bleeding complications, shorter hospital stays, and quicker patient recovery, making it increasingly favored by both physicians and patients. Secondly, technological advancements leading to improved device designs and functionalities contribute significantly to market expansion. Manufacturers are focusing on developing smaller, more flexible catheters and guidewires that enhance procedural efficiency and reduce complications. Finally, the growing number of specialized interventional centers and the rising adoption of transradial access techniques in emerging economies are further contributing to market growth.
While the market presents significant opportunities, certain challenges exist. High initial investment costs for specialized training and equipment might hinder adoption in resource-constrained settings. Moreover, procedural complexity and the need for skilled operators could limit the widespread implementation of transradial access in certain regions. The market segmentation reveals a strong demand across various applications, including drug administration, fluid management, and diagnostic testing, with hospitals and clinics representing the major end-users. The competitive landscape is characterized by several established players, including Smiths Medical, Becton Dickinson, and Boston Scientific, engaged in continuous innovation and expansion to capture market share. Regional analysis indicates that North America currently holds a significant share, followed by Europe and Asia-Pacific, with the latter exhibiting substantial growth potential driven by increasing healthcare infrastructure and rising disposable incomes. The consistent growth trajectory and numerous driving forces suggest the transradial access market will maintain its upward trajectory over the next decade.
Transradial Access Industry Market Report: 2019-2033
This comprehensive report provides a detailed analysis of the Transradial Access industry, encompassing market dynamics, growth trends, regional performance, product landscape, and key players. The report covers the period from 2019 to 2033, with a focus on the 2025-2033 forecast period. This crucial market analysis caters to medical device manufacturers, healthcare providers, investors, and industry professionals seeking insights into this rapidly evolving sector.
Transradial Access Industry Market Dynamics & Structure
The transradial access market, a dynamic sub-segment within the broader interventional cardiology and vascular access devices market, is experiencing significant growth. While exhibiting moderate concentration among key players, the market is characterized by intense competition driven by technological advancements and a strong focus on improving patient outcomes. The market is estimated to reach $XX Million by 2025 (replace XX with actual figures). This growth is fueled by several key factors:
- Market Concentration and Competition: The market displays a moderately concentrated structure with the top 5 players holding approximately 60% of the market share in 2025 (replace with actual figures). However, competition remains fierce, with companies vying for market share through product differentiation, focusing on improvements in efficacy, safety, ease of use, and reduced procedural times.
- Technological Innovation: Continuous advancements in catheter design, materials science, and imaging capabilities are crucial drivers. Miniaturization, improved biocompatibility, and enhanced visualization technologies are key areas of focus.
- Regulatory Landscape: Stringent regulatory approvals, including FDA clearance in the US and CE marking in Europe, present significant barriers to entry and influence product lifecycles. Compliance and navigating these regulatory pathways are crucial for market success.
- Competitive Landscape and Substitutes: While traditional femoral access remains a viable alternative, transradial access is gaining significant traction due to its demonstrably reduced complication rates, shorter recovery times, and improved patient comfort, thereby fueling market expansion.
- Mergers and Acquisitions (M&A) Activity: The last 5 years have witnessed moderate M&A activity within the sector, with approximately XX deals (replace XX with actual number) completed, averaging a deal value of $XX Million (replace XX with actual figures). These activities are driven by strategic expansion and technology acquisitions.
Transradial Access Industry Growth Trends & Insights
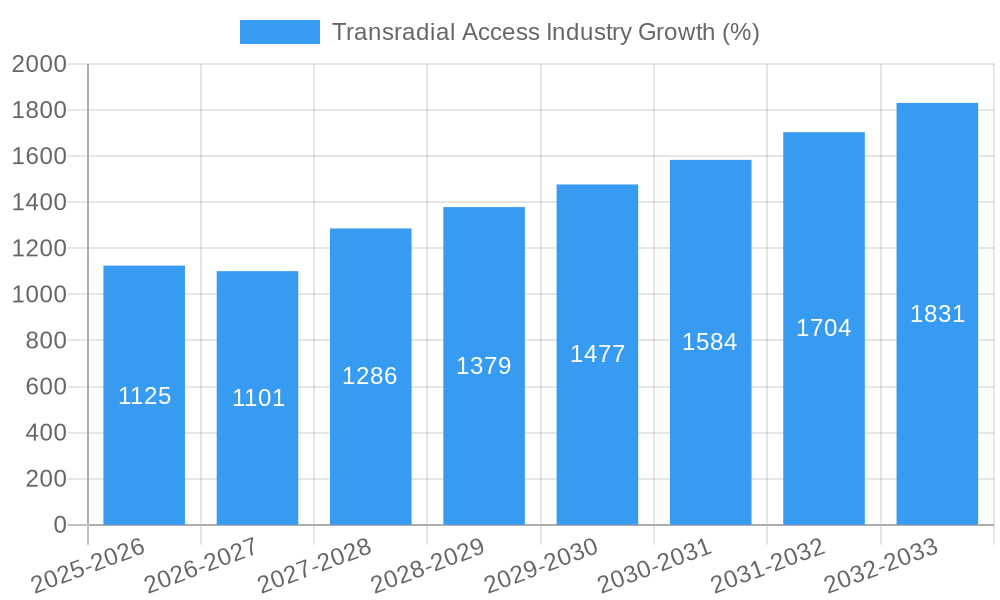
The Transradial Access market exhibits robust growth, driven by increasing preference for minimally invasive procedures, rising prevalence of cardiovascular diseases, and the growing adoption of transradial access techniques among healthcare professionals. The market is projected to witness a CAGR of xx% during the forecast period (2025-2033), reaching an estimated size of $xx Million by 2033. This growth is fueled by technological advancements leading to improved device performance and reduced procedural complications. The increasing awareness among physicians about the benefits of transradial access, including reduced bleeding complications and shorter hospital stays, is further driving market expansion. Changes in consumer behavior, with patients seeking less invasive options, also contribute to market growth. Market penetration in developing economies remains relatively low, presenting a significant growth opportunity.
Dominant Regions, Countries, or Segments in Transradial Access Industry
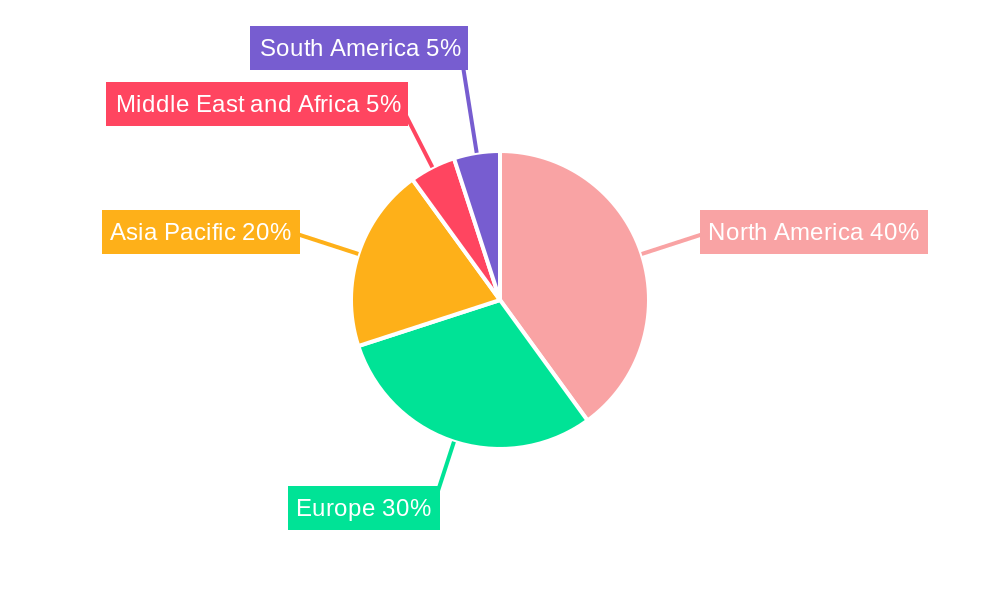
North America currently dominates the transradial access market, holding approximately xx% market share in 2025, followed by Europe with xx%. This dominance is attributed to factors such as high healthcare expenditure, advanced healthcare infrastructure, and early adoption of new technologies. However, the Asia-Pacific region is projected to exhibit the fastest growth during the forecast period, driven by rising healthcare spending, increasing prevalence of cardiovascular diseases, and growing awareness of minimally invasive procedures.
Key Growth Drivers:
- North America: High healthcare expenditure, advanced infrastructure, early technology adoption.
- Europe: Well-established healthcare systems, increasing prevalence of cardiovascular diseases.
- Asia-Pacific: Rapid economic growth, rising healthcare spending, growing awareness of minimally invasive procedures.
Dominant Segments:
- Product: Catheters hold the largest market share (xx%) due to high demand and widespread use.
- Application: Drug administration is the leading application segment (xx%), driven by the growing use of transradial access in various therapeutic interventions.
- End User: Hospitals dominate the market (xx%), due to higher procedure volumes.
Transradial Access Industry Product Landscape
The transradial access product landscape is characterized by continuous innovation, focusing on improved catheter designs, enhanced guidewire flexibility, and the development of more efficient sheath introducers. Recent advancements include the incorporation of hydrophilic coatings for smoother insertion, improved biocompatibility materials to minimize complications, and the integration of advanced imaging capabilities for precise navigation. These innovations translate to reduced procedural times, improved patient outcomes, and enhanced safety profiles, representing a key selling proposition for manufacturers.
Key Drivers, Barriers & Challenges in Transradial Access Industry
Key Drivers:
- Rising prevalence of cardiovascular diseases.
- Growing preference for minimally invasive procedures.
- Technological advancements leading to improved device performance and safety.
- Favorable reimbursement policies in developed markets.
Challenges & Restraints:
- High initial investment costs for specialized equipment.
- Steep learning curve for healthcare professionals transitioning to transradial access.
- Limited access to advanced technologies in developing markets.
- Intense competition among established and emerging players. (Estimated 20% reduction in average profitability due to competitive pressures).
Emerging Opportunities in Transradial Access Industry
- Expansion into Emerging Markets: Significant growth potential exists in untapped markets with unmet clinical needs, particularly in regions with rising prevalence of cardiovascular diseases.
- Novel Applications: Exploring and developing new applications beyond cardiology, such as in oncology and neurology, presents exciting possibilities for expanding the market's scope.
- Technological Integration: Integrating advanced imaging technologies, such as intravascular ultrasound (IVUS) and optical coherence tomography (OCT), alongside robotic-assisted systems, promises to enhance procedural precision and efficacy.
- Disposable Device Development: The development and adoption of disposable, single-use devices are gaining momentum, aiming to minimize the risk of infections and streamline the workflow, thus improving overall healthcare efficiency.
- Data-Driven Approaches: The utilization of big data analytics and AI-powered tools to improve procedural outcomes, enhance clinical decision-making, and optimize resource allocation represents a significant opportunity for innovation and growth.
Growth Accelerators in the Transradial Access Industry
Technological breakthroughs, especially in materials science and miniaturization, are crucial growth catalysts. Strategic partnerships between device manufacturers and healthcare providers accelerate market adoption and optimize procedural workflows. Expanding into untapped markets, particularly in developing countries, presents significant growth opportunities.
Key Players Shaping the Transradial Access Industry Market
- Smiths Medical
- Becton Dickinson and Company
- Nipro Medical Corporation
- Merit Medical Systems
- Terumo Corporation
- Angiodynamics Inc
- Edward Lifesciences Corporation
- Ameco Medical
- Oscor Inc
- Boston Scientific Corporation
- Teleflex Incorporated
- Medtronic plc
Notable Milestones in Transradial Access Industry Sector
- October 2021: Medtronic received CE mark approval for its radial artery access portfolio, signifying a significant advancement in the European market.
- February 2022: Launch Minnesota awarded funding to Conway Medical for a novel large-bore thrombectomy system, highlighting the ongoing investment in innovative technologies.
- [Add more recent milestones here]
In-Depth Transradial Access Industry Market Outlook
The transradial access market is projected to maintain robust growth, driven by a confluence of factors including the increasing adoption of minimally invasive procedures, technological breakthroughs, and expansion into new geographical markets. Strategic partnerships, substantial investments in research and development, and a continued focus on improving patient outcomes and reducing procedural complications will shape future market dynamics. Companies that prioritize innovation, cultivate strong relationships with healthcare providers, and effectively navigate the complexities of the regulatory landscape are best positioned to capitalize on the significant opportunities within this expanding market. The integration of advanced technologies and data-driven approaches will further accelerate market growth and improve overall patient care.
Transradial Access Industry Segmentation
-
1. Product
- 1.1. Catheters
- 1.2. Guidewires
- 1.3. Sheaths and Sheath Introducers
- 1.4. Accessories
-
2. Application
- 2.1. Drug Administration
- 2.2. Fluid and Nutrition Administration
- 2.3. Blood Transfusion
- 2.4. Diagnostics and Testing
-
3. End User
- 3.1. Hospitals
- 3.2. Clinics and Ambulatory Care Centers
- 3.3. Others
Transradial Access Industry Segmentation By Geography
-
1. North America
- 1.1. United States
- 1.2. Canada
- 1.3. Mexico
-
2. Europe
- 2.1. Germany
- 2.2. United Kingdom
- 2.3. France
- 2.4. Italy
- 2.5. Spain
- 2.6. Rest of Europe
-
3. Asia Pacific
- 3.1. China
- 3.2. Japan
- 3.3. India
- 3.4. Australia
- 3.5. South Korea
- 3.6. Rest of Asia Pacific
-
4. Middle East and Africa
- 4.1. GCC
- 4.2. South Africa
- 4.3. Rest of Middle East and Africa
-
5. South America
- 5.1. Brazil
- 5.2. Argentina
- 5.3. Rest of South America
Transradial Access Industry REPORT HIGHLIGHTS
| Aspects | Details |
|---|---|
| Study Period | 2019-2033 |
| Base Year | 2024 |
| Estimated Year | 2025 |
| Forecast Period | 2025-2033 |
| Historical Period | 2019-2024 |
| Growth Rate | CAGR of 7.50% from 2019-2033 |
| Segmentation |
|
Table of Contents
- 1. Introduction
- 1.1. Research Scope
- 1.2. Market Segmentation
- 1.3. Research Methodology
- 1.4. Definitions and Assumptions
- 2. Executive Summary
- 2.1. Introduction
- 3. Market Dynamics
- 3.1. Introduction
- 3.2. Market Drivers
- 3.2.1. Increasing Preference for Interventional Procedures Using Radial Artery Access; Growing Prevalence of Cardiovascular Diseases Due to Lifestyle Related Diseases; Growing Use of Radial Access Devices in Pediatric Patients
- 3.3. Market Restrains
- 3.3.1. High Costs Involved in the Placement and Maintenance of Vascular Access Devices; Lack of Trained Professionals
- 3.4. Market Trends
- 3.4.1. Catheters Segment is Expected to Witness Growth Over the Forecast Period
- 4. Market Factor Analysis
- 4.1. Porters Five Forces
- 4.2. Supply/Value Chain
- 4.3. PESTEL analysis
- 4.4. Market Entropy
- 4.5. Patent/Trademark Analysis
- 5. Global Transradial Access Industry Analysis, Insights and Forecast, 2019-2031
- 5.1. Market Analysis, Insights and Forecast - by Product
- 5.1.1. Catheters
- 5.1.2. Guidewires
- 5.1.3. Sheaths and Sheath Introducers
- 5.1.4. Accessories
- 5.2. Market Analysis, Insights and Forecast - by Application
- 5.2.1. Drug Administration
- 5.2.2. Fluid and Nutrition Administration
- 5.2.3. Blood Transfusion
- 5.2.4. Diagnostics and Testing
- 5.3. Market Analysis, Insights and Forecast - by End User
- 5.3.1. Hospitals
- 5.3.2. Clinics and Ambulatory Care Centers
- 5.3.3. Others
- 5.4. Market Analysis, Insights and Forecast - by Region
- 5.4.1. North America
- 5.4.2. Europe
- 5.4.3. Asia Pacific
- 5.4.4. Middle East and Africa
- 5.4.5. South America
- 5.1. Market Analysis, Insights and Forecast - by Product
- 6. North America Transradial Access Industry Analysis, Insights and Forecast, 2019-2031
- 6.1. Market Analysis, Insights and Forecast - by Product
- 6.1.1. Catheters
- 6.1.2. Guidewires
- 6.1.3. Sheaths and Sheath Introducers
- 6.1.4. Accessories
- 6.2. Market Analysis, Insights and Forecast - by Application
- 6.2.1. Drug Administration
- 6.2.2. Fluid and Nutrition Administration
- 6.2.3. Blood Transfusion
- 6.2.4. Diagnostics and Testing
- 6.3. Market Analysis, Insights and Forecast - by End User
- 6.3.1. Hospitals
- 6.3.2. Clinics and Ambulatory Care Centers
- 6.3.3. Others
- 6.1. Market Analysis, Insights and Forecast - by Product
- 7. Europe Transradial Access Industry Analysis, Insights and Forecast, 2019-2031
- 7.1. Market Analysis, Insights and Forecast - by Product
- 7.1.1. Catheters
- 7.1.2. Guidewires
- 7.1.3. Sheaths and Sheath Introducers
- 7.1.4. Accessories
- 7.2. Market Analysis, Insights and Forecast - by Application
- 7.2.1. Drug Administration
- 7.2.2. Fluid and Nutrition Administration
- 7.2.3. Blood Transfusion
- 7.2.4. Diagnostics and Testing
- 7.3. Market Analysis, Insights and Forecast - by End User
- 7.3.1. Hospitals
- 7.3.2. Clinics and Ambulatory Care Centers
- 7.3.3. Others
- 7.1. Market Analysis, Insights and Forecast - by Product
- 8. Asia Pacific Transradial Access Industry Analysis, Insights and Forecast, 2019-2031
- 8.1. Market Analysis, Insights and Forecast - by Product
- 8.1.1. Catheters
- 8.1.2. Guidewires
- 8.1.3. Sheaths and Sheath Introducers
- 8.1.4. Accessories
- 8.2. Market Analysis, Insights and Forecast - by Application
- 8.2.1. Drug Administration
- 8.2.2. Fluid and Nutrition Administration
- 8.2.3. Blood Transfusion
- 8.2.4. Diagnostics and Testing
- 8.3. Market Analysis, Insights and Forecast - by End User
- 8.3.1. Hospitals
- 8.3.2. Clinics and Ambulatory Care Centers
- 8.3.3. Others
- 8.1. Market Analysis, Insights and Forecast - by Product
- 9. Middle East and Africa Transradial Access Industry Analysis, Insights and Forecast, 2019-2031
- 9.1. Market Analysis, Insights and Forecast - by Product
- 9.1.1. Catheters
- 9.1.2. Guidewires
- 9.1.3. Sheaths and Sheath Introducers
- 9.1.4. Accessories
- 9.2. Market Analysis, Insights and Forecast - by Application
- 9.2.1. Drug Administration
- 9.2.2. Fluid and Nutrition Administration
- 9.2.3. Blood Transfusion
- 9.2.4. Diagnostics and Testing
- 9.3. Market Analysis, Insights and Forecast - by End User
- 9.3.1. Hospitals
- 9.3.2. Clinics and Ambulatory Care Centers
- 9.3.3. Others
- 9.1. Market Analysis, Insights and Forecast - by Product
- 10. South America Transradial Access Industry Analysis, Insights and Forecast, 2019-2031
- 10.1. Market Analysis, Insights and Forecast - by Product
- 10.1.1. Catheters
- 10.1.2. Guidewires
- 10.1.3. Sheaths and Sheath Introducers
- 10.1.4. Accessories
- 10.2. Market Analysis, Insights and Forecast - by Application
- 10.2.1. Drug Administration
- 10.2.2. Fluid and Nutrition Administration
- 10.2.3. Blood Transfusion
- 10.2.4. Diagnostics and Testing
- 10.3. Market Analysis, Insights and Forecast - by End User
- 10.3.1. Hospitals
- 10.3.2. Clinics and Ambulatory Care Centers
- 10.3.3. Others
- 10.1. Market Analysis, Insights and Forecast - by Product
- 11. North America Transradial Access Industry Analysis, Insights and Forecast, 2019-2031
- 11.1. Market Analysis, Insights and Forecast - By Country/Sub-region
- 11.1.1 United States
- 11.1.2 Canada
- 11.1.3 Mexico
- 12. Europe Transradial Access Industry Analysis, Insights and Forecast, 2019-2031
- 12.1. Market Analysis, Insights and Forecast - By Country/Sub-region
- 12.1.1 Germany
- 12.1.2 United Kingdom
- 12.1.3 France
- 12.1.4 Italy
- 12.1.5 Spain
- 12.1.6 Rest of Europe
- 13. Asia Pacific Transradial Access Industry Analysis, Insights and Forecast, 2019-2031
- 13.1. Market Analysis, Insights and Forecast - By Country/Sub-region
- 13.1.1 China
- 13.1.2 Japan
- 13.1.3 India
- 13.1.4 Australia
- 13.1.5 South Korea
- 13.1.6 Rest of Asia Pacific
- 14. Middle East and Africa Transradial Access Industry Analysis, Insights and Forecast, 2019-2031
- 14.1. Market Analysis, Insights and Forecast - By Country/Sub-region
- 14.1.1 GCC
- 14.1.2 South Africa
- 14.1.3 Rest of Middle East and Africa
- 15. South America Transradial Access Industry Analysis, Insights and Forecast, 2019-2031
- 15.1. Market Analysis, Insights and Forecast - By Country/Sub-region
- 15.1.1 Brazil
- 15.1.2 Argentina
- 15.1.3 Rest of South America
- 16. Competitive Analysis
- 16.1. Global Market Share Analysis 2024
- 16.2. Company Profiles
- 16.2.1 Smiths Medical
- 16.2.1.1. Overview
- 16.2.1.2. Products
- 16.2.1.3. SWOT Analysis
- 16.2.1.4. Recent Developments
- 16.2.1.5. Financials (Based on Availability)
- 16.2.2 Becton Dickinson and Company
- 16.2.2.1. Overview
- 16.2.2.2. Products
- 16.2.2.3. SWOT Analysis
- 16.2.2.4. Recent Developments
- 16.2.2.5. Financials (Based on Availability)
- 16.2.3 Nipro Medical Corporation
- 16.2.3.1. Overview
- 16.2.3.2. Products
- 16.2.3.3. SWOT Analysis
- 16.2.3.4. Recent Developments
- 16.2.3.5. Financials (Based on Availability)
- 16.2.4 Merit Medical Systems
- 16.2.4.1. Overview
- 16.2.4.2. Products
- 16.2.4.3. SWOT Analysis
- 16.2.4.4. Recent Developments
- 16.2.4.5. Financials (Based on Availability)
- 16.2.5 Terumo Corporation
- 16.2.5.1. Overview
- 16.2.5.2. Products
- 16.2.5.3. SWOT Analysis
- 16.2.5.4. Recent Developments
- 16.2.5.5. Financials (Based on Availability)
- 16.2.6 Angiodynamics Inc
- 16.2.6.1. Overview
- 16.2.6.2. Products
- 16.2.6.3. SWOT Analysis
- 16.2.6.4. Recent Developments
- 16.2.6.5. Financials (Based on Availability)
- 16.2.7 Edward Lifesciences Corporation
- 16.2.7.1. Overview
- 16.2.7.2. Products
- 16.2.7.3. SWOT Analysis
- 16.2.7.4. Recent Developments
- 16.2.7.5. Financials (Based on Availability)
- 16.2.8 Ameco Medical
- 16.2.8.1. Overview
- 16.2.8.2. Products
- 16.2.8.3. SWOT Analysis
- 16.2.8.4. Recent Developments
- 16.2.8.5. Financials (Based on Availability)
- 16.2.9 Oscor Inc
- 16.2.9.1. Overview
- 16.2.9.2. Products
- 16.2.9.3. SWOT Analysis
- 16.2.9.4. Recent Developments
- 16.2.9.5. Financials (Based on Availability)
- 16.2.10 Boston Scientific Corporation
- 16.2.10.1. Overview
- 16.2.10.2. Products
- 16.2.10.3. SWOT Analysis
- 16.2.10.4. Recent Developments
- 16.2.10.5. Financials (Based on Availability)
- 16.2.11 Teleflex Incorporated
- 16.2.11.1. Overview
- 16.2.11.2. Products
- 16.2.11.3. SWOT Analysis
- 16.2.11.4. Recent Developments
- 16.2.11.5. Financials (Based on Availability)
- 16.2.12 Medtronic plc
- 16.2.12.1. Overview
- 16.2.12.2. Products
- 16.2.12.3. SWOT Analysis
- 16.2.12.4. Recent Developments
- 16.2.12.5. Financials (Based on Availability)
- 16.2.1 Smiths Medical
List of Figures
- Figure 1: Global Transradial Access Industry Revenue Breakdown (Million, %) by Region 2024 & 2032
- Figure 2: Global Transradial Access Industry Volume Breakdown (K Unit, %) by Region 2024 & 2032
- Figure 3: North America Transradial Access Industry Revenue (Million), by Country 2024 & 2032
- Figure 4: North America Transradial Access Industry Volume (K Unit), by Country 2024 & 2032
- Figure 5: North America Transradial Access Industry Revenue Share (%), by Country 2024 & 2032
- Figure 6: North America Transradial Access Industry Volume Share (%), by Country 2024 & 2032
- Figure 7: Europe Transradial Access Industry Revenue (Million), by Country 2024 & 2032
- Figure 8: Europe Transradial Access Industry Volume (K Unit), by Country 2024 & 2032
- Figure 9: Europe Transradial Access Industry Revenue Share (%), by Country 2024 & 2032
- Figure 10: Europe Transradial Access Industry Volume Share (%), by Country 2024 & 2032
- Figure 11: Asia Pacific Transradial Access Industry Revenue (Million), by Country 2024 & 2032
- Figure 12: Asia Pacific Transradial Access Industry Volume (K Unit), by Country 2024 & 2032
- Figure 13: Asia Pacific Transradial Access Industry Revenue Share (%), by Country 2024 & 2032
- Figure 14: Asia Pacific Transradial Access Industry Volume Share (%), by Country 2024 & 2032
- Figure 15: Middle East and Africa Transradial Access Industry Revenue (Million), by Country 2024 & 2032
- Figure 16: Middle East and Africa Transradial Access Industry Volume (K Unit), by Country 2024 & 2032
- Figure 17: Middle East and Africa Transradial Access Industry Revenue Share (%), by Country 2024 & 2032
- Figure 18: Middle East and Africa Transradial Access Industry Volume Share (%), by Country 2024 & 2032
- Figure 19: South America Transradial Access Industry Revenue (Million), by Country 2024 & 2032
- Figure 20: South America Transradial Access Industry Volume (K Unit), by Country 2024 & 2032
- Figure 21: South America Transradial Access Industry Revenue Share (%), by Country 2024 & 2032
- Figure 22: South America Transradial Access Industry Volume Share (%), by Country 2024 & 2032
- Figure 23: North America Transradial Access Industry Revenue (Million), by Product 2024 & 2032
- Figure 24: North America Transradial Access Industry Volume (K Unit), by Product 2024 & 2032
- Figure 25: North America Transradial Access Industry Revenue Share (%), by Product 2024 & 2032
- Figure 26: North America Transradial Access Industry Volume Share (%), by Product 2024 & 2032
- Figure 27: North America Transradial Access Industry Revenue (Million), by Application 2024 & 2032
- Figure 28: North America Transradial Access Industry Volume (K Unit), by Application 2024 & 2032
- Figure 29: North America Transradial Access Industry Revenue Share (%), by Application 2024 & 2032
- Figure 30: North America Transradial Access Industry Volume Share (%), by Application 2024 & 2032
- Figure 31: North America Transradial Access Industry Revenue (Million), by End User 2024 & 2032
- Figure 32: North America Transradial Access Industry Volume (K Unit), by End User 2024 & 2032
- Figure 33: North America Transradial Access Industry Revenue Share (%), by End User 2024 & 2032
- Figure 34: North America Transradial Access Industry Volume Share (%), by End User 2024 & 2032
- Figure 35: North America Transradial Access Industry Revenue (Million), by Country 2024 & 2032
- Figure 36: North America Transradial Access Industry Volume (K Unit), by Country 2024 & 2032
- Figure 37: North America Transradial Access Industry Revenue Share (%), by Country 2024 & 2032
- Figure 38: North America Transradial Access Industry Volume Share (%), by Country 2024 & 2032
- Figure 39: Europe Transradial Access Industry Revenue (Million), by Product 2024 & 2032
- Figure 40: Europe Transradial Access Industry Volume (K Unit), by Product 2024 & 2032
- Figure 41: Europe Transradial Access Industry Revenue Share (%), by Product 2024 & 2032
- Figure 42: Europe Transradial Access Industry Volume Share (%), by Product 2024 & 2032
- Figure 43: Europe Transradial Access Industry Revenue (Million), by Application 2024 & 2032
- Figure 44: Europe Transradial Access Industry Volume (K Unit), by Application 2024 & 2032
- Figure 45: Europe Transradial Access Industry Revenue Share (%), by Application 2024 & 2032
- Figure 46: Europe Transradial Access Industry Volume Share (%), by Application 2024 & 2032
- Figure 47: Europe Transradial Access Industry Revenue (Million), by End User 2024 & 2032
- Figure 48: Europe Transradial Access Industry Volume (K Unit), by End User 2024 & 2032
- Figure 49: Europe Transradial Access Industry Revenue Share (%), by End User 2024 & 2032
- Figure 50: Europe Transradial Access Industry Volume Share (%), by End User 2024 & 2032
- Figure 51: Europe Transradial Access Industry Revenue (Million), by Country 2024 & 2032
- Figure 52: Europe Transradial Access Industry Volume (K Unit), by Country 2024 & 2032
- Figure 53: Europe Transradial Access Industry Revenue Share (%), by Country 2024 & 2032
- Figure 54: Europe Transradial Access Industry Volume Share (%), by Country 2024 & 2032
- Figure 55: Asia Pacific Transradial Access Industry Revenue (Million), by Product 2024 & 2032
- Figure 56: Asia Pacific Transradial Access Industry Volume (K Unit), by Product 2024 & 2032
- Figure 57: Asia Pacific Transradial Access Industry Revenue Share (%), by Product 2024 & 2032
- Figure 58: Asia Pacific Transradial Access Industry Volume Share (%), by Product 2024 & 2032
- Figure 59: Asia Pacific Transradial Access Industry Revenue (Million), by Application 2024 & 2032
- Figure 60: Asia Pacific Transradial Access Industry Volume (K Unit), by Application 2024 & 2032
- Figure 61: Asia Pacific Transradial Access Industry Revenue Share (%), by Application 2024 & 2032
- Figure 62: Asia Pacific Transradial Access Industry Volume Share (%), by Application 2024 & 2032
- Figure 63: Asia Pacific Transradial Access Industry Revenue (Million), by End User 2024 & 2032
- Figure 64: Asia Pacific Transradial Access Industry Volume (K Unit), by End User 2024 & 2032
- Figure 65: Asia Pacific Transradial Access Industry Revenue Share (%), by End User 2024 & 2032
- Figure 66: Asia Pacific Transradial Access Industry Volume Share (%), by End User 2024 & 2032
- Figure 67: Asia Pacific Transradial Access Industry Revenue (Million), by Country 2024 & 2032
- Figure 68: Asia Pacific Transradial Access Industry Volume (K Unit), by Country 2024 & 2032
- Figure 69: Asia Pacific Transradial Access Industry Revenue Share (%), by Country 2024 & 2032
- Figure 70: Asia Pacific Transradial Access Industry Volume Share (%), by Country 2024 & 2032
- Figure 71: Middle East and Africa Transradial Access Industry Revenue (Million), by Product 2024 & 2032
- Figure 72: Middle East and Africa Transradial Access Industry Volume (K Unit), by Product 2024 & 2032
- Figure 73: Middle East and Africa Transradial Access Industry Revenue Share (%), by Product 2024 & 2032
- Figure 74: Middle East and Africa Transradial Access Industry Volume Share (%), by Product 2024 & 2032
- Figure 75: Middle East and Africa Transradial Access Industry Revenue (Million), by Application 2024 & 2032
- Figure 76: Middle East and Africa Transradial Access Industry Volume (K Unit), by Application 2024 & 2032
- Figure 77: Middle East and Africa Transradial Access Industry Revenue Share (%), by Application 2024 & 2032
- Figure 78: Middle East and Africa Transradial Access Industry Volume Share (%), by Application 2024 & 2032
- Figure 79: Middle East and Africa Transradial Access Industry Revenue (Million), by End User 2024 & 2032
- Figure 80: Middle East and Africa Transradial Access Industry Volume (K Unit), by End User 2024 & 2032
- Figure 81: Middle East and Africa Transradial Access Industry Revenue Share (%), by End User 2024 & 2032
- Figure 82: Middle East and Africa Transradial Access Industry Volume Share (%), by End User 2024 & 2032
- Figure 83: Middle East and Africa Transradial Access Industry Revenue (Million), by Country 2024 & 2032
- Figure 84: Middle East and Africa Transradial Access Industry Volume (K Unit), by Country 2024 & 2032
- Figure 85: Middle East and Africa Transradial Access Industry Revenue Share (%), by Country 2024 & 2032
- Figure 86: Middle East and Africa Transradial Access Industry Volume Share (%), by Country 2024 & 2032
- Figure 87: South America Transradial Access Industry Revenue (Million), by Product 2024 & 2032
- Figure 88: South America Transradial Access Industry Volume (K Unit), by Product 2024 & 2032
- Figure 89: South America Transradial Access Industry Revenue Share (%), by Product 2024 & 2032
- Figure 90: South America Transradial Access Industry Volume Share (%), by Product 2024 & 2032
- Figure 91: South America Transradial Access Industry Revenue (Million), by Application 2024 & 2032
- Figure 92: South America Transradial Access Industry Volume (K Unit), by Application 2024 & 2032
- Figure 93: South America Transradial Access Industry Revenue Share (%), by Application 2024 & 2032
- Figure 94: South America Transradial Access Industry Volume Share (%), by Application 2024 & 2032
- Figure 95: South America Transradial Access Industry Revenue (Million), by End User 2024 & 2032
- Figure 96: South America Transradial Access Industry Volume (K Unit), by End User 2024 & 2032
- Figure 97: South America Transradial Access Industry Revenue Share (%), by End User 2024 & 2032
- Figure 98: South America Transradial Access Industry Volume Share (%), by End User 2024 & 2032
- Figure 99: South America Transradial Access Industry Revenue (Million), by Country 2024 & 2032
- Figure 100: South America Transradial Access Industry Volume (K Unit), by Country 2024 & 2032
- Figure 101: South America Transradial Access Industry Revenue Share (%), by Country 2024 & 2032
- Figure 102: South America Transradial Access Industry Volume Share (%), by Country 2024 & 2032
List of Tables
- Table 1: Global Transradial Access Industry Revenue Million Forecast, by Region 2019 & 2032
- Table 2: Global Transradial Access Industry Volume K Unit Forecast, by Region 2019 & 2032
- Table 3: Global Transradial Access Industry Revenue Million Forecast, by Product 2019 & 2032
- Table 4: Global Transradial Access Industry Volume K Unit Forecast, by Product 2019 & 2032
- Table 5: Global Transradial Access Industry Revenue Million Forecast, by Application 2019 & 2032
- Table 6: Global Transradial Access Industry Volume K Unit Forecast, by Application 2019 & 2032
- Table 7: Global Transradial Access Industry Revenue Million Forecast, by End User 2019 & 2032
- Table 8: Global Transradial Access Industry Volume K Unit Forecast, by End User 2019 & 2032
- Table 9: Global Transradial Access Industry Revenue Million Forecast, by Region 2019 & 2032
- Table 10: Global Transradial Access Industry Volume K Unit Forecast, by Region 2019 & 2032
- Table 11: Global Transradial Access Industry Revenue Million Forecast, by Country 2019 & 2032
- Table 12: Global Transradial Access Industry Volume K Unit Forecast, by Country 2019 & 2032
- Table 13: United States Transradial Access Industry Revenue (Million) Forecast, by Application 2019 & 2032
- Table 14: United States Transradial Access Industry Volume (K Unit) Forecast, by Application 2019 & 2032
- Table 15: Canada Transradial Access Industry Revenue (Million) Forecast, by Application 2019 & 2032
- Table 16: Canada Transradial Access Industry Volume (K Unit) Forecast, by Application 2019 & 2032
- Table 17: Mexico Transradial Access Industry Revenue (Million) Forecast, by Application 2019 & 2032
- Table 18: Mexico Transradial Access Industry Volume (K Unit) Forecast, by Application 2019 & 2032
- Table 19: Global Transradial Access Industry Revenue Million Forecast, by Country 2019 & 2032
- Table 20: Global Transradial Access Industry Volume K Unit Forecast, by Country 2019 & 2032
- Table 21: Germany Transradial Access Industry Revenue (Million) Forecast, by Application 2019 & 2032
- Table 22: Germany Transradial Access Industry Volume (K Unit) Forecast, by Application 2019 & 2032
- Table 23: United Kingdom Transradial Access Industry Revenue (Million) Forecast, by Application 2019 & 2032
- Table 24: United Kingdom Transradial Access Industry Volume (K Unit) Forecast, by Application 2019 & 2032
- Table 25: France Transradial Access Industry Revenue (Million) Forecast, by Application 2019 & 2032
- Table 26: France Transradial Access Industry Volume (K Unit) Forecast, by Application 2019 & 2032
- Table 27: Italy Transradial Access Industry Revenue (Million) Forecast, by Application 2019 & 2032
- Table 28: Italy Transradial Access Industry Volume (K Unit) Forecast, by Application 2019 & 2032
- Table 29: Spain Transradial Access Industry Revenue (Million) Forecast, by Application 2019 & 2032
- Table 30: Spain Transradial Access Industry Volume (K Unit) Forecast, by Application 2019 & 2032
- Table 31: Rest of Europe Transradial Access Industry Revenue (Million) Forecast, by Application 2019 & 2032
- Table 32: Rest of Europe Transradial Access Industry Volume (K Unit) Forecast, by Application 2019 & 2032
- Table 33: Global Transradial Access Industry Revenue Million Forecast, by Country 2019 & 2032
- Table 34: Global Transradial Access Industry Volume K Unit Forecast, by Country 2019 & 2032
- Table 35: China Transradial Access Industry Revenue (Million) Forecast, by Application 2019 & 2032
- Table 36: China Transradial Access Industry Volume (K Unit) Forecast, by Application 2019 & 2032
- Table 37: Japan Transradial Access Industry Revenue (Million) Forecast, by Application 2019 & 2032
- Table 38: Japan Transradial Access Industry Volume (K Unit) Forecast, by Application 2019 & 2032
- Table 39: India Transradial Access Industry Revenue (Million) Forecast, by Application 2019 & 2032
- Table 40: India Transradial Access Industry Volume (K Unit) Forecast, by Application 2019 & 2032
- Table 41: Australia Transradial Access Industry Revenue (Million) Forecast, by Application 2019 & 2032
- Table 42: Australia Transradial Access Industry Volume (K Unit) Forecast, by Application 2019 & 2032
- Table 43: South Korea Transradial Access Industry Revenue (Million) Forecast, by Application 2019 & 2032
- Table 44: South Korea Transradial Access Industry Volume (K Unit) Forecast, by Application 2019 & 2032
- Table 45: Rest of Asia Pacific Transradial Access Industry Revenue (Million) Forecast, by Application 2019 & 2032
- Table 46: Rest of Asia Pacific Transradial Access Industry Volume (K Unit) Forecast, by Application 2019 & 2032
- Table 47: Global Transradial Access Industry Revenue Million Forecast, by Country 2019 & 2032
- Table 48: Global Transradial Access Industry Volume K Unit Forecast, by Country 2019 & 2032
- Table 49: GCC Transradial Access Industry Revenue (Million) Forecast, by Application 2019 & 2032
- Table 50: GCC Transradial Access Industry Volume (K Unit) Forecast, by Application 2019 & 2032
- Table 51: South Africa Transradial Access Industry Revenue (Million) Forecast, by Application 2019 & 2032
- Table 52: South Africa Transradial Access Industry Volume (K Unit) Forecast, by Application 2019 & 2032
- Table 53: Rest of Middle East and Africa Transradial Access Industry Revenue (Million) Forecast, by Application 2019 & 2032
- Table 54: Rest of Middle East and Africa Transradial Access Industry Volume (K Unit) Forecast, by Application 2019 & 2032
- Table 55: Global Transradial Access Industry Revenue Million Forecast, by Country 2019 & 2032
- Table 56: Global Transradial Access Industry Volume K Unit Forecast, by Country 2019 & 2032
- Table 57: Brazil Transradial Access Industry Revenue (Million) Forecast, by Application 2019 & 2032
- Table 58: Brazil Transradial Access Industry Volume (K Unit) Forecast, by Application 2019 & 2032
- Table 59: Argentina Transradial Access Industry Revenue (Million) Forecast, by Application 2019 & 2032
- Table 60: Argentina Transradial Access Industry Volume (K Unit) Forecast, by Application 2019 & 2032
- Table 61: Rest of South America Transradial Access Industry Revenue (Million) Forecast, by Application 2019 & 2032
- Table 62: Rest of South America Transradial Access Industry Volume (K Unit) Forecast, by Application 2019 & 2032
- Table 63: Global Transradial Access Industry Revenue Million Forecast, by Product 2019 & 2032
- Table 64: Global Transradial Access Industry Volume K Unit Forecast, by Product 2019 & 2032
- Table 65: Global Transradial Access Industry Revenue Million Forecast, by Application 2019 & 2032
- Table 66: Global Transradial Access Industry Volume K Unit Forecast, by Application 2019 & 2032
- Table 67: Global Transradial Access Industry Revenue Million Forecast, by End User 2019 & 2032
- Table 68: Global Transradial Access Industry Volume K Unit Forecast, by End User 2019 & 2032
- Table 69: Global Transradial Access Industry Revenue Million Forecast, by Country 2019 & 2032
- Table 70: Global Transradial Access Industry Volume K Unit Forecast, by Country 2019 & 2032
- Table 71: United States Transradial Access Industry Revenue (Million) Forecast, by Application 2019 & 2032
- Table 72: United States Transradial Access Industry Volume (K Unit) Forecast, by Application 2019 & 2032
- Table 73: Canada Transradial Access Industry Revenue (Million) Forecast, by Application 2019 & 2032
- Table 74: Canada Transradial Access Industry Volume (K Unit) Forecast, by Application 2019 & 2032
- Table 75: Mexico Transradial Access Industry Revenue (Million) Forecast, by Application 2019 & 2032
- Table 76: Mexico Transradial Access Industry Volume (K Unit) Forecast, by Application 2019 & 2032
- Table 77: Global Transradial Access Industry Revenue Million Forecast, by Product 2019 & 2032
- Table 78: Global Transradial Access Industry Volume K Unit Forecast, by Product 2019 & 2032
- Table 79: Global Transradial Access Industry Revenue Million Forecast, by Application 2019 & 2032
- Table 80: Global Transradial Access Industry Volume K Unit Forecast, by Application 2019 & 2032
- Table 81: Global Transradial Access Industry Revenue Million Forecast, by End User 2019 & 2032
- Table 82: Global Transradial Access Industry Volume K Unit Forecast, by End User 2019 & 2032
- Table 83: Global Transradial Access Industry Revenue Million Forecast, by Country 2019 & 2032
- Table 84: Global Transradial Access Industry Volume K Unit Forecast, by Country 2019 & 2032
- Table 85: Germany Transradial Access Industry Revenue (Million) Forecast, by Application 2019 & 2032
- Table 86: Germany Transradial Access Industry Volume (K Unit) Forecast, by Application 2019 & 2032
- Table 87: United Kingdom Transradial Access Industry Revenue (Million) Forecast, by Application 2019 & 2032
- Table 88: United Kingdom Transradial Access Industry Volume (K Unit) Forecast, by Application 2019 & 2032
- Table 89: France Transradial Access Industry Revenue (Million) Forecast, by Application 2019 & 2032
- Table 90: France Transradial Access Industry Volume (K Unit) Forecast, by Application 2019 & 2032
- Table 91: Italy Transradial Access Industry Revenue (Million) Forecast, by Application 2019 & 2032
- Table 92: Italy Transradial Access Industry Volume (K Unit) Forecast, by Application 2019 & 2032
- Table 93: Spain Transradial Access Industry Revenue (Million) Forecast, by Application 2019 & 2032
- Table 94: Spain Transradial Access Industry Volume (K Unit) Forecast, by Application 2019 & 2032
- Table 95: Rest of Europe Transradial Access Industry Revenue (Million) Forecast, by Application 2019 & 2032
- Table 96: Rest of Europe Transradial Access Industry Volume (K Unit) Forecast, by Application 2019 & 2032
- Table 97: Global Transradial Access Industry Revenue Million Forecast, by Product 2019 & 2032
- Table 98: Global Transradial Access Industry Volume K Unit Forecast, by Product 2019 & 2032
- Table 99: Global Transradial Access Industry Revenue Million Forecast, by Application 2019 & 2032
- Table 100: Global Transradial Access Industry Volume K Unit Forecast, by Application 2019 & 2032
- Table 101: Global Transradial Access Industry Revenue Million Forecast, by End User 2019 & 2032
- Table 102: Global Transradial Access Industry Volume K Unit Forecast, by End User 2019 & 2032
- Table 103: Global Transradial Access Industry Revenue Million Forecast, by Country 2019 & 2032
- Table 104: Global Transradial Access Industry Volume K Unit Forecast, by Country 2019 & 2032
- Table 105: China Transradial Access Industry Revenue (Million) Forecast, by Application 2019 & 2032
- Table 106: China Transradial Access Industry Volume (K Unit) Forecast, by Application 2019 & 2032
- Table 107: Japan Transradial Access Industry Revenue (Million) Forecast, by Application 2019 & 2032
- Table 108: Japan Transradial Access Industry Volume (K Unit) Forecast, by Application 2019 & 2032
- Table 109: India Transradial Access Industry Revenue (Million) Forecast, by Application 2019 & 2032
- Table 110: India Transradial Access Industry Volume (K Unit) Forecast, by Application 2019 & 2032
- Table 111: Australia Transradial Access Industry Revenue (Million) Forecast, by Application 2019 & 2032
- Table 112: Australia Transradial Access Industry Volume (K Unit) Forecast, by Application 2019 & 2032
- Table 113: South Korea Transradial Access Industry Revenue (Million) Forecast, by Application 2019 & 2032
- Table 114: South Korea Transradial Access Industry Volume (K Unit) Forecast, by Application 2019 & 2032
- Table 115: Rest of Asia Pacific Transradial Access Industry Revenue (Million) Forecast, by Application 2019 & 2032
- Table 116: Rest of Asia Pacific Transradial Access Industry Volume (K Unit) Forecast, by Application 2019 & 2032
- Table 117: Global Transradial Access Industry Revenue Million Forecast, by Product 2019 & 2032
- Table 118: Global Transradial Access Industry Volume K Unit Forecast, by Product 2019 & 2032
- Table 119: Global Transradial Access Industry Revenue Million Forecast, by Application 2019 & 2032
- Table 120: Global Transradial Access Industry Volume K Unit Forecast, by Application 2019 & 2032
- Table 121: Global Transradial Access Industry Revenue Million Forecast, by End User 2019 & 2032
- Table 122: Global Transradial Access Industry Volume K Unit Forecast, by End User 2019 & 2032
- Table 123: Global Transradial Access Industry Revenue Million Forecast, by Country 2019 & 2032
- Table 124: Global Transradial Access Industry Volume K Unit Forecast, by Country 2019 & 2032
- Table 125: GCC Transradial Access Industry Revenue (Million) Forecast, by Application 2019 & 2032
- Table 126: GCC Transradial Access Industry Volume (K Unit) Forecast, by Application 2019 & 2032
- Table 127: South Africa Transradial Access Industry Revenue (Million) Forecast, by Application 2019 & 2032
- Table 128: South Africa Transradial Access Industry Volume (K Unit) Forecast, by Application 2019 & 2032
- Table 129: Rest of Middle East and Africa Transradial Access Industry Revenue (Million) Forecast, by Application 2019 & 2032
- Table 130: Rest of Middle East and Africa Transradial Access Industry Volume (K Unit) Forecast, by Application 2019 & 2032
- Table 131: Global Transradial Access Industry Revenue Million Forecast, by Product 2019 & 2032
- Table 132: Global Transradial Access Industry Volume K Unit Forecast, by Product 2019 & 2032
- Table 133: Global Transradial Access Industry Revenue Million Forecast, by Application 2019 & 2032
- Table 134: Global Transradial Access Industry Volume K Unit Forecast, by Application 2019 & 2032
- Table 135: Global Transradial Access Industry Revenue Million Forecast, by End User 2019 & 2032
- Table 136: Global Transradial Access Industry Volume K Unit Forecast, by End User 2019 & 2032
- Table 137: Global Transradial Access Industry Revenue Million Forecast, by Country 2019 & 2032
- Table 138: Global Transradial Access Industry Volume K Unit Forecast, by Country 2019 & 2032
- Table 139: Brazil Transradial Access Industry Revenue (Million) Forecast, by Application 2019 & 2032
- Table 140: Brazil Transradial Access Industry Volume (K Unit) Forecast, by Application 2019 & 2032
- Table 141: Argentina Transradial Access Industry Revenue (Million) Forecast, by Application 2019 & 2032
- Table 142: Argentina Transradial Access Industry Volume (K Unit) Forecast, by Application 2019 & 2032
- Table 143: Rest of South America Transradial Access Industry Revenue (Million) Forecast, by Application 2019 & 2032
- Table 144: Rest of South America Transradial Access Industry Volume (K Unit) Forecast, by Application 2019 & 2032
Frequently Asked Questions
1. What is the projected Compound Annual Growth Rate (CAGR) of the Transradial Access Industry?
The projected CAGR is approximately 7.50%.
2. Which companies are prominent players in the Transradial Access Industry?
Key companies in the market include Smiths Medical, Becton Dickinson and Company, Nipro Medical Corporation, Merit Medical Systems, Terumo Corporation, Angiodynamics Inc, Edward Lifesciences Corporation, Ameco Medical, Oscor Inc, Boston Scientific Corporation, Teleflex Incorporated, Medtronic plc.
3. What are the main segments of the Transradial Access Industry?
The market segments include Product, Application, End User.
4. Can you provide details about the market size?
The market size is estimated to be USD XX Million as of 2022.
5. What are some drivers contributing to market growth?
Increasing Preference for Interventional Procedures Using Radial Artery Access; Growing Prevalence of Cardiovascular Diseases Due to Lifestyle Related Diseases; Growing Use of Radial Access Devices in Pediatric Patients.
6. What are the notable trends driving market growth?
Catheters Segment is Expected to Witness Growth Over the Forecast Period.
7. Are there any restraints impacting market growth?
High Costs Involved in the Placement and Maintenance of Vascular Access Devices; Lack of Trained Professionals.
8. Can you provide examples of recent developments in the market?
In February 2022, Launch Minnesota awarded nearly USD 440,000 in matching grants to 17 SBIR/STTR recipients. The award included Conway Medical, which developed a novel large-bore thrombectomy system appropriate for transradial access.
9. What pricing options are available for accessing the report?
Pricing options include single-user, multi-user, and enterprise licenses priced at USD 4750, USD 5250, and USD 8750 respectively.
10. Is the market size provided in terms of value or volume?
The market size is provided in terms of value, measured in Million and volume, measured in K Unit.
11. Are there any specific market keywords associated with the report?
Yes, the market keyword associated with the report is "Transradial Access Industry," which aids in identifying and referencing the specific market segment covered.
12. How do I determine which pricing option suits my needs best?
The pricing options vary based on user requirements and access needs. Individual users may opt for single-user licenses, while businesses requiring broader access may choose multi-user or enterprise licenses for cost-effective access to the report.
13. Are there any additional resources or data provided in the Transradial Access Industry report?
While the report offers comprehensive insights, it's advisable to review the specific contents or supplementary materials provided to ascertain if additional resources or data are available.
14. How can I stay updated on further developments or reports in the Transradial Access Industry?
To stay informed about further developments, trends, and reports in the Transradial Access Industry, consider subscribing to industry newsletters, following relevant companies and organizations, or regularly checking reputable industry news sources and publications.
Methodology
Step 1 - Identification of Relevant Samples Size from Population Database


Step 2 - Approaches for Defining Global Market Size (Value, Volume* & Price*)

Note*: In applicable scenarios
Step 3 - Data Sources
Primary Research
- Web Analytics
- Survey Reports
- Research Institute
- Latest Research Reports
- Opinion Leaders
Secondary Research
- Annual Reports
- White Paper
- Latest Press Release
- Industry Association
- Paid Database
- Investor Presentations

Step 4 - Data Triangulation
Involves using different sources of information in order to increase the validity of a study
These sources are likely to be stakeholders in a program - participants, other researchers, program staff, other community members, and so on.
Then we put all data in single framework & apply various statistical tools to find out the dynamic on the market.
During the analysis stage, feedback from the stakeholder groups would be compared to determine areas of agreement as well as areas of divergence
