

Key Insights
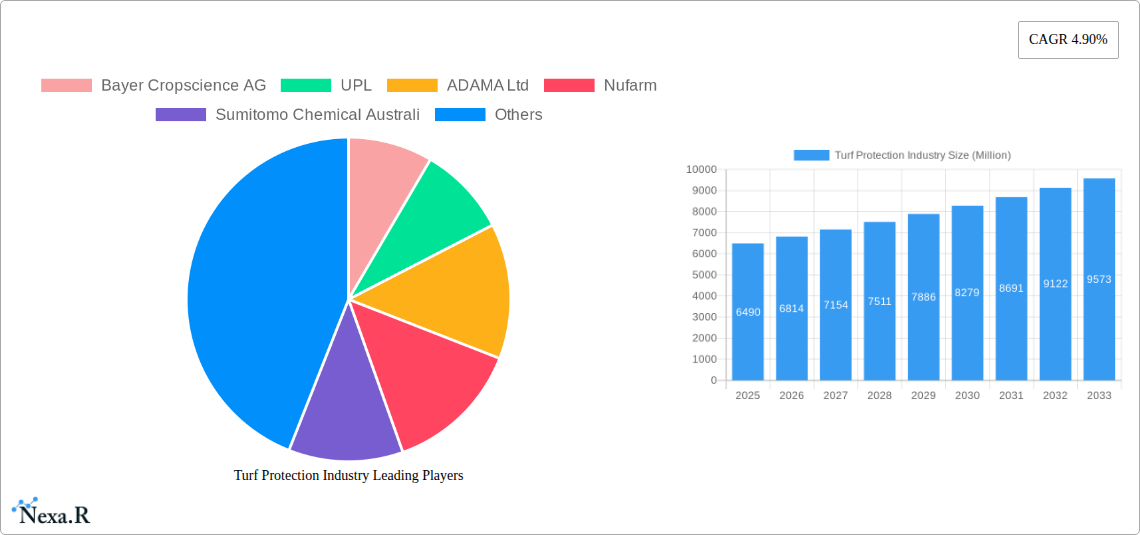
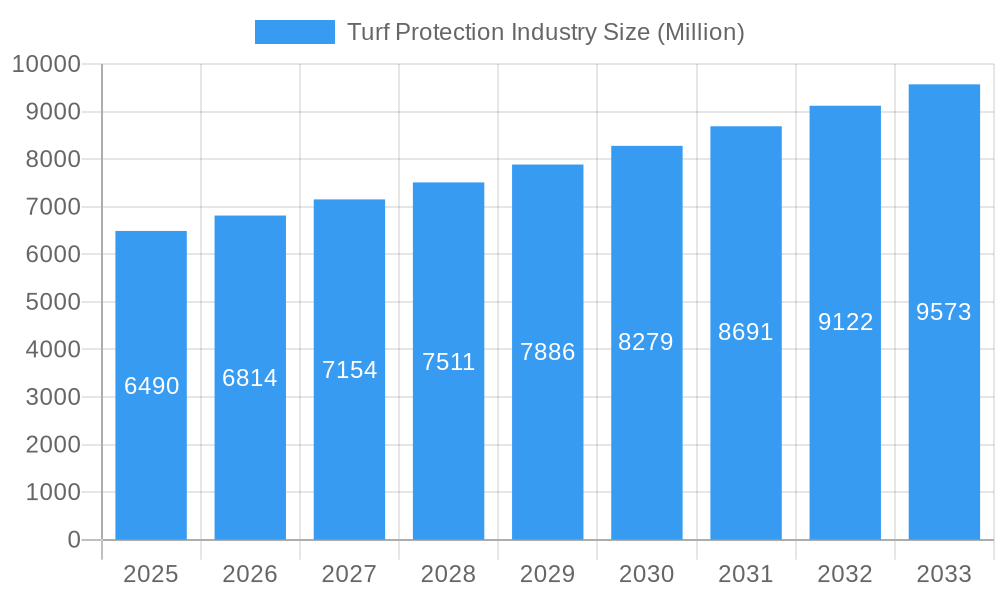
The global turf protection market, valued at $6.49 billion in 2025, is projected to experience robust growth, driven by increasing demand from landscaping, golf courses, sports fields, and sod farms. A compound annual growth rate (CAGR) of 4.90% from 2025 to 2033 indicates a significant expansion of this market, primarily fueled by rising consumer awareness regarding turf health and the need for effective pest and disease management. The growing popularity of professional landscaping services, coupled with the increasing number of golf courses and sports facilities worldwide, contributes substantially to this growth. Technological advancements in turf protection products, including the development of bio-pesticides and more sustainable solutions, further bolster market expansion. However, stringent regulatory frameworks surrounding pesticide use and the potential for environmental concerns act as restraining forces, necessitating the development of eco-friendly and effective alternatives. The market segmentation highlights the significant role of landscaping as a major application area, followed by golf courses, sports fields, and sod growers. Key players like Bayer Cropscience AG, UPL, and Syngenta AG are driving innovation and competition within the sector. Regional analysis indicates a strong presence across North America, Europe, and Asia Pacific, reflecting the high concentration of turf areas and consumer demand in these regions.
Turf Protection Industry Market Size (In Billion)
The projected growth trajectory suggests a substantial market expansion by 2033. Considering the 4.90% CAGR, a logical estimation points towards a significant increase in market value. Competitive landscape analysis reveals a highly concentrated market with established players constantly innovating to meet evolving needs. The emphasis on sustainable and environmentally friendly solutions reflects growing consumer and regulatory pressures. Future growth will likely be driven by the adoption of precision agriculture techniques and the development of innovative products that balance effectiveness with environmental responsibility. The expansion into emerging markets, particularly in Asia Pacific, presents significant growth opportunities for industry players. Further research into specific regional trends and consumer preferences will be crucial for businesses seeking to maximize their market share.
Turf Protection Industry Company Market Share
Turf Protection Industry Market Report: 2019-2033
This comprehensive report provides a detailed analysis of the Turf Protection Industry, encompassing market dynamics, growth trends, regional segmentation, product landscape, and key player strategies. The study period covers 2019-2033, with a base year of 2025 and a forecast period of 2025-2033. The report leverages extensive primary and secondary research to deliver actionable insights for industry professionals. Parent market is the Agriculture and allied industries while child market is turf care and management.
Turf Protection Industry Market Dynamics & Structure
The global Turf Protection Industry, valued at an estimated $XX million in 2024, is characterized by a moderately concentrated market structure. Leading players, including industry giants like Bayer Cropscience AG, UPL, ADAMA Ltd, Nufarm, Sumitomo Chemical Australia, AMVAC Chemical Corporation, Marrone Bio Innovations, Syngenta AG, and BASF SE, collectively command a significant market share. The precise distribution of this share is dynamic and varies considerably across specific application segments such as landscaping, golf courses, sports fields, and sod production. A primary driver of market growth is continuous technological innovation, with a particular emphasis on advancements in bio-pesticides and sophisticated, targeted delivery systems. However, the industry also faces headwinds from stringent regulatory frameworks, which influence product development and market access, as well as the ongoing availability of competitive product substitutes. Mergers and acquisitions (M&A) activity has remained a steady, albeit moderate, feature of the market, with approximately XX deals recorded between 2019 and 2024. These transactions have predominantly aimed at broadening product portfolios and extending geographical reach. Furthermore, evolving end-user demographics, increasingly prioritizing environmentally conscious choices, are significantly shaping product demand and driving the shift towards sustainable solutions.
- Market Concentration: The market is moderately concentrated, with the top 10 players estimated to hold approximately 70% of the market share as of 2024.
- Technological Innovation: Current innovation is sharply focused on the development of bio-pesticides, advanced targeted delivery mechanisms, and the creation of holistic, sustainable turf management solutions.
- Regulatory Landscape: The industry operates within a landscape of increasingly stringent regulations that significantly impact product registration processes, approved usage guidelines, and overall market access.
- Competitive Substitutes: A growing array of competitive alternatives, including natural pest control methods and comprehensive integrated pest management (IPM) strategies, are gaining traction.
- M&A Activity: Between 2019 and 2024, the market saw approximately XX merger and acquisition deals, with a strategic focus on portfolio expansion and diversification of market presence.
- End-User Demographics: There is a discernible and growing demand from end-users for turf protection products that are both effective and environmentally responsible.
Turf Protection Industry Growth Trends & Insights
The Turf Protection Industry experienced a CAGR of XX% during the historical period (2019-2024), reaching $XX million in 2024. This growth is attributed to factors including increasing urbanization, rising disposable incomes driving landscaping demand, and the expanding golf and sports industries. The adoption rate of new technologies like drone-based application and precision agriculture techniques is steadily increasing. Consumer behavior is shifting towards eco-friendly and sustainable solutions. The forecast period (2025-2033) projects continued growth, albeit at a slightly moderated CAGR of XX%, reaching an estimated market value of $XX million by 2033. This moderation reflects the impact of regulatory changes and increased competition. Market penetration within various segments shows significant room for growth, especially in emerging markets.
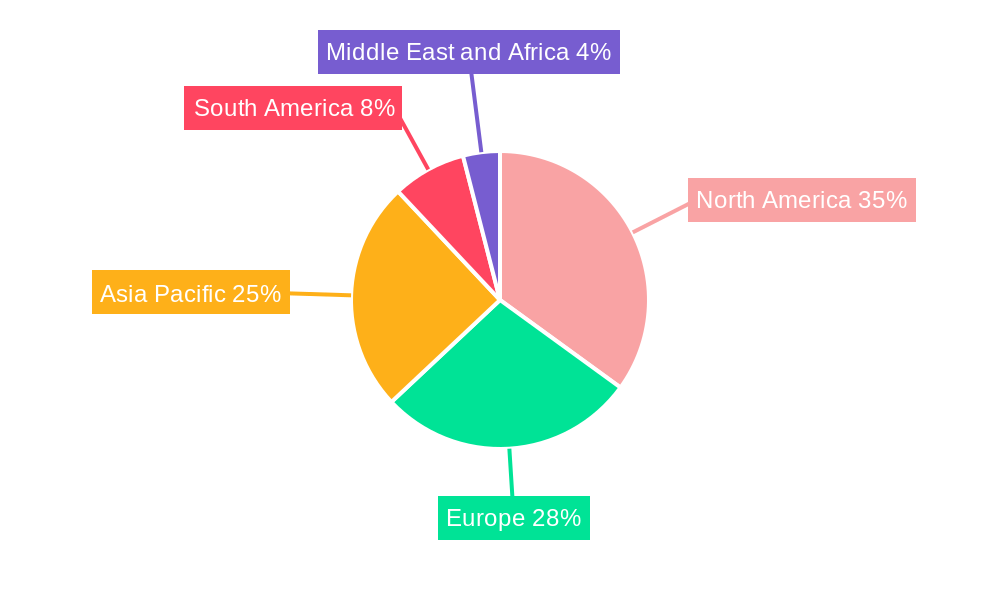
Dominant Regions, Countries, or Segments in Turf Protection Industry
North America currently holds the largest market share in the Turf Protection Industry, driven by a robust landscaping sector and a high concentration of golf courses and sports fields. Europe follows closely, while the Asia-Pacific region is witnessing significant growth potential due to increasing urbanization and rising disposable incomes. Within application segments, landscaping currently dominates, followed by Golf courses.
- North America: Strong market driven by high demand for landscaping and sports turf management.
- Europe: Mature market with high adoption of advanced technologies.
- Asia-Pacific: High-growth potential fueled by urbanization and increasing disposable income.
- Landscaping Segment: Largest segment driven by aesthetic preferences and property value enhancement.
- Golf Segment: Strong demand driven by the maintenance of high-quality playing surfaces.
- Sports Segment: Growing demand for durable and safe playing fields.
Turf Protection Industry Product Landscape
The comprehensive turf protection product landscape encompasses a diverse range of solutions, including traditional chemical pesticides, innovative biopesticides, essential fertilizers, and various growth regulators. Contemporary innovation within this space is heavily concentrated on developing advanced, targeted delivery systems designed to minimize environmental impact, reduce toxicity levels, enhance overall efficacy, and promote user-friendly application methods. The adoption of biopesticides is experiencing a significant surge, propelled by a discernible increase in consumer preference for sustainable and eco-friendly solutions. Leading companies are actively differentiating themselves by creating unique selling propositions through the development of tailored solutions that address the specific needs of various turf types and a wide spectrum of environmental conditions.
Key Drivers, Barriers & Challenges in Turf Protection Industry
Key Drivers:
- Rising disposable income leading to increased spending on landscaping and turf maintenance.
- Growing urbanization and expansion of sports infrastructure.
- Demand for aesthetically pleasing landscapes and high-quality sports fields.
- Technological advancements in product formulation and application methods.
Key Challenges:
- Stringent environmental regulations impacting product registration and usage. This leads to approximately XX million dollars of lost revenue annually.
- Increasing consumer preference for environmentally friendly solutions poses a challenge for chemical pesticide manufacturers.
- Intense competition from existing players and new entrants. Price wars impact profitability by approximately YY million dollars.
- Supply chain disruptions can impact product availability and pricing, especially raw materials like active ingredients.
Emerging Opportunities in Turf Protection Industry
- The escalating demand for organic and bio-based turf protection products presents a significant growth avenue.
- Strategic expansion into emerging markets with high potential for growth and adoption of advanced turf management practices.
- The development and implementation of precision agriculture technologies to enable highly targeted and efficient application of turf protection products.
- Increased adoption of smart irrigation systems and other innovative water-saving practices in turf management.
- Leveraging the power of data analytics to facilitate predictive maintenance and optimize resource utilization across turf operations.
Growth Accelerators in the Turf Protection Industry
Key catalysts for growth within the Turf Protection Industry are a combination of groundbreaking technological advancements in formulation science and application methodologies, alongside strategic partnerships designed to broaden distribution networks and deepen market penetration. Companies that prioritize sustainability and the development of environmentally benign products are poised to secure a significant competitive advantage. Furthermore, expansion into previously untapped markets, particularly within rapidly developing economies, offers substantial untapped growth potential and opportunities for market leadership.
Key Players Shaping the Turf Protection Industry Market
Notable Milestones in Turf Protection Industry Sector
- 2020: Marrone Bio Innovations successfully launched an innovative new biopesticide, highlighting advancements in sustainable pest control.
- 2021: Bayer Cropscience AG strategically acquired a smaller, specialized turf protection company, reinforcing its market position and expanding its product offerings.
- 2022: UPL introduced a novel drone-based application technology, signaling a leap forward in efficient and precise turf treatment.
- 2023: Several key regions implemented stricter regulations pertaining to pesticide usage, underscoring the industry's evolving regulatory environment.
- 2024: Multiple prominent players within the sector announced significant initiatives aimed at developing and promoting sustainable turf management solutions, reflecting a collective industry commitment to environmental stewardship.
In-Depth Turf Protection Industry Market Outlook
The Turf Protection Industry is poised for continued growth driven by technological innovation, increasing consumer awareness of environmental issues, and the expansion of high-value turf areas. Strategic partnerships, product diversification, and entry into new markets will be crucial for maintaining a competitive edge. The focus on sustainable and environmentally friendly solutions will shape the future of the industry, with biopesticides and other eco-friendly alternatives gaining significant market share. Opportunities exist for companies that can offer integrated turf management solutions that combine innovative products with data-driven insights.
Turf Protection Industry Segmentation
-
1. Application
- 1.1. Landscaping
- 1.2. Golf
- 1.3. Sports
- 1.4. Sod Growers
-
2. Application
- 2.1. Landscaping
- 2.2. Golf
- 2.3. Sports
- 2.4. Sod Growers
Turf Protection Industry Segmentation By Geography
-
1. North America
- 1.1. United States
- 1.2. Canada
- 1.3. Mexico
- 1.4. Rest of North America
-
2. Europe
- 2.1. Germany
- 2.2. United Kingdom
- 2.3. France
- 2.4. Russia
- 2.5. Spain
- 2.6. Italy
- 2.7. Rest of Europe
-
3. Asia Pacific
- 3.1. China
- 3.2. Japan
- 3.3. India
- 3.4. Australia
- 3.5. Rest of Asia Pacific
-
4. South America
- 4.1. Brazil
- 4.2. Argentina
- 4.3. Rest of South America
-
5. Middle East and Africa
- 5.1. South Africa
- 5.2. Rest of Middle East and Africa
Turf Protection Industry Regional Market Share
Geographic Coverage of Turf Protection Industry
Turf Protection Industry REPORT HIGHLIGHTS
| Aspects | Details |
|---|---|
| Study Period | 2020-2034 |
| Base Year | 2025 |
| Estimated Year | 2026 |
| Forecast Period | 2026-2034 |
| Historical Period | 2020-2025 |
| Growth Rate | CAGR of 4.90% from 2020-2034 |
| Segmentation |
|
Table of Contents
- 1. Introduction
- 1.1. Research Scope
- 1.2. Market Segmentation
- 1.3. Research Objective
- 1.4. Definitions and Assumptions
- 2. Executive Summary
- 2.1. Market Snapshot
- 3. Market Dynamics
- 3.1. Market Drivers
- 3.2. Market Restrains
- 3.3. Market Trends
- 3.4. Market Opportunities
- 4. Market Factor Analysis
- 4.1. Porters Five Forces
- 4.1.1. Bargaining Power of Suppliers
- 4.1.2. Bargaining Power of Buyers
- 4.1.3. Threat of New Entrants
- 4.1.4. Threat of Substitutes
- 4.1.5. Competitive Rivalry
- 4.2. PESTEL analysis
- 4.3. BCG Analysis
- 4.3.1. Stars (High Growth, High Market Share)
- 4.3.2. Cash Cows (Low Growth, High Market Share)
- 4.3.3. Question Mark (High Growth, Low Market Share)
- 4.3.4. Dogs (Low Growth, Low Market Share)
- 4.4. Ansoff Matrix Analysis
- 4.5. Supply Chain Analysis
- 4.6. Regulatory Landscape
- 4.7. Current Market Potential and Opportunity Assessment (TAM–SAM–SOM Framework)
- 4.8. NRP Analyst Note
- 4.1. Porters Five Forces
- 5. Market Analysis, Insights and Forecast 2021-2033
- 5.1. Market Analysis, Insights and Forecast - by Application
- 5.1.1. Landscaping
- 5.1.2. Golf
- 5.1.3. Sports
- 5.1.4. Sod Growers
- 5.2. Market Analysis, Insights and Forecast - by Application
- 5.2.1. Landscaping
- 5.2.2. Golf
- 5.2.3. Sports
- 5.2.4. Sod Growers
- 5.3. Market Analysis, Insights and Forecast - by Region
- 5.3.1. North America
- 5.3.2. Europe
- 5.3.3. Asia Pacific
- 5.3.4. South America
- 5.3.5. Middle East and Africa
- 5.1. Market Analysis, Insights and Forecast - by Application
- 6. Global Turf Protection Industry Analysis, Insights and Forecast, 2021-2033
- 6.1. Market Analysis, Insights and Forecast - by Application
- 6.1.1. Landscaping
- 6.1.2. Golf
- 6.1.3. Sports
- 6.1.4. Sod Growers
- 6.2. Market Analysis, Insights and Forecast - by Application
- 6.2.1. Landscaping
- 6.2.2. Golf
- 6.2.3. Sports
- 6.2.4. Sod Growers
- 6.1. Market Analysis, Insights and Forecast - by Application
- 7. North America Turf Protection Industry Analysis, Insights and Forecast, 2020-2032
- 7.1. Market Analysis, Insights and Forecast - by Application
- 7.1.1. Landscaping
- 7.1.2. Golf
- 7.1.3. Sports
- 7.1.4. Sod Growers
- 7.2. Market Analysis, Insights and Forecast - by Application
- 7.2.1. Landscaping
- 7.2.2. Golf
- 7.2.3. Sports
- 7.2.4. Sod Growers
- 7.1. Market Analysis, Insights and Forecast - by Application
- 8. Europe Turf Protection Industry Analysis, Insights and Forecast, 2020-2032
- 8.1. Market Analysis, Insights and Forecast - by Application
- 8.1.1. Landscaping
- 8.1.2. Golf
- 8.1.3. Sports
- 8.1.4. Sod Growers
- 8.2. Market Analysis, Insights and Forecast - by Application
- 8.2.1. Landscaping
- 8.2.2. Golf
- 8.2.3. Sports
- 8.2.4. Sod Growers
- 8.1. Market Analysis, Insights and Forecast - by Application
- 9. Asia Pacific Turf Protection Industry Analysis, Insights and Forecast, 2020-2032
- 9.1. Market Analysis, Insights and Forecast - by Application
- 9.1.1. Landscaping
- 9.1.2. Golf
- 9.1.3. Sports
- 9.1.4. Sod Growers
- 9.2. Market Analysis, Insights and Forecast - by Application
- 9.2.1. Landscaping
- 9.2.2. Golf
- 9.2.3. Sports
- 9.2.4. Sod Growers
- 9.1. Market Analysis, Insights and Forecast - by Application
- 10. South America Turf Protection Industry Analysis, Insights and Forecast, 2020-2032
- 10.1. Market Analysis, Insights and Forecast - by Application
- 10.1.1. Landscaping
- 10.1.2. Golf
- 10.1.3. Sports
- 10.1.4. Sod Growers
- 10.2. Market Analysis, Insights and Forecast - by Application
- 10.2.1. Landscaping
- 10.2.2. Golf
- 10.2.3. Sports
- 10.2.4. Sod Growers
- 10.1. Market Analysis, Insights and Forecast - by Application
- 11. Middle East and Africa Turf Protection Industry Analysis, Insights and Forecast, 2020-2032
- 11.1. Market Analysis, Insights and Forecast - by Application
- 11.1.1. Landscaping
- 11.1.2. Golf
- 11.1.3. Sports
- 11.1.4. Sod Growers
- 11.2. Market Analysis, Insights and Forecast - by Application
- 11.2.1. Landscaping
- 11.2.2. Golf
- 11.2.3. Sports
- 11.2.4. Sod Growers
- 11.1. Market Analysis, Insights and Forecast - by Application
- 12. Competitive Analysis
- 12.1. Company Profiles
- 12.1.1 Bayer Cropscience AG
- 12.1.1.1. Company Overview
- 12.1.1.2. Products
- 12.1.1.3. Company Financials
- 12.1.1.4. SWOT Analysis
- 12.1.2 UPL
- 12.1.2.1. Company Overview
- 12.1.2.2. Products
- 12.1.2.3. Company Financials
- 12.1.2.4. SWOT Analysis
- 12.1.3 ADAMA Ltd
- 12.1.3.1. Company Overview
- 12.1.3.2. Products
- 12.1.3.3. Company Financials
- 12.1.3.4. SWOT Analysis
- 12.1.4 Nufarm
- 12.1.4.1. Company Overview
- 12.1.4.2. Products
- 12.1.4.3. Company Financials
- 12.1.4.4. SWOT Analysis
- 12.1.5 Sumitomo Chemical Australi
- 12.1.5.1. Company Overview
- 12.1.5.2. Products
- 12.1.5.3. Company Financials
- 12.1.5.4. SWOT Analysis
- 12.1.6 AMVAC Chemical Corporation
- 12.1.6.1. Company Overview
- 12.1.6.2. Products
- 12.1.6.3. Company Financials
- 12.1.6.4. SWOT Analysis
- 12.1.7 Marrone Bio Innovations
- 12.1.7.1. Company Overview
- 12.1.7.2. Products
- 12.1.7.3. Company Financials
- 12.1.7.4. SWOT Analysis
- 12.1.8 Syngenta AG
- 12.1.8.1. Company Overview
- 12.1.8.2. Products
- 12.1.8.3. Company Financials
- 12.1.8.4. SWOT Analysis
- 12.1.9 BASF SE
- 12.1.9.1. Company Overview
- 12.1.9.2. Products
- 12.1.9.3. Company Financials
- 12.1.9.4. SWOT Analysis
- 12.1.1 Bayer Cropscience AG
- 12.2. Market Entropy
- 12.2.1 Company's Key Areas Served
- 12.2.2 Recent Developments
- 12.3. Company Market Share Analysis 2025
- 12.3.1 Top 5 Companies Market Share Analysis
- 12.3.2 Top 3 Companies Market Share Analysis
- 12.4. List of Potential Customers
- 13. Research Methodology
List of Figures
- Figure 1: Global Turf Protection Industry Revenue Breakdown (Million, %) by Region 2025 & 2033
- Figure 2: North America Turf Protection Industry Revenue (Million), by Application 2025 & 2033
- Figure 3: North America Turf Protection Industry Revenue Share (%), by Application 2025 & 2033
- Figure 4: North America Turf Protection Industry Revenue (Million), by Application 2025 & 2033
- Figure 5: North America Turf Protection Industry Revenue Share (%), by Application 2025 & 2033
- Figure 6: North America Turf Protection Industry Revenue (Million), by Country 2025 & 2033
- Figure 7: North America Turf Protection Industry Revenue Share (%), by Country 2025 & 2033
- Figure 8: Europe Turf Protection Industry Revenue (Million), by Application 2025 & 2033
- Figure 9: Europe Turf Protection Industry Revenue Share (%), by Application 2025 & 2033
- Figure 10: Europe Turf Protection Industry Revenue (Million), by Application 2025 & 2033
- Figure 11: Europe Turf Protection Industry Revenue Share (%), by Application 2025 & 2033
- Figure 12: Europe Turf Protection Industry Revenue (Million), by Country 2025 & 2033
- Figure 13: Europe Turf Protection Industry Revenue Share (%), by Country 2025 & 2033
- Figure 14: Asia Pacific Turf Protection Industry Revenue (Million), by Application 2025 & 2033
- Figure 15: Asia Pacific Turf Protection Industry Revenue Share (%), by Application 2025 & 2033
- Figure 16: Asia Pacific Turf Protection Industry Revenue (Million), by Application 2025 & 2033
- Figure 17: Asia Pacific Turf Protection Industry Revenue Share (%), by Application 2025 & 2033
- Figure 18: Asia Pacific Turf Protection Industry Revenue (Million), by Country 2025 & 2033
- Figure 19: Asia Pacific Turf Protection Industry Revenue Share (%), by Country 2025 & 2033
- Figure 20: South America Turf Protection Industry Revenue (Million), by Application 2025 & 2033
- Figure 21: South America Turf Protection Industry Revenue Share (%), by Application 2025 & 2033
- Figure 22: South America Turf Protection Industry Revenue (Million), by Application 2025 & 2033
- Figure 23: South America Turf Protection Industry Revenue Share (%), by Application 2025 & 2033
- Figure 24: South America Turf Protection Industry Revenue (Million), by Country 2025 & 2033
- Figure 25: South America Turf Protection Industry Revenue Share (%), by Country 2025 & 2033
- Figure 26: Middle East and Africa Turf Protection Industry Revenue (Million), by Application 2025 & 2033
- Figure 27: Middle East and Africa Turf Protection Industry Revenue Share (%), by Application 2025 & 2033
- Figure 28: Middle East and Africa Turf Protection Industry Revenue (Million), by Application 2025 & 2033
- Figure 29: Middle East and Africa Turf Protection Industry Revenue Share (%), by Application 2025 & 2033
- Figure 30: Middle East and Africa Turf Protection Industry Revenue (Million), by Country 2025 & 2033
- Figure 31: Middle East and Africa Turf Protection Industry Revenue Share (%), by Country 2025 & 2033
List of Tables
- Table 1: Global Turf Protection Industry Revenue Million Forecast, by Application 2020 & 2033
- Table 2: Global Turf Protection Industry Revenue Million Forecast, by Application 2020 & 2033
- Table 3: Global Turf Protection Industry Revenue Million Forecast, by Region 2020 & 2033
- Table 4: Global Turf Protection Industry Revenue Million Forecast, by Application 2020 & 2033
- Table 5: Global Turf Protection Industry Revenue Million Forecast, by Application 2020 & 2033
- Table 6: Global Turf Protection Industry Revenue Million Forecast, by Country 2020 & 2033
- Table 7: United States Turf Protection Industry Revenue (Million) Forecast, by Application 2020 & 2033
- Table 8: Canada Turf Protection Industry Revenue (Million) Forecast, by Application 2020 & 2033
- Table 9: Mexico Turf Protection Industry Revenue (Million) Forecast, by Application 2020 & 2033
- Table 10: Rest of North America Turf Protection Industry Revenue (Million) Forecast, by Application 2020 & 2033
- Table 11: Global Turf Protection Industry Revenue Million Forecast, by Application 2020 & 2033
- Table 12: Global Turf Protection Industry Revenue Million Forecast, by Application 2020 & 2033
- Table 13: Global Turf Protection Industry Revenue Million Forecast, by Country 2020 & 2033
- Table 14: Germany Turf Protection Industry Revenue (Million) Forecast, by Application 2020 & 2033
- Table 15: United Kingdom Turf Protection Industry Revenue (Million) Forecast, by Application 2020 & 2033
- Table 16: France Turf Protection Industry Revenue (Million) Forecast, by Application 2020 & 2033
- Table 17: Russia Turf Protection Industry Revenue (Million) Forecast, by Application 2020 & 2033
- Table 18: Spain Turf Protection Industry Revenue (Million) Forecast, by Application 2020 & 2033
- Table 19: Italy Turf Protection Industry Revenue (Million) Forecast, by Application 2020 & 2033
- Table 20: Rest of Europe Turf Protection Industry Revenue (Million) Forecast, by Application 2020 & 2033
- Table 21: Global Turf Protection Industry Revenue Million Forecast, by Application 2020 & 2033
- Table 22: Global Turf Protection Industry Revenue Million Forecast, by Application 2020 & 2033
- Table 23: Global Turf Protection Industry Revenue Million Forecast, by Country 2020 & 2033
- Table 24: China Turf Protection Industry Revenue (Million) Forecast, by Application 2020 & 2033
- Table 25: Japan Turf Protection Industry Revenue (Million) Forecast, by Application 2020 & 2033
- Table 26: India Turf Protection Industry Revenue (Million) Forecast, by Application 2020 & 2033
- Table 27: Australia Turf Protection Industry Revenue (Million) Forecast, by Application 2020 & 2033
- Table 28: Rest of Asia Pacific Turf Protection Industry Revenue (Million) Forecast, by Application 2020 & 2033
- Table 29: Global Turf Protection Industry Revenue Million Forecast, by Application 2020 & 2033
- Table 30: Global Turf Protection Industry Revenue Million Forecast, by Application 2020 & 2033
- Table 31: Global Turf Protection Industry Revenue Million Forecast, by Country 2020 & 2033
- Table 32: Brazil Turf Protection Industry Revenue (Million) Forecast, by Application 2020 & 2033
- Table 33: Argentina Turf Protection Industry Revenue (Million) Forecast, by Application 2020 & 2033
- Table 34: Rest of South America Turf Protection Industry Revenue (Million) Forecast, by Application 2020 & 2033
- Table 35: Global Turf Protection Industry Revenue Million Forecast, by Application 2020 & 2033
- Table 36: Global Turf Protection Industry Revenue Million Forecast, by Application 2020 & 2033
- Table 37: Global Turf Protection Industry Revenue Million Forecast, by Country 2020 & 2033
- Table 38: South Africa Turf Protection Industry Revenue (Million) Forecast, by Application 2020 & 2033
- Table 39: Rest of Middle East and Africa Turf Protection Industry Revenue (Million) Forecast, by Application 2020 & 2033
Frequently Asked Questions
1. What is the projected Compound Annual Growth Rate (CAGR) of the Turf Protection Industry?
The projected CAGR is approximately 4.90%.
2. Which companies are prominent players in the Turf Protection Industry?
Key companies in the market include Bayer Cropscience AG, UPL, ADAMA Ltd, Nufarm, Sumitomo Chemical Australi, AMVAC Chemical Corporation, Marrone Bio Innovations, Syngenta AG, BASF SE.
3. What are the main segments of the Turf Protection Industry?
The market segments include Application, Application.
4. Can you provide details about the market size?
The market size is estimated to be USD 6.49 Million as of 2022.
5. What are some drivers contributing to market growth?
Seed Treatment As A Solution To Enhance Yield; Growing Awareness For Seed Treatment Among The Farmers; Rising Trend Of Organic Farming.
6. What are the notable trends driving market growth?
Expansion of Sports Activities.
7. Are there any restraints impacting market growth?
Limitations Across Farm-Level Seed Treatment; Rising Environmental Concerns.
8. Can you provide examples of recent developments in the market?
N/A
9. What pricing options are available for accessing the report?
Pricing options include single-user, multi-user, and enterprise licenses priced at USD 4750, USD 5250, and USD 8750 respectively.
10. Is the market size provided in terms of value or volume?
The market size is provided in terms of value, measured in Million.
11. Are there any specific market keywords associated with the report?
Yes, the market keyword associated with the report is "Turf Protection Industry," which aids in identifying and referencing the specific market segment covered.
12. How do I determine which pricing option suits my needs best?
The pricing options vary based on user requirements and access needs. Individual users may opt for single-user licenses, while businesses requiring broader access may choose multi-user or enterprise licenses for cost-effective access to the report.
13. Are there any additional resources or data provided in the Turf Protection Industry report?
While the report offers comprehensive insights, it's advisable to review the specific contents or supplementary materials provided to ascertain if additional resources or data are available.
14. How can I stay updated on further developments or reports in the Turf Protection Industry?
To stay informed about further developments, trends, and reports in the Turf Protection Industry, consider subscribing to industry newsletters, following relevant companies and organizations, or regularly checking reputable industry news sources and publications.
Methodology
Step 1 - Identification of Relevant Samples Size from Population Database


Step 2 - Approaches for Defining Global Market Size (Value, Volume* & Price*)

Note*: In applicable scenarios
Step 3 - Data Sources
Primary Research
- Web Analytics
- Survey Reports
- Research Institute
- Latest Research Reports
- Opinion Leaders
Secondary Research
- Annual Reports
- White Paper
- Latest Press Release
- Industry Association
- Paid Database
- Investor Presentations

Step 4 - Data Triangulation
Involves using different sources of information in order to increase the validity of a study
These sources are likely to be stakeholders in a program - participants, other researchers, program staff, other community members, and so on.
Then we put all data in single framework & apply various statistical tools to find out the dynamic on the market.
During the analysis stage, feedback from the stakeholder groups would be compared to determine areas of agreement as well as areas of divergence