

Key Insights
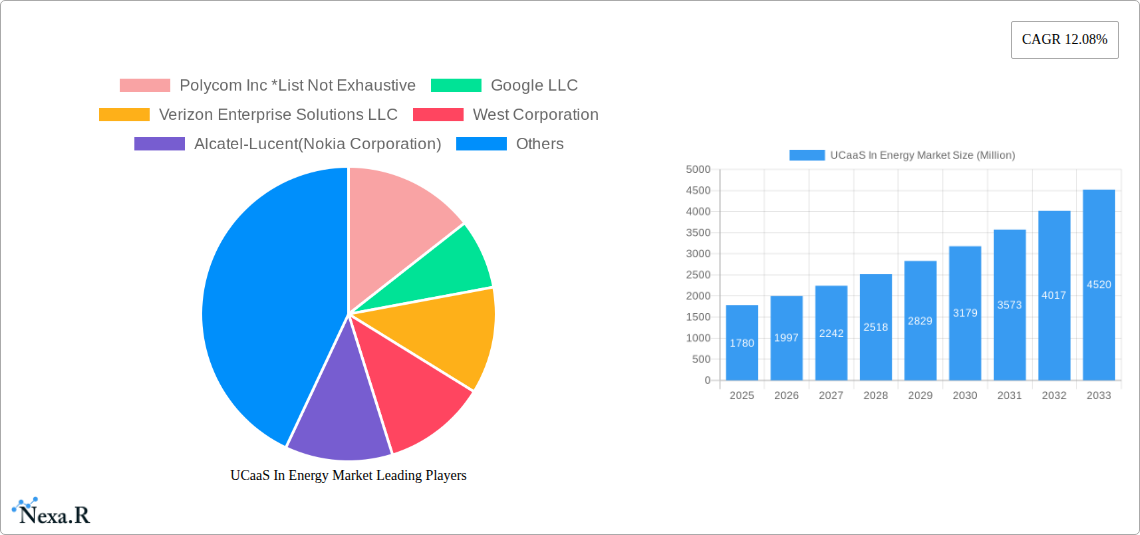
The UCaaS (Unified Communications as a Service) market within the energy sector is experiencing robust growth, projected to reach a substantial size. The market's 12.08% CAGR from 2019-2033 indicates significant potential, driven by several factors. Increased adoption of cloud-based solutions is a primary driver, offering energy companies improved operational efficiency, enhanced collaboration among geographically dispersed teams, and cost savings compared to traditional on-premise systems. The energy industry's inherent need for real-time communication and reliable connectivity, especially in remote operations and field services, further fuels this demand. Furthermore, the integration of UCaaS with other technologies like IoT (Internet of Things) and AI (Artificial Intelligence) is creating new opportunities for optimization and innovation within the sector. Security concerns and the need for robust data protection remain a key restraint, necessitating solutions with stringent security protocols. The market is segmented by component (telephony, collaboration tools, unified messaging, conferencing, other services), deployment model (private, public, hybrid), and enterprise size (large, small & medium). Large enterprises are currently the largest segment, but the adoption of UCaaS by SMEs is expected to grow significantly, contributing to overall market expansion. Key players, including Polycom, Google, Verizon, Cisco, Microsoft, and others, are actively competing in this dynamic market, driving innovation and improving service offerings.
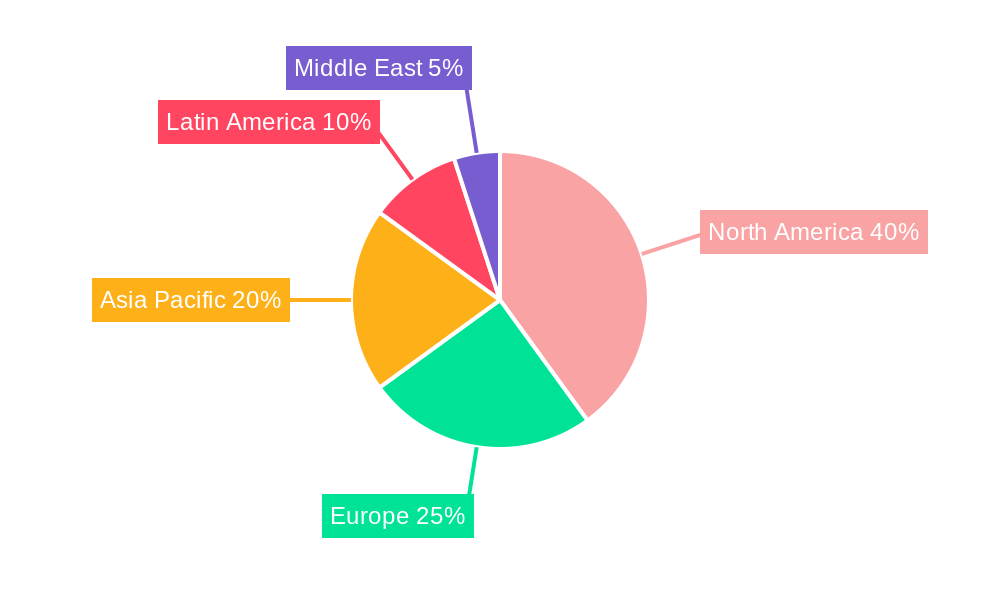
The North American market currently holds a significant share, due to early adoption of cloud technologies and the presence of major technology providers. However, the Asia-Pacific region is poised for substantial growth, driven by increasing digitalization and infrastructure development. European and Latin American markets are also showing promising growth, fueled by government initiatives promoting digital transformation. The forecast period (2025-2033) anticipates continued expansion, with the market driven by technological advancements, increasing affordability of cloud services, and the ongoing demand for improved communication and collaboration within the energy industry. The market's evolution will depend on the continuous innovation of secure and scalable UCaaS solutions tailored to the specific communication needs of the energy sector, addressing concerns around data security and regulatory compliance.
UCaaS in Energy Market: A Comprehensive Report (2019-2033)
This comprehensive report provides a detailed analysis of the UCaaS (Unified Communications as a Service) market within the energy sector, offering invaluable insights for industry professionals, investors, and strategic decision-makers. With a study period spanning 2019-2033, a base year of 2025, and a forecast period from 2025-2033, this report leverages extensive data analysis and expert insights to deliver a holistic understanding of this dynamic market. The report's value is estimated at xx Million units.
UCaaS In Energy Market Market Dynamics & Structure
The UCaaS market in the energy sector is characterized by moderate concentration, with several key players vying for market share. Technological innovation, particularly in areas like AI-powered communication and enhanced security, is a significant driver. Regulatory frameworks, including data privacy regulations and cybersecurity standards, play a crucial role in shaping market dynamics. Competitive product substitutes, such as traditional on-premise PBX systems, continue to exert pressure. The end-user demographic encompasses large and small/medium energy enterprises, each with unique needs and adoption rates. M&A activity in the broader UCaaS space indicates a consolidation trend, with larger players acquiring smaller companies to expand their service offerings and geographic reach.
- Market Concentration: The market is moderately concentrated, with the top 5 players holding approximately xx% of the market share in 2024.
- Technological Innovation: AI-powered features, enhanced security protocols, and improved interoperability are key drivers of innovation.
- Regulatory Landscape: Compliance with data privacy regulations (e.g., GDPR, CCPA) and cybersecurity standards significantly impacts market growth.
- Competitive Substitutes: Traditional PBX systems and legacy communication solutions pose a competitive threat.
- M&A Activity: xx M&A deals were recorded in the global UCaaS market between 2019 and 2024, indicating a trend of consolidation.
- End-User Demographics: The market caters to both large energy enterprises (e.g., oil & gas majors, power utilities) and smaller players (e.g., renewable energy providers).
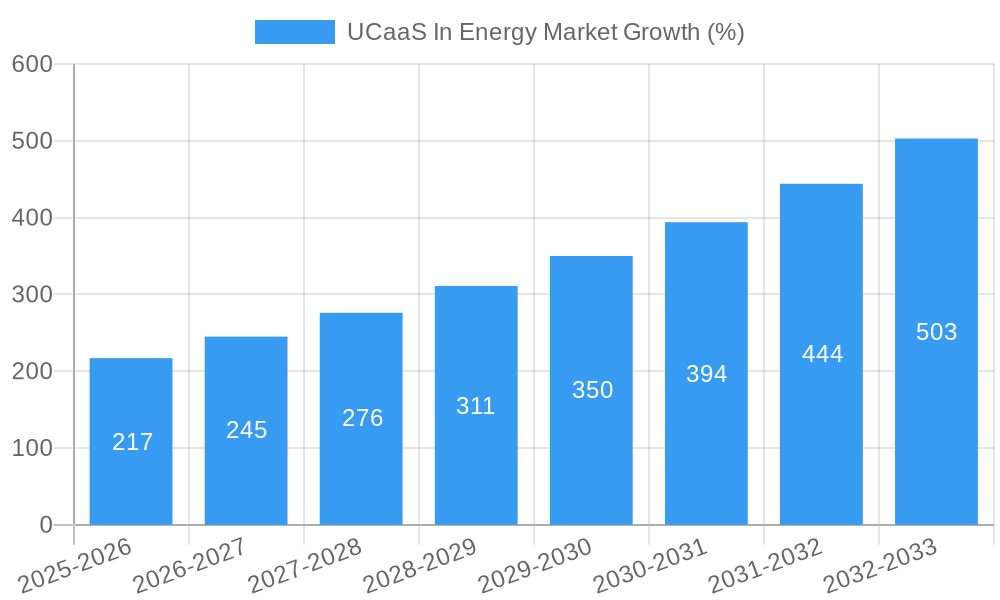
UCaaS In Energy Market Growth Trends & Insights
The UCaaS market within the energy sector has witnessed significant growth over the historical period (2019-2024), driven by increasing demand for flexible, cost-effective communication solutions. The market size, estimated at xx million units in 2024, is projected to experience a Compound Annual Growth Rate (CAGR) of xx% during the forecast period (2025-2033), reaching xx million units by 2033. This growth is fueled by factors including the rising adoption of cloud-based technologies, the increasing need for remote collaboration, and the growing emphasis on improving operational efficiency and worker productivity. Technological disruptions, such as the integration of 5G networks and the development of advanced collaboration tools, are further accelerating market expansion. Consumer behavior shifts, with a preference for agile and scalable communication platforms, are driving migration from traditional systems to UCaaS.
Dominant Regions, Countries, or Segments in UCaaS In Energy Market
North America currently dominates the UCaaS market in the energy sector, holding the largest market share in 2024 due to high technology adoption rates and the presence of major energy companies. However, the Asia-Pacific region is anticipated to witness the fastest growth during the forecast period driven by increasing digital transformation initiatives and infrastructural investments.
- By Component: Collaboration tools are currently the largest segment, followed by conferencing and unified messaging. The telephony segment is also experiencing growth due to its integration with other UCaaS services.
- By Deployment Model: The cloud-based (Public) deployment model holds the largest market share, owing to its scalability and cost-effectiveness. Hybrid deployment models are gaining traction among large enterprises seeking a balance between on-premise and cloud-based solutions.
- By Enterprise Size: Large enterprises dominate the market, investing significantly in advanced UCaaS solutions to enhance operational efficiency and collaboration. However, the SME segment is showing promising growth, driven by the increasing affordability and accessibility of UCaaS offerings.
- Key Drivers: Government initiatives promoting digital transformation in the energy sector, increasing investments in smart grid technologies, and the growing need for remote workforce management are key drivers.
UCaaS In Energy Market Product Landscape
UCaaS solutions in the energy sector are evolving rapidly, incorporating AI-powered features for improved call routing, intelligent chatbots for customer support, and enhanced security protocols for protecting sensitive data. Products are designed to streamline communication across geographically dispersed teams, improve operational efficiency, and facilitate collaboration between different departments and stakeholders. Key selling propositions include scalability, flexibility, cost-effectiveness, and enhanced security. The market witnesses continuous technological advancements, pushing integration with IoT devices, real-time data analytics, and improved interoperability with other enterprise software.
Key Drivers, Barriers & Challenges in UCaaS In Energy Market
Key Drivers: The primary drivers include the growing need for enhanced collaboration, cost optimization, improved operational efficiency, and increased remote workforce adoption across the energy sector. Government initiatives promoting digital transformation are also accelerating market growth.
Key Challenges: Significant challenges include concerns over data security and privacy, integration complexities with legacy systems, potential disruptions to existing communication infrastructure, and the need for robust cybersecurity measures. High initial investment costs can also pose a barrier for smaller energy companies. Supply chain disruptions, particularly concerning the availability of hardware components, can impact deployment timelines and overall market growth. The exact quantifiable impact of these challenges varies based on specific market segments and geographical locations.
Emerging Opportunities in UCaaS In Energy Market
Emerging opportunities lie in the integration of UCaaS with IoT devices for real-time monitoring and control of energy infrastructure, the development of specialized UCaaS solutions for specific energy sub-sectors (e.g., renewable energy, oil & gas), and the expansion of UCaaS services into emerging markets with growing energy sectors.
Growth Accelerators in the UCaaS In Energy Market Industry
Strategic partnerships between UCaaS providers and energy companies are accelerating market growth. Technological innovations such as AI-powered features and improved security measures are driving adoption. Market expansion strategies, particularly focusing on underserved regions and smaller energy companies, are creating new growth opportunities. The increasing demand for remote collaboration and improved operational efficiency is further fueling long-term expansion.
Key Players Shaping the UCaaS In Energy Market Market
- Polycom Inc
- Google LLC
- Verizon Enterprise Solutions LLC
- West Corporation
- Alcatel-Lucent (Nokia Corporation)
- Cisco Systems Inc
- Microsoft Corporation
- International Business Machines Corporation
- Avaya Inc
- BT Group plc
Notable Milestones in UCaaS In Energy Market Sector
- May 2023: Access4 launches a new SMS service, boosting partner network growth and customer retention.
- August 2022: Avaya introduces Avaya Spaces, a comprehensive video collaboration app with advanced features.
In-Depth UCaaS In Energy Market Market Outlook
The UCaaS market in the energy sector is poised for robust growth, driven by technological advancements, strategic partnerships, and the expanding adoption of cloud-based solutions. The market's future potential is significant, with continued growth expected across all major segments. Strategic opportunities exist for companies to invest in innovative solutions, expand into new geographic markets, and cater to the evolving needs of energy companies seeking to optimize their communication and collaboration strategies. The market's long-term trajectory is positive, presenting substantial opportunities for both established players and new entrants.
UCaaS In Energy Market Segmentation
-
1. Component
- 1.1. Telephony
- 1.2. Collaboration
- 1.3. Unified Messaging
- 1.4. Conferencing
- 1.5. Other Services
-
2. Deployment Model
- 2.1. Private
- 2.2. Public
- 2.3. Hybrid Model
-
3. Enterprise Size
- 3.1. Large Enterprise
- 3.2. Small & Medium Enterprise
UCaaS In Energy Market Segmentation By Geography
- 1. North America
- 2. Europe
- 3. Asia
- 4. Latin America
- 5. Middle East and Africa
UCaaS In Energy Market REPORT HIGHLIGHTS
| Aspects | Details |
|---|---|
| Study Period | 2019-2033 |
| Base Year | 2024 |
| Estimated Year | 2025 |
| Forecast Period | 2025-2033 |
| Historical Period | 2019-2024 |
| Growth Rate | CAGR of 12.08% from 2019-2033 |
| Segmentation |
|
Table of Contents
- 1. Introduction
- 1.1. Research Scope
- 1.2. Market Segmentation
- 1.3. Research Methodology
- 1.4. Definitions and Assumptions
- 2. Executive Summary
- 2.1. Introduction
- 3. Market Dynamics
- 3.1. Introduction
- 3.2. Market Drivers
- 3.2.1. Proliferation of Cloud Based Ecosystem will Act as a Driver; Improvement of Communication Technology
- 3.3. Market Restrains
- 3.3.1. Data Security Concerns will Remain a Challenge to the Growth of the Market
- 3.4. Market Trends
- 3.4.1. Proliferation of Cloud Based Ecosystem to Drive the Market Growth
- 4. Market Factor Analysis
- 4.1. Porters Five Forces
- 4.2. Supply/Value Chain
- 4.3. PESTEL analysis
- 4.4. Market Entropy
- 4.5. Patent/Trademark Analysis
- 5. Global UCaaS In Energy Market Analysis, Insights and Forecast, 2019-2031
- 5.1. Market Analysis, Insights and Forecast - by Component
- 5.1.1. Telephony
- 5.1.2. Collaboration
- 5.1.3. Unified Messaging
- 5.1.4. Conferencing
- 5.1.5. Other Services
- 5.2. Market Analysis, Insights and Forecast - by Deployment Model
- 5.2.1. Private
- 5.2.2. Public
- 5.2.3. Hybrid Model
- 5.3. Market Analysis, Insights and Forecast - by Enterprise Size
- 5.3.1. Large Enterprise
- 5.3.2. Small & Medium Enterprise
- 5.4. Market Analysis, Insights and Forecast - by Region
- 5.4.1. North America
- 5.4.2. Europe
- 5.4.3. Asia
- 5.4.4. Latin America
- 5.4.5. Middle East and Africa
- 5.1. Market Analysis, Insights and Forecast - by Component
- 6. North America UCaaS In Energy Market Analysis, Insights and Forecast, 2019-2031
- 6.1. Market Analysis, Insights and Forecast - by Component
- 6.1.1. Telephony
- 6.1.2. Collaboration
- 6.1.3. Unified Messaging
- 6.1.4. Conferencing
- 6.1.5. Other Services
- 6.2. Market Analysis, Insights and Forecast - by Deployment Model
- 6.2.1. Private
- 6.2.2. Public
- 6.2.3. Hybrid Model
- 6.3. Market Analysis, Insights and Forecast - by Enterprise Size
- 6.3.1. Large Enterprise
- 6.3.2. Small & Medium Enterprise
- 6.1. Market Analysis, Insights and Forecast - by Component
- 7. Europe UCaaS In Energy Market Analysis, Insights and Forecast, 2019-2031
- 7.1. Market Analysis, Insights and Forecast - by Component
- 7.1.1. Telephony
- 7.1.2. Collaboration
- 7.1.3. Unified Messaging
- 7.1.4. Conferencing
- 7.1.5. Other Services
- 7.2. Market Analysis, Insights and Forecast - by Deployment Model
- 7.2.1. Private
- 7.2.2. Public
- 7.2.3. Hybrid Model
- 7.3. Market Analysis, Insights and Forecast - by Enterprise Size
- 7.3.1. Large Enterprise
- 7.3.2. Small & Medium Enterprise
- 7.1. Market Analysis, Insights and Forecast - by Component
- 8. Asia UCaaS In Energy Market Analysis, Insights and Forecast, 2019-2031
- 8.1. Market Analysis, Insights and Forecast - by Component
- 8.1.1. Telephony
- 8.1.2. Collaboration
- 8.1.3. Unified Messaging
- 8.1.4. Conferencing
- 8.1.5. Other Services
- 8.2. Market Analysis, Insights and Forecast - by Deployment Model
- 8.2.1. Private
- 8.2.2. Public
- 8.2.3. Hybrid Model
- 8.3. Market Analysis, Insights and Forecast - by Enterprise Size
- 8.3.1. Large Enterprise
- 8.3.2. Small & Medium Enterprise
- 8.1. Market Analysis, Insights and Forecast - by Component
- 9. Latin America UCaaS In Energy Market Analysis, Insights and Forecast, 2019-2031
- 9.1. Market Analysis, Insights and Forecast - by Component
- 9.1.1. Telephony
- 9.1.2. Collaboration
- 9.1.3. Unified Messaging
- 9.1.4. Conferencing
- 9.1.5. Other Services
- 9.2. Market Analysis, Insights and Forecast - by Deployment Model
- 9.2.1. Private
- 9.2.2. Public
- 9.2.3. Hybrid Model
- 9.3. Market Analysis, Insights and Forecast - by Enterprise Size
- 9.3.1. Large Enterprise
- 9.3.2. Small & Medium Enterprise
- 9.1. Market Analysis, Insights and Forecast - by Component
- 10. Middle East and Africa UCaaS In Energy Market Analysis, Insights and Forecast, 2019-2031
- 10.1. Market Analysis, Insights and Forecast - by Component
- 10.1.1. Telephony
- 10.1.2. Collaboration
- 10.1.3. Unified Messaging
- 10.1.4. Conferencing
- 10.1.5. Other Services
- 10.2. Market Analysis, Insights and Forecast - by Deployment Model
- 10.2.1. Private
- 10.2.2. Public
- 10.2.3. Hybrid Model
- 10.3. Market Analysis, Insights and Forecast - by Enterprise Size
- 10.3.1. Large Enterprise
- 10.3.2. Small & Medium Enterprise
- 10.1. Market Analysis, Insights and Forecast - by Component
- 11. North America UCaaS In Energy Market Analysis, Insights and Forecast, 2019-2031
- 11.1. Market Analysis, Insights and Forecast - By Country/Sub-region
- 11.1.1.
- 12. Europe UCaaS In Energy Market Analysis, Insights and Forecast, 2019-2031
- 12.1. Market Analysis, Insights and Forecast - By Country/Sub-region
- 12.1.1.
- 13. Asia Pacific UCaaS In Energy Market Analysis, Insights and Forecast, 2019-2031
- 13.1. Market Analysis, Insights and Forecast - By Country/Sub-region
- 13.1.1.
- 14. Latin America UCaaS In Energy Market Analysis, Insights and Forecast, 2019-2031
- 14.1. Market Analysis, Insights and Forecast - By Country/Sub-region
- 14.1.1.
- 15. Middle East UCaaS In Energy Market Analysis, Insights and Forecast, 2019-2031
- 15.1. Market Analysis, Insights and Forecast - By Country/Sub-region
- 15.1.1.
- 16. Competitive Analysis
- 16.1. Global Market Share Analysis 2024
- 16.2. Company Profiles
- 16.2.1 Polycom Inc *List Not Exhaustive
- 16.2.1.1. Overview
- 16.2.1.2. Products
- 16.2.1.3. SWOT Analysis
- 16.2.1.4. Recent Developments
- 16.2.1.5. Financials (Based on Availability)
- 16.2.2 Google LLC
- 16.2.2.1. Overview
- 16.2.2.2. Products
- 16.2.2.3. SWOT Analysis
- 16.2.2.4. Recent Developments
- 16.2.2.5. Financials (Based on Availability)
- 16.2.3 Verizon Enterprise Solutions LLC
- 16.2.3.1. Overview
- 16.2.3.2. Products
- 16.2.3.3. SWOT Analysis
- 16.2.3.4. Recent Developments
- 16.2.3.5. Financials (Based on Availability)
- 16.2.4 West Corporation
- 16.2.4.1. Overview
- 16.2.4.2. Products
- 16.2.4.3. SWOT Analysis
- 16.2.4.4. Recent Developments
- 16.2.4.5. Financials (Based on Availability)
- 16.2.5 Alcatel-Lucent(Nokia Corporation)
- 16.2.5.1. Overview
- 16.2.5.2. Products
- 16.2.5.3. SWOT Analysis
- 16.2.5.4. Recent Developments
- 16.2.5.5. Financials (Based on Availability)
- 16.2.6 Cisco Systems Inc
- 16.2.6.1. Overview
- 16.2.6.2. Products
- 16.2.6.3. SWOT Analysis
- 16.2.6.4. Recent Developments
- 16.2.6.5. Financials (Based on Availability)
- 16.2.7 Microsoft Corporation
- 16.2.7.1. Overview
- 16.2.7.2. Products
- 16.2.7.3. SWOT Analysis
- 16.2.7.4. Recent Developments
- 16.2.7.5. Financials (Based on Availability)
- 16.2.8 International Business Machines Corporation
- 16.2.8.1. Overview
- 16.2.8.2. Products
- 16.2.8.3. SWOT Analysis
- 16.2.8.4. Recent Developments
- 16.2.8.5. Financials (Based on Availability)
- 16.2.9 Avaya Inc
- 16.2.9.1. Overview
- 16.2.9.2. Products
- 16.2.9.3. SWOT Analysis
- 16.2.9.4. Recent Developments
- 16.2.9.5. Financials (Based on Availability)
- 16.2.10 BT Group plc
- 16.2.10.1. Overview
- 16.2.10.2. Products
- 16.2.10.3. SWOT Analysis
- 16.2.10.4. Recent Developments
- 16.2.10.5. Financials (Based on Availability)
- 16.2.1 Polycom Inc *List Not Exhaustive
List of Figures
- Figure 1: Global UCaaS In Energy Market Revenue Breakdown (Million, %) by Region 2024 & 2032
- Figure 2: North America UCaaS In Energy Market Revenue (Million), by Country 2024 & 2032
- Figure 3: North America UCaaS In Energy Market Revenue Share (%), by Country 2024 & 2032
- Figure 4: Europe UCaaS In Energy Market Revenue (Million), by Country 2024 & 2032
- Figure 5: Europe UCaaS In Energy Market Revenue Share (%), by Country 2024 & 2032
- Figure 6: Asia Pacific UCaaS In Energy Market Revenue (Million), by Country 2024 & 2032
- Figure 7: Asia Pacific UCaaS In Energy Market Revenue Share (%), by Country 2024 & 2032
- Figure 8: Latin America UCaaS In Energy Market Revenue (Million), by Country 2024 & 2032
- Figure 9: Latin America UCaaS In Energy Market Revenue Share (%), by Country 2024 & 2032
- Figure 10: Middle East UCaaS In Energy Market Revenue (Million), by Country 2024 & 2032
- Figure 11: Middle East UCaaS In Energy Market Revenue Share (%), by Country 2024 & 2032
- Figure 12: North America UCaaS In Energy Market Revenue (Million), by Component 2024 & 2032
- Figure 13: North America UCaaS In Energy Market Revenue Share (%), by Component 2024 & 2032
- Figure 14: North America UCaaS In Energy Market Revenue (Million), by Deployment Model 2024 & 2032
- Figure 15: North America UCaaS In Energy Market Revenue Share (%), by Deployment Model 2024 & 2032
- Figure 16: North America UCaaS In Energy Market Revenue (Million), by Enterprise Size 2024 & 2032
- Figure 17: North America UCaaS In Energy Market Revenue Share (%), by Enterprise Size 2024 & 2032
- Figure 18: North America UCaaS In Energy Market Revenue (Million), by Country 2024 & 2032
- Figure 19: North America UCaaS In Energy Market Revenue Share (%), by Country 2024 & 2032
- Figure 20: Europe UCaaS In Energy Market Revenue (Million), by Component 2024 & 2032
- Figure 21: Europe UCaaS In Energy Market Revenue Share (%), by Component 2024 & 2032
- Figure 22: Europe UCaaS In Energy Market Revenue (Million), by Deployment Model 2024 & 2032
- Figure 23: Europe UCaaS In Energy Market Revenue Share (%), by Deployment Model 2024 & 2032
- Figure 24: Europe UCaaS In Energy Market Revenue (Million), by Enterprise Size 2024 & 2032
- Figure 25: Europe UCaaS In Energy Market Revenue Share (%), by Enterprise Size 2024 & 2032
- Figure 26: Europe UCaaS In Energy Market Revenue (Million), by Country 2024 & 2032
- Figure 27: Europe UCaaS In Energy Market Revenue Share (%), by Country 2024 & 2032
- Figure 28: Asia UCaaS In Energy Market Revenue (Million), by Component 2024 & 2032
- Figure 29: Asia UCaaS In Energy Market Revenue Share (%), by Component 2024 & 2032
- Figure 30: Asia UCaaS In Energy Market Revenue (Million), by Deployment Model 2024 & 2032
- Figure 31: Asia UCaaS In Energy Market Revenue Share (%), by Deployment Model 2024 & 2032
- Figure 32: Asia UCaaS In Energy Market Revenue (Million), by Enterprise Size 2024 & 2032
- Figure 33: Asia UCaaS In Energy Market Revenue Share (%), by Enterprise Size 2024 & 2032
- Figure 34: Asia UCaaS In Energy Market Revenue (Million), by Country 2024 & 2032
- Figure 35: Asia UCaaS In Energy Market Revenue Share (%), by Country 2024 & 2032
- Figure 36: Latin America UCaaS In Energy Market Revenue (Million), by Component 2024 & 2032
- Figure 37: Latin America UCaaS In Energy Market Revenue Share (%), by Component 2024 & 2032
- Figure 38: Latin America UCaaS In Energy Market Revenue (Million), by Deployment Model 2024 & 2032
- Figure 39: Latin America UCaaS In Energy Market Revenue Share (%), by Deployment Model 2024 & 2032
- Figure 40: Latin America UCaaS In Energy Market Revenue (Million), by Enterprise Size 2024 & 2032
- Figure 41: Latin America UCaaS In Energy Market Revenue Share (%), by Enterprise Size 2024 & 2032
- Figure 42: Latin America UCaaS In Energy Market Revenue (Million), by Country 2024 & 2032
- Figure 43: Latin America UCaaS In Energy Market Revenue Share (%), by Country 2024 & 2032
- Figure 44: Middle East and Africa UCaaS In Energy Market Revenue (Million), by Component 2024 & 2032
- Figure 45: Middle East and Africa UCaaS In Energy Market Revenue Share (%), by Component 2024 & 2032
- Figure 46: Middle East and Africa UCaaS In Energy Market Revenue (Million), by Deployment Model 2024 & 2032
- Figure 47: Middle East and Africa UCaaS In Energy Market Revenue Share (%), by Deployment Model 2024 & 2032
- Figure 48: Middle East and Africa UCaaS In Energy Market Revenue (Million), by Enterprise Size 2024 & 2032
- Figure 49: Middle East and Africa UCaaS In Energy Market Revenue Share (%), by Enterprise Size 2024 & 2032
- Figure 50: Middle East and Africa UCaaS In Energy Market Revenue (Million), by Country 2024 & 2032
- Figure 51: Middle East and Africa UCaaS In Energy Market Revenue Share (%), by Country 2024 & 2032
List of Tables
- Table 1: Global UCaaS In Energy Market Revenue Million Forecast, by Region 2019 & 2032
- Table 2: Global UCaaS In Energy Market Revenue Million Forecast, by Component 2019 & 2032
- Table 3: Global UCaaS In Energy Market Revenue Million Forecast, by Deployment Model 2019 & 2032
- Table 4: Global UCaaS In Energy Market Revenue Million Forecast, by Enterprise Size 2019 & 2032
- Table 5: Global UCaaS In Energy Market Revenue Million Forecast, by Region 2019 & 2032
- Table 6: Global UCaaS In Energy Market Revenue Million Forecast, by Country 2019 & 2032
- Table 7: UCaaS In Energy Market Revenue (Million) Forecast, by Application 2019 & 2032
- Table 8: Global UCaaS In Energy Market Revenue Million Forecast, by Country 2019 & 2032
- Table 9: UCaaS In Energy Market Revenue (Million) Forecast, by Application 2019 & 2032
- Table 10: Global UCaaS In Energy Market Revenue Million Forecast, by Country 2019 & 2032
- Table 11: UCaaS In Energy Market Revenue (Million) Forecast, by Application 2019 & 2032
- Table 12: Global UCaaS In Energy Market Revenue Million Forecast, by Country 2019 & 2032
- Table 13: UCaaS In Energy Market Revenue (Million) Forecast, by Application 2019 & 2032
- Table 14: Global UCaaS In Energy Market Revenue Million Forecast, by Country 2019 & 2032
- Table 15: UCaaS In Energy Market Revenue (Million) Forecast, by Application 2019 & 2032
- Table 16: Global UCaaS In Energy Market Revenue Million Forecast, by Component 2019 & 2032
- Table 17: Global UCaaS In Energy Market Revenue Million Forecast, by Deployment Model 2019 & 2032
- Table 18: Global UCaaS In Energy Market Revenue Million Forecast, by Enterprise Size 2019 & 2032
- Table 19: Global UCaaS In Energy Market Revenue Million Forecast, by Country 2019 & 2032
- Table 20: Global UCaaS In Energy Market Revenue Million Forecast, by Component 2019 & 2032
- Table 21: Global UCaaS In Energy Market Revenue Million Forecast, by Deployment Model 2019 & 2032
- Table 22: Global UCaaS In Energy Market Revenue Million Forecast, by Enterprise Size 2019 & 2032
- Table 23: Global UCaaS In Energy Market Revenue Million Forecast, by Country 2019 & 2032
- Table 24: Global UCaaS In Energy Market Revenue Million Forecast, by Component 2019 & 2032
- Table 25: Global UCaaS In Energy Market Revenue Million Forecast, by Deployment Model 2019 & 2032
- Table 26: Global UCaaS In Energy Market Revenue Million Forecast, by Enterprise Size 2019 & 2032
- Table 27: Global UCaaS In Energy Market Revenue Million Forecast, by Country 2019 & 2032
- Table 28: Global UCaaS In Energy Market Revenue Million Forecast, by Component 2019 & 2032
- Table 29: Global UCaaS In Energy Market Revenue Million Forecast, by Deployment Model 2019 & 2032
- Table 30: Global UCaaS In Energy Market Revenue Million Forecast, by Enterprise Size 2019 & 2032
- Table 31: Global UCaaS In Energy Market Revenue Million Forecast, by Country 2019 & 2032
- Table 32: Global UCaaS In Energy Market Revenue Million Forecast, by Component 2019 & 2032
- Table 33: Global UCaaS In Energy Market Revenue Million Forecast, by Deployment Model 2019 & 2032
- Table 34: Global UCaaS In Energy Market Revenue Million Forecast, by Enterprise Size 2019 & 2032
- Table 35: Global UCaaS In Energy Market Revenue Million Forecast, by Country 2019 & 2032
Frequently Asked Questions
1. What is the projected Compound Annual Growth Rate (CAGR) of the UCaaS In Energy Market?
The projected CAGR is approximately 12.08%.
2. Which companies are prominent players in the UCaaS In Energy Market?
Key companies in the market include Polycom Inc *List Not Exhaustive, Google LLC, Verizon Enterprise Solutions LLC, West Corporation, Alcatel-Lucent(Nokia Corporation), Cisco Systems Inc, Microsoft Corporation, International Business Machines Corporation, Avaya Inc, BT Group plc.
3. What are the main segments of the UCaaS In Energy Market?
The market segments include Component, Deployment Model, Enterprise Size.
4. Can you provide details about the market size?
The market size is estimated to be USD 1.78 Million as of 2022.
5. What are some drivers contributing to market growth?
Proliferation of Cloud Based Ecosystem will Act as a Driver; Improvement of Communication Technology.
6. What are the notable trends driving market growth?
Proliferation of Cloud Based Ecosystem to Drive the Market Growth.
7. Are there any restraints impacting market growth?
Data Security Concerns will Remain a Challenge to the Growth of the Market.
8. Can you provide examples of recent developments in the market?
May 2023: Access4, a leading Unified Communication-as-a-Service (UCaaS) provider, has unveiled a new SMS service, demonstrating its commitment to enhancing partner network growth and bolstering customer retention.
9. What pricing options are available for accessing the report?
Pricing options include single-user, multi-user, and enterprise licenses priced at USD 4750, USD 5250, and USD 8750 respectively.
10. Is the market size provided in terms of value or volume?
The market size is provided in terms of value, measured in Million.
11. Are there any specific market keywords associated with the report?
Yes, the market keyword associated with the report is "UCaaS In Energy Market," which aids in identifying and referencing the specific market segment covered.
12. How do I determine which pricing option suits my needs best?
The pricing options vary based on user requirements and access needs. Individual users may opt for single-user licenses, while businesses requiring broader access may choose multi-user or enterprise licenses for cost-effective access to the report.
13. Are there any additional resources or data provided in the UCaaS In Energy Market report?
While the report offers comprehensive insights, it's advisable to review the specific contents or supplementary materials provided to ascertain if additional resources or data are available.
14. How can I stay updated on further developments or reports in the UCaaS In Energy Market?
To stay informed about further developments, trends, and reports in the UCaaS In Energy Market, consider subscribing to industry newsletters, following relevant companies and organizations, or regularly checking reputable industry news sources and publications.
Methodology
Step 1 - Identification of Relevant Samples Size from Population Database


Step 2 - Approaches for Defining Global Market Size (Value, Volume* & Price*)

Note*: In applicable scenarios
Step 3 - Data Sources
Primary Research
- Web Analytics
- Survey Reports
- Research Institute
- Latest Research Reports
- Opinion Leaders
Secondary Research
- Annual Reports
- White Paper
- Latest Press Release
- Industry Association
- Paid Database
- Investor Presentations

Step 4 - Data Triangulation
Involves using different sources of information in order to increase the validity of a study
These sources are likely to be stakeholders in a program - participants, other researchers, program staff, other community members, and so on.
Then we put all data in single framework & apply various statistical tools to find out the dynamic on the market.
During the analysis stage, feedback from the stakeholder groups would be compared to determine areas of agreement as well as areas of divergence
