

Key Insights
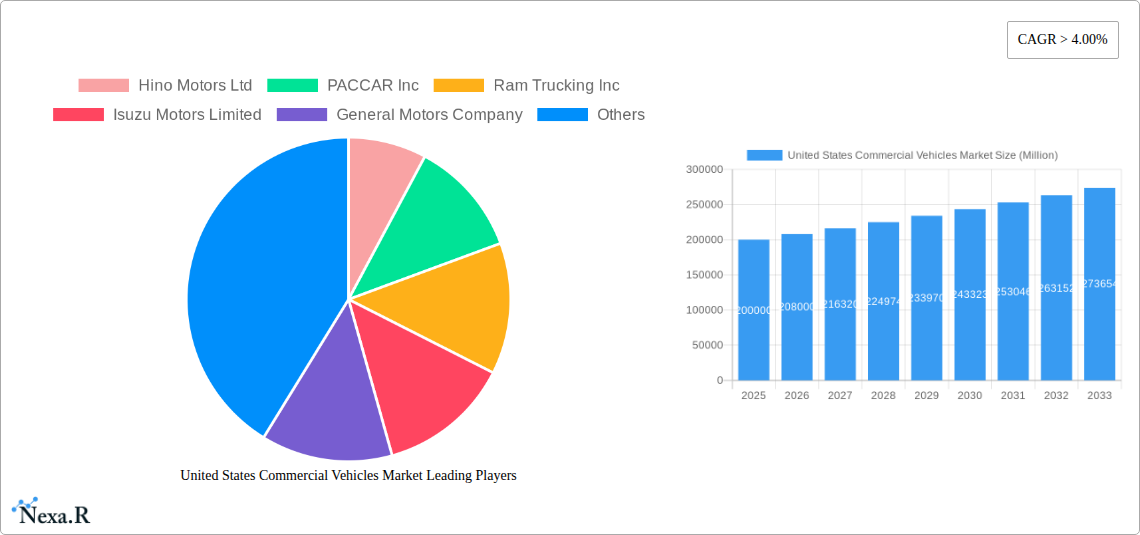
The United States commercial vehicle market is experiencing robust growth, driven by a burgeoning e-commerce sector demanding efficient logistics and a steady expansion of infrastructure projects. The market's Compound Annual Growth Rate (CAGR) exceeding 4% from 2019-2024 indicates a consistently positive trajectory. Key segments within this market include hybrid and electric vehicles, which are gaining traction due to increasing environmental concerns and government regulations promoting sustainable transportation. The adoption of LPG (Liquefied Petroleum Gas) powered commercial vehicles also contributes to the market's dynamism, offering a comparatively cleaner and cost-effective alternative to traditional diesel. Within vehicle types, commercial vehicles, encompassing everything from delivery vans to heavy-duty trucks, constitute the largest segment, reflecting the crucial role of transportation in the American economy. Major players like Hino Motors, PACCAR, and Daimler are competing fiercely, investing heavily in research and development to enhance fuel efficiency, safety features, and technological integration. The market is segmented by vehicle type (heavy-duty trucks, light-duty trucks, buses, etc.) and propulsion type (diesel, gasoline, hybrid, electric, LPG). Future growth will be significantly influenced by government policies regarding emissions standards, infrastructure development spending, and technological advancements in autonomous driving capabilities.
Looking ahead to 2033, the US commercial vehicle market is poised for continued expansion, fueled by sustained economic growth and an increasing demand for efficient freight transportation. While factors such as fluctuating fuel prices and supply chain disruptions may present short-term challenges, the long-term outlook remains optimistic. The continued development and adoption of alternative fuel technologies, coupled with advancements in vehicle automation, will shape the market landscape in the coming years. The growing focus on sustainability and the increasing integration of telematics and data analytics will further drive innovation and create new opportunities for market participants. Competition will remain intense, with established manufacturers and emerging technology companies vying for market share through technological innovation and strategic partnerships.
United States Commercial Vehicles Market: A Comprehensive Report (2019-2033)
This comprehensive report provides a detailed analysis of the United States Commercial Vehicles Market, encompassing market dynamics, growth trends, key players, and future outlook. The study period covers 2019-2033, with 2025 as the base year and a forecast period of 2025-2033. The report segments the market by Propulsion Type (Hybrid and Electric Vehicles, LPG) and Vehicle Type (Commercial Vehicles), offering granular insights into a multi-billion dollar industry. The total market size in 2025 is estimated at xx Million units.
United States Commercial Vehicles Market Dynamics & Structure
The US commercial vehicle market is characterized by a moderate level of concentration, with several major players holding significant market share. Technological innovation, particularly in alternative fuel vehicles (AFVs) and advanced driver-assistance systems (ADAS), is a key driver. Stringent emission regulations and safety standards imposed by the government also significantly shape the market landscape. The market faces competition from substitute modes of transportation like rail and shipping, and the impact of these factors will be considered in the competitive analysis. Mergers and acquisitions (M&A) activity has been moderate in recent years; however, increasing consolidation is expected as companies strive for economies of scale and technological leadership.
- Market Concentration: Moderate, with top 5 players holding approximately xx% of the market share in 2025 (estimated).
- Technological Innovation: Focus on hybrid, electric, and LPG vehicles driven by environmental concerns and government incentives. Significant investments in ADAS and autonomous driving technologies.
- Regulatory Framework: Stringent emission standards and safety regulations influence vehicle design and manufacturing processes.
- Competitive Substitutes: Rail and maritime transportation pose competitive threats, particularly for long-haul freight.
- End-User Demographics: Growth is driven by the logistics, construction, and retail sectors, with increasing demand for efficient and sustainable transportation solutions.
- M&A Trends: Moderate consolidation anticipated as companies seek to expand their product portfolios and strengthen market positions. xx M&A deals estimated during 2019-2024.
United States Commercial Vehicles Market Growth Trends & Insights
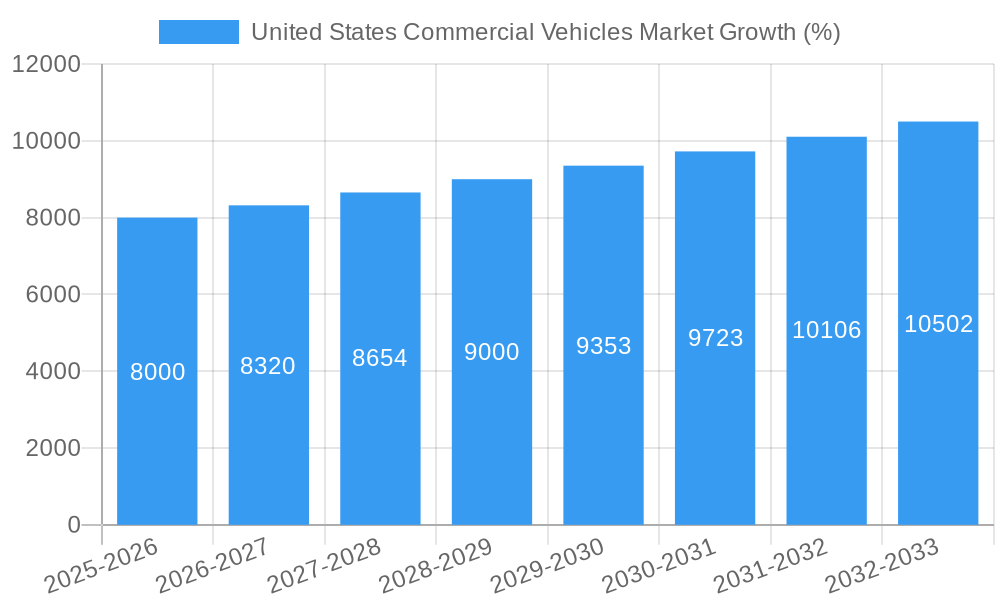
The US commercial vehicle market is expected to witness steady growth throughout the forecast period (2025-2033). This growth will be driven by factors such as increasing e-commerce activity, infrastructure development, and rising demand for efficient logistics solutions. The adoption rate of AFVs is projected to increase significantly, driven by government incentives and growing environmental concerns. Technological advancements, such as the integration of telematics and connected vehicle technologies, are also transforming the industry. Consumer behavior is shifting towards fuel-efficient and environmentally friendly options, further accelerating the adoption of alternative fuel vehicles.
- Market Size Evolution: The market size is expected to grow at a CAGR of xx% during 2025-2033, reaching xx Million units by 2033.
- Adoption Rates: The adoption rate of hybrid and electric commercial vehicles will increase significantly, driven by government incentives and sustainability concerns. Penetration is estimated at xx% in 2025.
- Technological Disruptions: Advancements in ADAS, autonomous driving, and connected vehicle technologies will reshape the market landscape.
- Consumer Behavior Shifts: Growing preference for fuel efficiency, lower emissions, and enhanced safety features is transforming consumer demand.
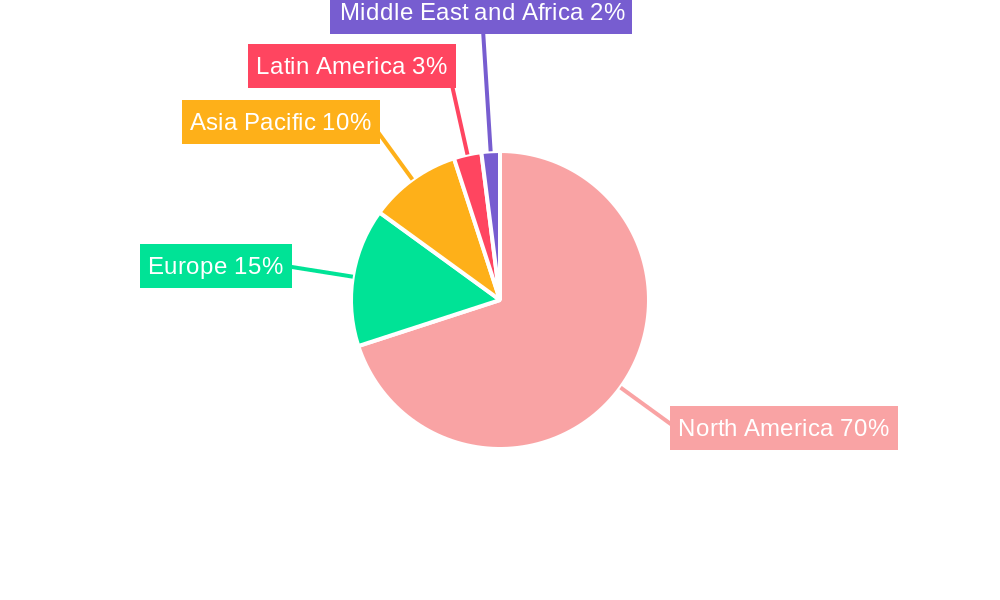
Dominant Regions, Countries, or Segments in United States Commercial Vehicles Market
The California and Texas regions are anticipated to be the leading markets for commercial vehicles in the United States, driven by robust economic activity, extensive infrastructure development, and high population density. The Hybrid and Electric Vehicles segment shows significant growth potential, fueled by government regulations promoting sustainable transportation and decreasing battery costs. The LPG segment, while smaller, is expected to maintain a stable market share due to its lower cost compared to electric vehicles.
- California: High demand from logistics and retail sectors, coupled with strong government support for sustainable transportation, fuels market growth.
- Texas: Large-scale infrastructure projects and a growing population create substantial demand for commercial vehicles.
- Hybrid and Electric Vehicles Segment: Driven by government incentives, environmental regulations, and decreasing battery costs.
- LPG Segment: Offers a cost-effective alternative to gasoline and diesel, maintaining a stable market share.
United States Commercial Vehicles Market Product Landscape
The market showcases a diverse product landscape with a focus on innovation in fuel efficiency, safety, and technological integration. Manufacturers are incorporating advanced driver-assistance systems (ADAS), telematics, and connected vehicle technologies to enhance operational efficiency and safety. Heavy-duty vehicles are increasingly adopting hybrid and electric powertrains, while lighter-duty vehicles see growth in fuel-efficient gasoline and diesel options. Key product differentiators include payload capacity, fuel economy, safety features, and technological advancements in automation and connectivity.
Key Drivers, Barriers & Challenges in United States Commercial Vehicles Market
Key Drivers:
- Growing e-commerce: Driving demand for efficient last-mile delivery solutions.
- Infrastructure development: Creating demand for construction and transportation equipment.
- Government regulations: Promoting the adoption of fuel-efficient and low-emission vehicles.
- Technological advancements: Improving vehicle performance and efficiency.
Key Challenges:
- Supply chain disruptions: Impacting vehicle production and availability. (Quantifiable impact: xx% increase in production costs in 2023)
- Regulatory hurdles: Complex certification and compliance requirements increase costs.
- High initial investment costs: For hybrid and electric vehicles, hindering widespread adoption.
- Competitive pressures: From both domestic and international manufacturers.
Emerging Opportunities in United States Commercial Vehicles Market
- Autonomous driving technology: Significant growth potential in long-haul trucking and fleet management.
- Electrification of heavy-duty vehicles: Driven by government incentives and environmental concerns.
- Growth in specialized vehicles: Demand for customized solutions for specific industries (e.g., refrigerated trucks).
- Expansion into rural areas: Untapped market potential with rising transportation needs.
Growth Accelerators in the United States Commercial Vehicles Market Industry
Technological advancements are crucial growth drivers, particularly in autonomous driving, electrification, and connectivity. Strategic partnerships between manufacturers, technology providers, and logistics companies foster innovation and market expansion. Government incentives and supportive policies play a vital role in accelerating the adoption of alternative fuel vehicles and sustainable transportation solutions. Expansion into new markets and the development of niche vehicle types also present opportunities for growth.
Key Players Shaping the United States Commercial Vehicles Market Market
- Hino Motors Ltd
- PACCAR Inc
- Ram Trucking Inc
- Isuzu Motors Limited
- General Motors Company
- Daimler AG (Mercedes-Benz AG)
- Daimler Truck Holding AG
- Volvo Group
- Toyota Motor Corporation
- Ford Motor Company
Notable Milestones in United States Commercial Vehicles Market Sector
- August 2023: General Motors announces the launch of an all-electric Cadillac Escalade in late 2024, signaling a significant commitment to the EV market.
- August 2023: General Motors reinforces its dedication to electric vehicles with expanded plans for the Middle East market.
- August 2023: Toyota Kirloskar Motor launches the all-new MPV Vellfire strong hybrid electric vehicle (SHEV), indicating a growing focus on hybrid technology within the passenger vehicle segment (indirect impact on commercial vehicle trends).
In-Depth United States Commercial Vehicles Market Market Outlook
The US commercial vehicle market is poised for continued growth, driven by technological innovation, supportive government policies, and evolving consumer preferences. Opportunities exist in the electrification of heavy-duty vehicles, the development of autonomous driving technologies, and the expansion into new market segments. Strategic partnerships and investments in research and development will be crucial for companies to capitalize on this growth potential and maintain a competitive edge. The market’s long-term outlook remains positive, with significant potential for growth and transformation in the coming decade.
United States Commercial Vehicles Market Segmentation
-
1. Vehicle Type
-
1.1. Commercial Vehicles
- 1.1.1. Buses
- 1.1.2. Heavy-duty Commercial Trucks
- 1.1.3. Light Commercial Pick-up Trucks
- 1.1.4. Light Commercial Vans
- 1.1.5. Medium-duty Commercial Trucks
-
1.1. Commercial Vehicles
-
2. Propulsion Type
-
2.1. Hybrid and Electric Vehicles
-
2.1.1. By Fuel Category
- 2.1.1.1. BEV
- 2.1.1.2. FCEV
- 2.1.1.3. HEV
- 2.1.1.4. PHEV
-
2.1.1. By Fuel Category
-
2.2. ICE
- 2.2.1. CNG
- 2.2.2. Diesel
- 2.2.3. Gasoline
- 2.2.4. LPG
-
2.1. Hybrid and Electric Vehicles
United States Commercial Vehicles Market Segmentation By Geography
- 1. United States
United States Commercial Vehicles Market REPORT HIGHLIGHTS
| Aspects | Details |
|---|---|
| Study Period | 2019-2033 |
| Base Year | 2024 |
| Estimated Year | 2025 |
| Forecast Period | 2025-2033 |
| Historical Period | 2019-2024 |
| Growth Rate | CAGR of > 4.00% from 2019-2033 |
| Segmentation |
|
Table of Contents
- 1. Introduction
- 1.1. Research Scope
- 1.2. Market Segmentation
- 1.3. Research Methodology
- 1.4. Definitions and Assumptions
- 2. Executive Summary
- 2.1. Introduction
- 3. Market Dynamics
- 3.1. Introduction
- 3.2. Market Drivers
- 3.2.1. Rapid Urbanization and Demand for Convinient Transportation
- 3.3. Market Restrains
- 3.3.1. Traffic Congestion in Major Cities
- 3.4. Market Trends
- 3.4.1. OTHER KEY INDUSTRY TRENDS COVERED IN THE REPORT
- 4. Market Factor Analysis
- 4.1. Porters Five Forces
- 4.2. Supply/Value Chain
- 4.3. PESTEL analysis
- 4.4. Market Entropy
- 4.5. Patent/Trademark Analysis
- 5. United States Commercial Vehicles Market Analysis, Insights and Forecast, 2019-2031
- 5.1. Market Analysis, Insights and Forecast - by Vehicle Type
- 5.1.1. Commercial Vehicles
- 5.1.1.1. Buses
- 5.1.1.2. Heavy-duty Commercial Trucks
- 5.1.1.3. Light Commercial Pick-up Trucks
- 5.1.1.4. Light Commercial Vans
- 5.1.1.5. Medium-duty Commercial Trucks
- 5.1.1. Commercial Vehicles
- 5.2. Market Analysis, Insights and Forecast - by Propulsion Type
- 5.2.1. Hybrid and Electric Vehicles
- 5.2.1.1. By Fuel Category
- 5.2.1.1.1. BEV
- 5.2.1.1.2. FCEV
- 5.2.1.1.3. HEV
- 5.2.1.1.4. PHEV
- 5.2.1.1. By Fuel Category
- 5.2.2. ICE
- 5.2.2.1. CNG
- 5.2.2.2. Diesel
- 5.2.2.3. Gasoline
- 5.2.2.4. LPG
- 5.2.1. Hybrid and Electric Vehicles
- 5.3. Market Analysis, Insights and Forecast - by Region
- 5.3.1. United States
- 5.1. Market Analysis, Insights and Forecast - by Vehicle Type
- 6. North America United States Commercial Vehicles Market Analysis, Insights and Forecast, 2019-2031
- 6.1. Market Analysis, Insights and Forecast - By Country/Sub-region
- 6.1.1 United States
- 6.1.2 Canada
- 6.1.3 Rest of North America
- 7. Europe United States Commercial Vehicles Market Analysis, Insights and Forecast, 2019-2031
- 7.1. Market Analysis, Insights and Forecast - By Country/Sub-region
- 7.1.1 Germany
- 7.1.2 United Kingdom
- 7.1.3 France
- 7.1.4 Russia
- 7.1.5 Spain
- 7.1.6 Rest of Europe
- 8. Asia Pacific United States Commercial Vehicles Market Analysis, Insights and Forecast, 2019-2031
- 8.1. Market Analysis, Insights and Forecast - By Country/Sub-region
- 8.1.1 India
- 8.1.2 China
- 8.1.3 Japan
- 8.1.4 South Korea
- 8.1.5 Australia
- 8.1.6 Rest of Asia Pacific
- 9. Latin America United States Commercial Vehicles Market Analysis, Insights and Forecast, 2019-2031
- 9.1. Market Analysis, Insights and Forecast - By Country/Sub-region
- 9.1.1 Mexico
- 9.1.2 Brazil
- 9.1.3 Argentina
- 9.1.4 Rest Of Latin America
- 10. Middle East and Africa United States Commercial Vehicles Market Analysis, Insights and Forecast, 2019-2031
- 10.1. Market Analysis, Insights and Forecast - By Country/Sub-region
- 10.1.1 United Arab Emirates
- 10.1.2 Saudi Arabia
- 10.1.3 Rest of Middle East and Africa
- 11. Competitive Analysis
- 11.1. Market Share Analysis 2024
- 11.2. Company Profiles
- 11.2.1 Hino Motors Ltd
- 11.2.1.1. Overview
- 11.2.1.2. Products
- 11.2.1.3. SWOT Analysis
- 11.2.1.4. Recent Developments
- 11.2.1.5. Financials (Based on Availability)
- 11.2.2 PACCAR Inc
- 11.2.2.1. Overview
- 11.2.2.2. Products
- 11.2.2.3. SWOT Analysis
- 11.2.2.4. Recent Developments
- 11.2.2.5. Financials (Based on Availability)
- 11.2.3 Ram Trucking Inc
- 11.2.3.1. Overview
- 11.2.3.2. Products
- 11.2.3.3. SWOT Analysis
- 11.2.3.4. Recent Developments
- 11.2.3.5. Financials (Based on Availability)
- 11.2.4 Isuzu Motors Limited
- 11.2.4.1. Overview
- 11.2.4.2. Products
- 11.2.4.3. SWOT Analysis
- 11.2.4.4. Recent Developments
- 11.2.4.5. Financials (Based on Availability)
- 11.2.5 General Motors Company
- 11.2.5.1. Overview
- 11.2.5.2. Products
- 11.2.5.3. SWOT Analysis
- 11.2.5.4. Recent Developments
- 11.2.5.5. Financials (Based on Availability)
- 11.2.6 Daimler AG (Mercedes-Benz AG)
- 11.2.6.1. Overview
- 11.2.6.2. Products
- 11.2.6.3. SWOT Analysis
- 11.2.6.4. Recent Developments
- 11.2.6.5. Financials (Based on Availability)
- 11.2.7 Daimler Truck Holding AG
- 11.2.7.1. Overview
- 11.2.7.2. Products
- 11.2.7.3. SWOT Analysis
- 11.2.7.4. Recent Developments
- 11.2.7.5. Financials (Based on Availability)
- 11.2.8 Volvo Grou
- 11.2.8.1. Overview
- 11.2.8.2. Products
- 11.2.8.3. SWOT Analysis
- 11.2.8.4. Recent Developments
- 11.2.8.5. Financials (Based on Availability)
- 11.2.9 Toyota Motor Corporation
- 11.2.9.1. Overview
- 11.2.9.2. Products
- 11.2.9.3. SWOT Analysis
- 11.2.9.4. Recent Developments
- 11.2.9.5. Financials (Based on Availability)
- 11.2.10 Ford Motor Company
- 11.2.10.1. Overview
- 11.2.10.2. Products
- 11.2.10.3. SWOT Analysis
- 11.2.10.4. Recent Developments
- 11.2.10.5. Financials (Based on Availability)
- 11.2.1 Hino Motors Ltd
List of Figures
- Figure 1: United States Commercial Vehicles Market Revenue Breakdown (Million, %) by Product 2024 & 2032
- Figure 2: United States Commercial Vehicles Market Share (%) by Company 2024
List of Tables
- Table 1: United States Commercial Vehicles Market Revenue Million Forecast, by Region 2019 & 2032
- Table 2: United States Commercial Vehicles Market Revenue Million Forecast, by Vehicle Type 2019 & 2032
- Table 3: United States Commercial Vehicles Market Revenue Million Forecast, by Propulsion Type 2019 & 2032
- Table 4: United States Commercial Vehicles Market Revenue Million Forecast, by Region 2019 & 2032
- Table 5: United States Commercial Vehicles Market Revenue Million Forecast, by Country 2019 & 2032
- Table 6: United States United States Commercial Vehicles Market Revenue (Million) Forecast, by Application 2019 & 2032
- Table 7: Canada United States Commercial Vehicles Market Revenue (Million) Forecast, by Application 2019 & 2032
- Table 8: Rest of North America United States Commercial Vehicles Market Revenue (Million) Forecast, by Application 2019 & 2032
- Table 9: United States Commercial Vehicles Market Revenue Million Forecast, by Country 2019 & 2032
- Table 10: Germany United States Commercial Vehicles Market Revenue (Million) Forecast, by Application 2019 & 2032
- Table 11: United Kingdom United States Commercial Vehicles Market Revenue (Million) Forecast, by Application 2019 & 2032
- Table 12: France United States Commercial Vehicles Market Revenue (Million) Forecast, by Application 2019 & 2032
- Table 13: Russia United States Commercial Vehicles Market Revenue (Million) Forecast, by Application 2019 & 2032
- Table 14: Spain United States Commercial Vehicles Market Revenue (Million) Forecast, by Application 2019 & 2032
- Table 15: Rest of Europe United States Commercial Vehicles Market Revenue (Million) Forecast, by Application 2019 & 2032
- Table 16: United States Commercial Vehicles Market Revenue Million Forecast, by Country 2019 & 2032
- Table 17: India United States Commercial Vehicles Market Revenue (Million) Forecast, by Application 2019 & 2032
- Table 18: China United States Commercial Vehicles Market Revenue (Million) Forecast, by Application 2019 & 2032
- Table 19: Japan United States Commercial Vehicles Market Revenue (Million) Forecast, by Application 2019 & 2032
- Table 20: South Korea United States Commercial Vehicles Market Revenue (Million) Forecast, by Application 2019 & 2032
- Table 21: Australia United States Commercial Vehicles Market Revenue (Million) Forecast, by Application 2019 & 2032
- Table 22: Rest of Asia Pacific United States Commercial Vehicles Market Revenue (Million) Forecast, by Application 2019 & 2032
- Table 23: United States Commercial Vehicles Market Revenue Million Forecast, by Country 2019 & 2032
- Table 24: Mexico United States Commercial Vehicles Market Revenue (Million) Forecast, by Application 2019 & 2032
- Table 25: Brazil United States Commercial Vehicles Market Revenue (Million) Forecast, by Application 2019 & 2032
- Table 26: Argentina United States Commercial Vehicles Market Revenue (Million) Forecast, by Application 2019 & 2032
- Table 27: Rest Of Latin America United States Commercial Vehicles Market Revenue (Million) Forecast, by Application 2019 & 2032
- Table 28: United States Commercial Vehicles Market Revenue Million Forecast, by Country 2019 & 2032
- Table 29: United Arab Emirates United States Commercial Vehicles Market Revenue (Million) Forecast, by Application 2019 & 2032
- Table 30: Saudi Arabia United States Commercial Vehicles Market Revenue (Million) Forecast, by Application 2019 & 2032
- Table 31: Rest of Middle East and Africa United States Commercial Vehicles Market Revenue (Million) Forecast, by Application 2019 & 2032
- Table 32: United States Commercial Vehicles Market Revenue Million Forecast, by Vehicle Type 2019 & 2032
- Table 33: United States Commercial Vehicles Market Revenue Million Forecast, by Propulsion Type 2019 & 2032
- Table 34: United States Commercial Vehicles Market Revenue Million Forecast, by Country 2019 & 2032
Frequently Asked Questions
1. What is the projected Compound Annual Growth Rate (CAGR) of the United States Commercial Vehicles Market?
The projected CAGR is approximately > 4.00%.
2. Which companies are prominent players in the United States Commercial Vehicles Market?
Key companies in the market include Hino Motors Ltd, PACCAR Inc, Ram Trucking Inc, Isuzu Motors Limited, General Motors Company, Daimler AG (Mercedes-Benz AG), Daimler Truck Holding AG, Volvo Grou, Toyota Motor Corporation, Ford Motor Company.
3. What are the main segments of the United States Commercial Vehicles Market?
The market segments include Vehicle Type, Propulsion Type.
4. Can you provide details about the market size?
The market size is estimated to be USD XX Million as of 2022.
5. What are some drivers contributing to market growth?
Rapid Urbanization and Demand for Convinient Transportation.
6. What are the notable trends driving market growth?
OTHER KEY INDUSTRY TRENDS COVERED IN THE REPORT.
7. Are there any restraints impacting market growth?
Traffic Congestion in Major Cities.
8. Can you provide examples of recent developments in the market?
August 2023: General Motors will launch an all-electric Cadillac Escalade in late 2024August 2023: General Motors doubles down on plans for an electric future in the Middle East.August 2023: Toyota Kirloskar Motor launched the all-new MPV Vellfire strong hybrid electric vehicle (SHEV) for a starting price of INR 11.99 million and going to INR 12.99 million.
9. What pricing options are available for accessing the report?
Pricing options include single-user, multi-user, and enterprise licenses priced at USD 3800, USD 4500, and USD 5800 respectively.
10. Is the market size provided in terms of value or volume?
The market size is provided in terms of value, measured in Million.
11. Are there any specific market keywords associated with the report?
Yes, the market keyword associated with the report is "United States Commercial Vehicles Market," which aids in identifying and referencing the specific market segment covered.
12. How do I determine which pricing option suits my needs best?
The pricing options vary based on user requirements and access needs. Individual users may opt for single-user licenses, while businesses requiring broader access may choose multi-user or enterprise licenses for cost-effective access to the report.
13. Are there any additional resources or data provided in the United States Commercial Vehicles Market report?
While the report offers comprehensive insights, it's advisable to review the specific contents or supplementary materials provided to ascertain if additional resources or data are available.
14. How can I stay updated on further developments or reports in the United States Commercial Vehicles Market?
To stay informed about further developments, trends, and reports in the United States Commercial Vehicles Market, consider subscribing to industry newsletters, following relevant companies and organizations, or regularly checking reputable industry news sources and publications.
Methodology
Step 1 - Identification of Relevant Samples Size from Population Database


Step 2 - Approaches for Defining Global Market Size (Value, Volume* & Price*)

Note*: In applicable scenarios
Step 3 - Data Sources
Primary Research
- Web Analytics
- Survey Reports
- Research Institute
- Latest Research Reports
- Opinion Leaders
Secondary Research
- Annual Reports
- White Paper
- Latest Press Release
- Industry Association
- Paid Database
- Investor Presentations

Step 4 - Data Triangulation
Involves using different sources of information in order to increase the validity of a study
These sources are likely to be stakeholders in a program - participants, other researchers, program staff, other community members, and so on.
Then we put all data in single framework & apply various statistical tools to find out the dynamic on the market.
During the analysis stage, feedback from the stakeholder groups would be compared to determine areas of agreement as well as areas of divergence
