

Key Insights
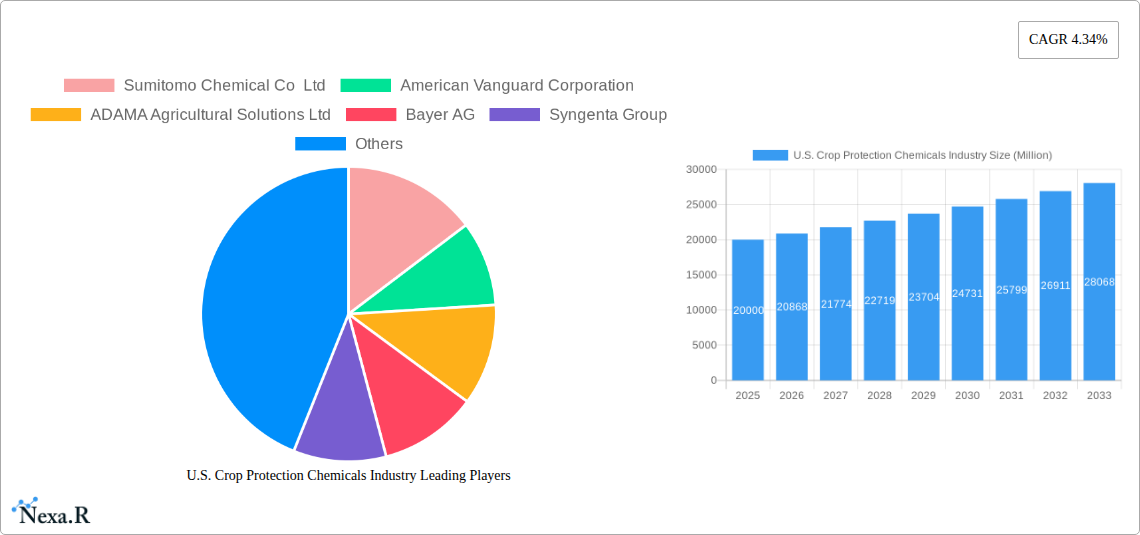
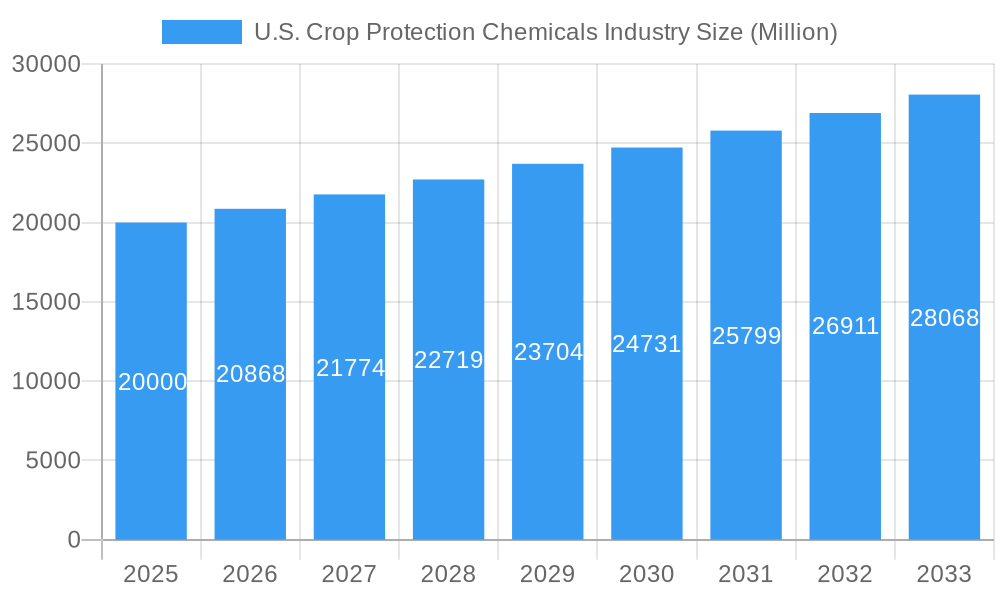
The U.S. crop protection chemicals market, valued at approximately $20 billion in 2025, is projected to experience steady growth, exhibiting a compound annual growth rate (CAGR) of 4.34% from 2025 to 2033. This growth is fueled by several key drivers. Increasing demand for food due to a burgeoning population necessitates higher crop yields, driving the adoption of advanced crop protection solutions. Furthermore, the prevalence of pests and diseases, coupled with changing climatic conditions increasing the susceptibility of crops to damage, further intensifies the need for effective crop protection chemicals. Technological advancements in the formulation of these chemicals, leading to improved efficacy and reduced environmental impact, also contribute positively to market expansion. The market is segmented by function (fungicides, herbicides, insecticides, etc.), application mode (foliar, chemigation, seed treatment, etc.), and crop type (fruits & vegetables, grains & cereals, etc.). Herbicides and insecticides are currently the largest segments, driven by the extensive use of these chemicals in major crop productions. Growing awareness of sustainable agriculture practices and stricter regulatory environments, however, pose potential restraints on market growth, prompting companies to develop more environmentally friendly products.
U.S. Crop Protection Chemicals Industry Market Size (In Billion)
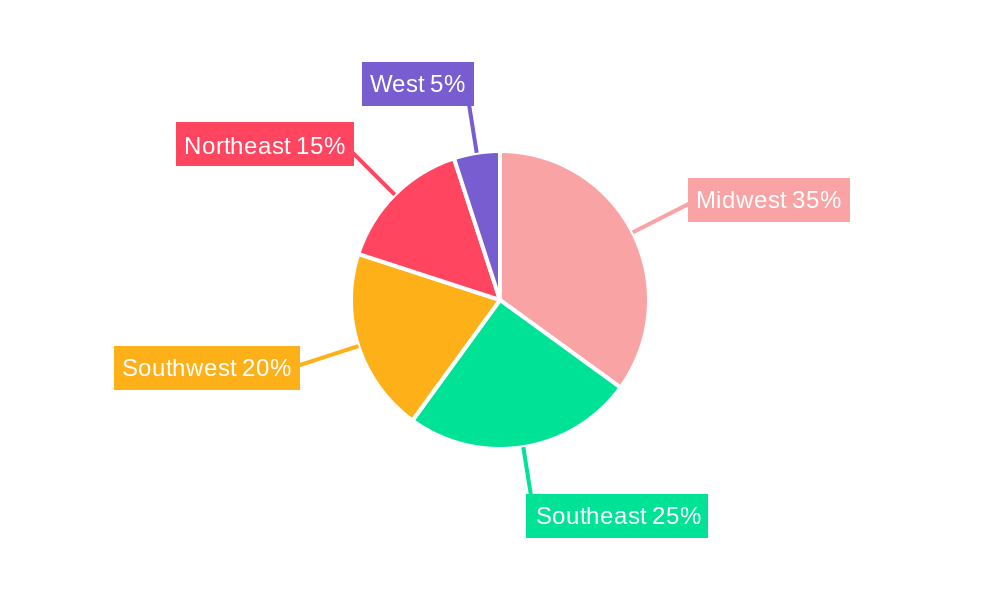
Regional variations within the U.S. market exist. States within the Midwest, known for extensive grain and cereal production, represent a significant portion of market demand. Similarly, the Southeast and Southwest, with their diverse agricultural landscapes, contribute substantially to market size. Major players such as Sumitomo Chemical, Bayer, Syngenta, BASF, and Corteva dominate the market, constantly innovating and competing to capture market share through product development, mergers, and acquisitions. The forecast period (2025-2033) anticipates a continuation of this growth trajectory, driven by the factors mentioned above. However, the industry's response to environmental concerns and the ongoing development of biological and integrated pest management strategies will significantly shape the future market landscape.
U.S. Crop Protection Chemicals Industry Company Market Share
U.S. Crop Protection Chemicals Industry: A Comprehensive Market Report (2019-2033)
This comprehensive report provides a detailed analysis of the U.S. Crop Protection Chemicals industry, encompassing market dynamics, growth trends, competitive landscape, and future outlook. With a study period spanning 2019-2033, a base year of 2025, and a forecast period of 2025-2033, this report is an indispensable resource for industry professionals, investors, and strategic decision-makers. The report utilizes robust data analysis and forecasts to deliver actionable insights across key segments, including fungicides, herbicides, insecticides, and more.
U.S. Crop Protection Chemicals Industry Market Dynamics & Structure
This section analyzes the U.S. crop protection chemicals market structure, identifying key trends and influencing factors. The market is characterized by a moderately concentrated landscape with several major players controlling significant market share. Technological innovation, driven by the need for higher efficacy and reduced environmental impact, is a major driver. Stringent regulatory frameworks, including the EPA's guidelines, significantly impact product development and market entry. Competitive pressure from biopesticides and other sustainable alternatives is also notable. End-user demographics, primarily encompassing large-scale commercial farms and smaller-scale agricultural operations, shape demand patterns. M&A activity has been significant, with several large-scale mergers and acquisitions impacting market consolidation.
- Market Concentration: The top 10 players hold approximately xx% of the market share in 2025.
- Technological Innovation: Focus on precision application technologies, biopesticides, and AI-driven solutions.
- Regulatory Landscape: EPA regulations significantly impact product registration and market access.
- M&A Activity: xx major M&A deals recorded between 2019 and 2024, valued at approximately $xx million.
- Competitive Substitutes: Growing market share of biopesticides and organic farming practices.
U.S. Crop Protection Chemicals Industry Growth Trends & Insights
The U.S. crop protection chemicals market exhibits steady growth, driven by factors such as increasing crop yields, expanding acreage under cultivation, and rising demand for food security. The historical period (2019-2024) saw a compound annual growth rate (CAGR) of xx%, while the forecast period (2025-2033) is projected to show a CAGR of xx%. This growth is influenced by factors such as technological advancements, changing farming practices, and government support for agricultural development. Market penetration of advanced technologies, such as precision spraying and drone-based applications, is gradually increasing. Consumer preferences are shifting towards sustainably produced food, influencing demand for eco-friendly crop protection solutions.
Dominant Regions, Countries, or Segments in U.S. Crop Protection Chemicals Industry
The U.S. crop protection chemicals market is geographically diverse, with significant variations in demand across regions. The Midwest, known for its extensive grain and soybean production, shows the highest consumption of herbicides and insecticides. California, a major producer of fruits and vegetables, demonstrates high demand for fungicides and insecticides. Among the function segments, herbicides dominate the market, followed by insecticides and fungicides, reflecting the prevalence of weed control and pest management practices. The foliar application mode remains dominant due to its efficacy and ease of use.
- High Growth Segments: Herbicides for grains & cereals, fungicides for fruits & vegetables, and seed treatment for pulses & oilseeds.
- Key Drivers: Government agricultural subsidies, favorable weather conditions, and technological advancements in application methods.
- Market Share: The Midwest region accounts for approximately xx% of the total market value in 2025.
U.S. Crop Protection Chemicals Industry Product Landscape
The U.S. crop protection chemicals market features a diverse range of products, including conventional chemical pesticides and emerging biopesticides. Product innovation focuses on improving efficacy, reducing environmental impact, and enhancing target specificity. Recent advancements include the development of systemic insecticides, broad-spectrum fungicides, and herbicide-resistant seed treatments. Unique selling propositions include improved crop yields, reduced pesticide application rates, and compatibility with integrated pest management (IPM) strategies. Performance metrics like efficacy, residual activity, and environmental impact are critical factors driving product adoption.
Key Drivers, Barriers & Challenges in U.S. Crop Protection Chemicals Industry
Key Drivers:
- Increasing demand for food security leading to higher crop yields and production.
- Adoption of advanced agricultural technologies leading to greater demand for crop protection chemicals.
- Government initiatives and subsidies supporting the agricultural sector.
Challenges & Restraints:
- Stringent environmental regulations and growing public concerns over pesticide use.
- Emergence of biopesticides and other sustainable alternatives creating competition.
- Supply chain disruptions and fluctuations in raw material costs. These disruptions impacted market supply by xx% in 2022.
Emerging Opportunities in U.S. Crop Protection Chemicals Industry
Emerging opportunities lie in developing eco-friendly and bio-based crop protection solutions, meeting growing consumer demand for sustainable agricultural practices. There's significant potential in leveraging precision agriculture technologies for targeted pesticide applications, minimizing environmental impact. Expansion into niche markets, such as organic farming and specialty crops, presents further growth opportunities. Developing integrated pest management (IPM) strategies that combine different methods for optimal pest control also represents a valuable opportunity.
Growth Accelerators in the U.S. Crop Protection Chemicals Industry
Long-term growth will be propelled by technological advancements in formulation and application techniques, enabling greater efficacy and sustainability. Strategic partnerships between chemical companies and agricultural technology providers will accelerate the adoption of precision agriculture methods. Expansion into new markets through product diversification and international collaborations will also drive long-term market expansion.
Key Players Shaping the U.S. Crop Protection Chemicals Market
- Sumitomo Chemical Co Ltd
- American Vanguard Corporation
- ADAMA Agricultural Solutions Ltd
- Bayer AG
- Syngenta Group
- BASF SE
- FMC Corporation
- UPL Limite
- Corteva Agriscience
- Nufarm Ltd
Notable Milestones in U.S. Crop Protection Chemicals Industry Sector
- April 2023: Nufarm launched Tourney EZ, a liquid formulation fungicide for turf and ornamental crops.
- March 2023: AMVAC launched new herbicides (Impact Core and Sinate) targeting weed resistance in maize.
- January 2023: Bayer partnered with Oerth Bio to develop eco-friendly crop protection solutions.
In-Depth U.S. Crop Protection Chemicals Industry Market Outlook
The future of the U.S. crop protection chemicals market is promising, driven by factors such as growing global food demand, technological advancements in precision agriculture, and increasing emphasis on sustainable agricultural practices. Strategic opportunities lie in developing innovative products with reduced environmental impact and exploring new markets in specialty crops and organic farming. Companies focused on research and development, sustainability initiatives, and strategic partnerships will be well-positioned for long-term success in this dynamic market.
U.S. Crop Protection Chemicals Industry Segmentation
-
1. Function
- 1.1. Fungicide
- 1.2. Herbicide
- 1.3. Insecticide
- 1.4. Molluscicide
- 1.5. Nematicide
-
2. Application Mode
- 2.1. Chemigation
- 2.2. Foliar
- 2.3. Fumigation
- 2.4. Seed Treatment
- 2.5. Soil Treatment
-
3. Crop Type
- 3.1. Commercial Crops
- 3.2. Fruits & Vegetables
- 3.3. Grains & Cereals
- 3.4. Pulses & Oilseeds
- 3.5. Turf & Ornamental
-
4. Function
- 4.1. Fungicide
- 4.2. Herbicide
- 4.3. Insecticide
- 4.4. Molluscicide
- 4.5. Nematicide
-
5. Application Mode
- 5.1. Chemigation
- 5.2. Foliar
- 5.3. Fumigation
- 5.4. Seed Treatment
- 5.5. Soil Treatment
-
6. Crop Type
- 6.1. Commercial Crops
- 6.2. Fruits & Vegetables
- 6.3. Grains & Cereals
- 6.4. Pulses & Oilseeds
- 6.5. Turf & Ornamental
U.S. Crop Protection Chemicals Industry Segmentation By Geography
- 1. U.S.
U.S. Crop Protection Chemicals Industry Regional Market Share
Geographic Coverage of U.S. Crop Protection Chemicals Industry
U.S. Crop Protection Chemicals Industry REPORT HIGHLIGHTS
| Aspects | Details |
|---|---|
| Study Period | 2020-2034 |
| Base Year | 2025 |
| Estimated Year | 2026 |
| Forecast Period | 2026-2034 |
| Historical Period | 2020-2025 |
| Growth Rate | CAGR of 5% from 2020-2034 |
| Segmentation |
|
Table of Contents
- 1. Introduction
- 1.1. Research Scope
- 1.2. Market Segmentation
- 1.3. Research Methodology
- 1.4. Definitions and Assumptions
- 2. Executive Summary
- 2.1. Introduction
- 3. Market Dynamics
- 3.1. Introduction
- 3.2. Market Drivers
- 3.2.1. Seed Treatment As A Solution To Enhance Yield; Growing Awareness For Seed Treatment Among The Farmers; Rising Trend Of Organic Farming
- 3.3. Market Restrains
- 3.3.1. Limitations Across Farm-Level Seed Treatment; Rising Environmental Concerns
- 3.4. Market Trends
- 3.4.1 Rise in weed infestations
- 3.4.2 shortage of labor
- 3.4.3 increased wages
- 3.4.4 and need for higher food production may drive the herbicide market in the country
- 4. Market Factor Analysis
- 4.1. Porters Five Forces
- 4.2. Supply/Value Chain
- 4.3. PESTEL analysis
- 4.4. Market Entropy
- 4.5. Patent/Trademark Analysis
- 5. U.S. Crop Protection Chemicals Industry Analysis, Insights and Forecast, 2020-2032
- 5.1. Market Analysis, Insights and Forecast - by Function
- 5.1.1. Fungicide
- 5.1.2. Herbicide
- 5.1.3. Insecticide
- 5.1.4. Molluscicide
- 5.1.5. Nematicide
- 5.2. Market Analysis, Insights and Forecast - by Application Mode
- 5.2.1. Chemigation
- 5.2.2. Foliar
- 5.2.3. Fumigation
- 5.2.4. Seed Treatment
- 5.2.5. Soil Treatment
- 5.3. Market Analysis, Insights and Forecast - by Crop Type
- 5.3.1. Commercial Crops
- 5.3.2. Fruits & Vegetables
- 5.3.3. Grains & Cereals
- 5.3.4. Pulses & Oilseeds
- 5.3.5. Turf & Ornamental
- 5.4. Market Analysis, Insights and Forecast - by Function
- 5.4.1. Fungicide
- 5.4.2. Herbicide
- 5.4.3. Insecticide
- 5.4.4. Molluscicide
- 5.4.5. Nematicide
- 5.5. Market Analysis, Insights and Forecast - by Application Mode
- 5.5.1. Chemigation
- 5.5.2. Foliar
- 5.5.3. Fumigation
- 5.5.4. Seed Treatment
- 5.5.5. Soil Treatment
- 5.6. Market Analysis, Insights and Forecast - by Crop Type
- 5.6.1. Commercial Crops
- 5.6.2. Fruits & Vegetables
- 5.6.3. Grains & Cereals
- 5.6.4. Pulses & Oilseeds
- 5.6.5. Turf & Ornamental
- 5.7. Market Analysis, Insights and Forecast - by Region
- 5.7.1. U.S.
- 5.1. Market Analysis, Insights and Forecast - by Function
- 6. Competitive Analysis
- 6.1. Market Share Analysis 2025
- 6.2. Company Profiles
- 6.2.1 Sumitomo Chemical Co Ltd
- 6.2.1.1. Overview
- 6.2.1.2. Products
- 6.2.1.3. SWOT Analysis
- 6.2.1.4. Recent Developments
- 6.2.1.5. Financials (Based on Availability)
- 6.2.2 American Vanguard Corporation
- 6.2.2.1. Overview
- 6.2.2.2. Products
- 6.2.2.3. SWOT Analysis
- 6.2.2.4. Recent Developments
- 6.2.2.5. Financials (Based on Availability)
- 6.2.3 ADAMA Agricultural Solutions Ltd
- 6.2.3.1. Overview
- 6.2.3.2. Products
- 6.2.3.3. SWOT Analysis
- 6.2.3.4. Recent Developments
- 6.2.3.5. Financials (Based on Availability)
- 6.2.4 Bayer AG
- 6.2.4.1. Overview
- 6.2.4.2. Products
- 6.2.4.3. SWOT Analysis
- 6.2.4.4. Recent Developments
- 6.2.4.5. Financials (Based on Availability)
- 6.2.5 Syngenta Group
- 6.2.5.1. Overview
- 6.2.5.2. Products
- 6.2.5.3. SWOT Analysis
- 6.2.5.4. Recent Developments
- 6.2.5.5. Financials (Based on Availability)
- 6.2.6 BASF SE
- 6.2.6.1. Overview
- 6.2.6.2. Products
- 6.2.6.3. SWOT Analysis
- 6.2.6.4. Recent Developments
- 6.2.6.5. Financials (Based on Availability)
- 6.2.7 FMC Corporation
- 6.2.7.1. Overview
- 6.2.7.2. Products
- 6.2.7.3. SWOT Analysis
- 6.2.7.4. Recent Developments
- 6.2.7.5. Financials (Based on Availability)
- 6.2.8 UPL Limite
- 6.2.8.1. Overview
- 6.2.8.2. Products
- 6.2.8.3. SWOT Analysis
- 6.2.8.4. Recent Developments
- 6.2.8.5. Financials (Based on Availability)
- 6.2.9 Corteva Agriscience
- 6.2.9.1. Overview
- 6.2.9.2. Products
- 6.2.9.3. SWOT Analysis
- 6.2.9.4. Recent Developments
- 6.2.9.5. Financials (Based on Availability)
- 6.2.10 Nufarm Ltd
- 6.2.10.1. Overview
- 6.2.10.2. Products
- 6.2.10.3. SWOT Analysis
- 6.2.10.4. Recent Developments
- 6.2.10.5. Financials (Based on Availability)
- 6.2.1 Sumitomo Chemical Co Ltd
List of Figures
- Figure 1: U.S. Crop Protection Chemicals Industry Revenue Breakdown (undefined, %) by Product 2025 & 2033
- Figure 2: U.S. Crop Protection Chemicals Industry Share (%) by Company 2025
List of Tables
- Table 1: U.S. Crop Protection Chemicals Industry Revenue undefined Forecast, by Function 2020 & 2033
- Table 2: U.S. Crop Protection Chemicals Industry Volume Kiloton Forecast, by Function 2020 & 2033
- Table 3: U.S. Crop Protection Chemicals Industry Revenue undefined Forecast, by Application Mode 2020 & 2033
- Table 4: U.S. Crop Protection Chemicals Industry Volume Kiloton Forecast, by Application Mode 2020 & 2033
- Table 5: U.S. Crop Protection Chemicals Industry Revenue undefined Forecast, by Crop Type 2020 & 2033
- Table 6: U.S. Crop Protection Chemicals Industry Volume Kiloton Forecast, by Crop Type 2020 & 2033
- Table 7: U.S. Crop Protection Chemicals Industry Revenue undefined Forecast, by Function 2020 & 2033
- Table 8: U.S. Crop Protection Chemicals Industry Volume Kiloton Forecast, by Function 2020 & 2033
- Table 9: U.S. Crop Protection Chemicals Industry Revenue undefined Forecast, by Application Mode 2020 & 2033
- Table 10: U.S. Crop Protection Chemicals Industry Volume Kiloton Forecast, by Application Mode 2020 & 2033
- Table 11: U.S. Crop Protection Chemicals Industry Revenue undefined Forecast, by Crop Type 2020 & 2033
- Table 12: U.S. Crop Protection Chemicals Industry Volume Kiloton Forecast, by Crop Type 2020 & 2033
- Table 13: U.S. Crop Protection Chemicals Industry Revenue undefined Forecast, by Region 2020 & 2033
- Table 14: U.S. Crop Protection Chemicals Industry Volume Kiloton Forecast, by Region 2020 & 2033
- Table 15: U.S. Crop Protection Chemicals Industry Revenue undefined Forecast, by Function 2020 & 2033
- Table 16: U.S. Crop Protection Chemicals Industry Volume Kiloton Forecast, by Function 2020 & 2033
- Table 17: U.S. Crop Protection Chemicals Industry Revenue undefined Forecast, by Application Mode 2020 & 2033
- Table 18: U.S. Crop Protection Chemicals Industry Volume Kiloton Forecast, by Application Mode 2020 & 2033
- Table 19: U.S. Crop Protection Chemicals Industry Revenue undefined Forecast, by Crop Type 2020 & 2033
- Table 20: U.S. Crop Protection Chemicals Industry Volume Kiloton Forecast, by Crop Type 2020 & 2033
- Table 21: U.S. Crop Protection Chemicals Industry Revenue undefined Forecast, by Function 2020 & 2033
- Table 22: U.S. Crop Protection Chemicals Industry Volume Kiloton Forecast, by Function 2020 & 2033
- Table 23: U.S. Crop Protection Chemicals Industry Revenue undefined Forecast, by Application Mode 2020 & 2033
- Table 24: U.S. Crop Protection Chemicals Industry Volume Kiloton Forecast, by Application Mode 2020 & 2033
- Table 25: U.S. Crop Protection Chemicals Industry Revenue undefined Forecast, by Crop Type 2020 & 2033
- Table 26: U.S. Crop Protection Chemicals Industry Volume Kiloton Forecast, by Crop Type 2020 & 2033
- Table 27: U.S. Crop Protection Chemicals Industry Revenue undefined Forecast, by Country 2020 & 2033
- Table 28: U.S. Crop Protection Chemicals Industry Volume Kiloton Forecast, by Country 2020 & 2033
Frequently Asked Questions
1. What is the projected Compound Annual Growth Rate (CAGR) of the U.S. Crop Protection Chemicals Industry?
The projected CAGR is approximately 5%.
2. Which companies are prominent players in the U.S. Crop Protection Chemicals Industry?
Key companies in the market include Sumitomo Chemical Co Ltd, American Vanguard Corporation, ADAMA Agricultural Solutions Ltd, Bayer AG, Syngenta Group, BASF SE, FMC Corporation, UPL Limite, Corteva Agriscience, Nufarm Ltd.
3. What are the main segments of the U.S. Crop Protection Chemicals Industry?
The market segments include Function, Application Mode, Crop Type, Function, Application Mode, Crop Type.
4. Can you provide details about the market size?
The market size is estimated to be USD XXX N/A as of 2022.
5. What are some drivers contributing to market growth?
Seed Treatment As A Solution To Enhance Yield; Growing Awareness For Seed Treatment Among The Farmers; Rising Trend Of Organic Farming.
6. What are the notable trends driving market growth?
Rise in weed infestations. shortage of labor. increased wages. and need for higher food production may drive the herbicide market in the country.
7. Are there any restraints impacting market growth?
Limitations Across Farm-Level Seed Treatment; Rising Environmental Concerns.
8. Can you provide examples of recent developments in the market?
April 2023: Nufarm launched a new liquid formulation fungicide, Tourney EZ, exclusively for turf and ornamental crops based on customer demand, which further strengthens the company's role in turf and ornamental crop protection.March 2023: AMVAC launched a portfolio of herbicides, including Impact Core and Sinate, to combat weed resistance in maize.January 2023: Bayer formed a new partnership with Oerth Bio to enhance crop protection technology and create more eco-friendly crop protection solutions.
9. What pricing options are available for accessing the report?
Pricing options include single-user, multi-user, and enterprise licenses priced at USD 3800, USD 4500, and USD 5800 respectively.
10. Is the market size provided in terms of value or volume?
The market size is provided in terms of value, measured in N/A and volume, measured in Kiloton.
11. Are there any specific market keywords associated with the report?
Yes, the market keyword associated with the report is "U.S. Crop Protection Chemicals Industry," which aids in identifying and referencing the specific market segment covered.
12. How do I determine which pricing option suits my needs best?
The pricing options vary based on user requirements and access needs. Individual users may opt for single-user licenses, while businesses requiring broader access may choose multi-user or enterprise licenses for cost-effective access to the report.
13. Are there any additional resources or data provided in the U.S. Crop Protection Chemicals Industry report?
While the report offers comprehensive insights, it's advisable to review the specific contents or supplementary materials provided to ascertain if additional resources or data are available.
14. How can I stay updated on further developments or reports in the U.S. Crop Protection Chemicals Industry?
To stay informed about further developments, trends, and reports in the U.S. Crop Protection Chemicals Industry, consider subscribing to industry newsletters, following relevant companies and organizations, or regularly checking reputable industry news sources and publications.
Methodology
Step 1 - Identification of Relevant Samples Size from Population Database


Step 2 - Approaches for Defining Global Market Size (Value, Volume* & Price*)

Note*: In applicable scenarios
Step 3 - Data Sources
Primary Research
- Web Analytics
- Survey Reports
- Research Institute
- Latest Research Reports
- Opinion Leaders
Secondary Research
- Annual Reports
- White Paper
- Latest Press Release
- Industry Association
- Paid Database
- Investor Presentations

Step 4 - Data Triangulation
Involves using different sources of information in order to increase the validity of a study
These sources are likely to be stakeholders in a program - participants, other researchers, program staff, other community members, and so on.
Then we put all data in single framework & apply various statistical tools to find out the dynamic on the market.
During the analysis stage, feedback from the stakeholder groups would be compared to determine areas of agreement as well as areas of divergence