

Key Insights
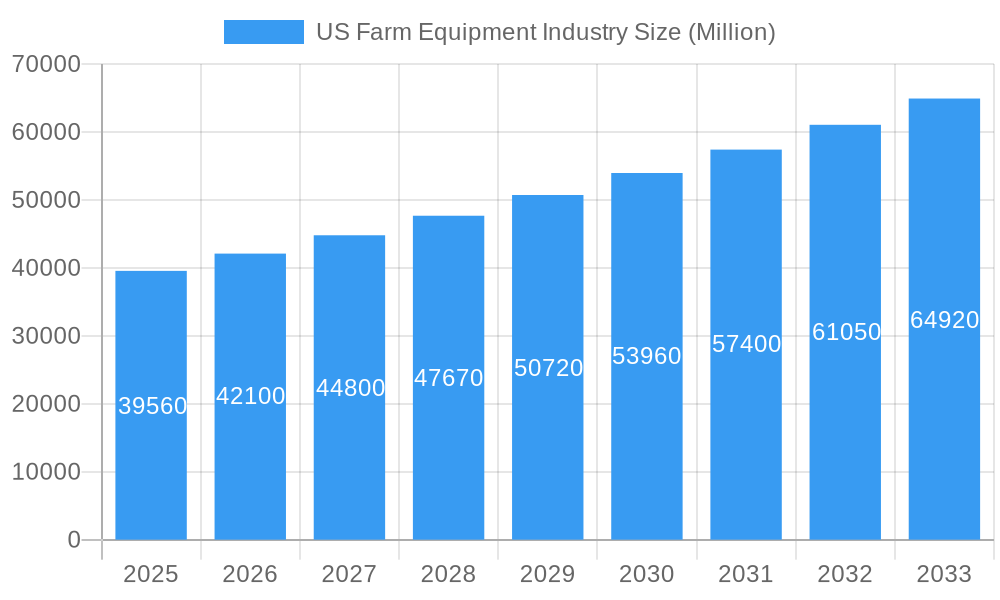
The US farm equipment industry, currently valued at $39.56 billion (2025), is projected to experience robust growth, exhibiting a Compound Annual Growth Rate (CAGR) of 6.30% from 2025 to 2033. This expansion is driven by several key factors. Technological advancements, such as precision agriculture technologies (GPS-guided machinery, automated systems), are enhancing efficiency and yield, leading to increased demand for sophisticated farm equipment. Furthermore, the growing global population necessitates increased food production, fueling investment in mechanized farming solutions. Government initiatives promoting sustainable agricultural practices and supporting farmers' adoption of modern equipment also contribute significantly to market growth. Regional variations exist; the Midwest, with its extensive agricultural lands, is expected to remain a dominant market segment. However, growth is anticipated across all regions, driven by increasing farm sizes and the adoption of advanced farming techniques in areas like the Southeast and Southwest.
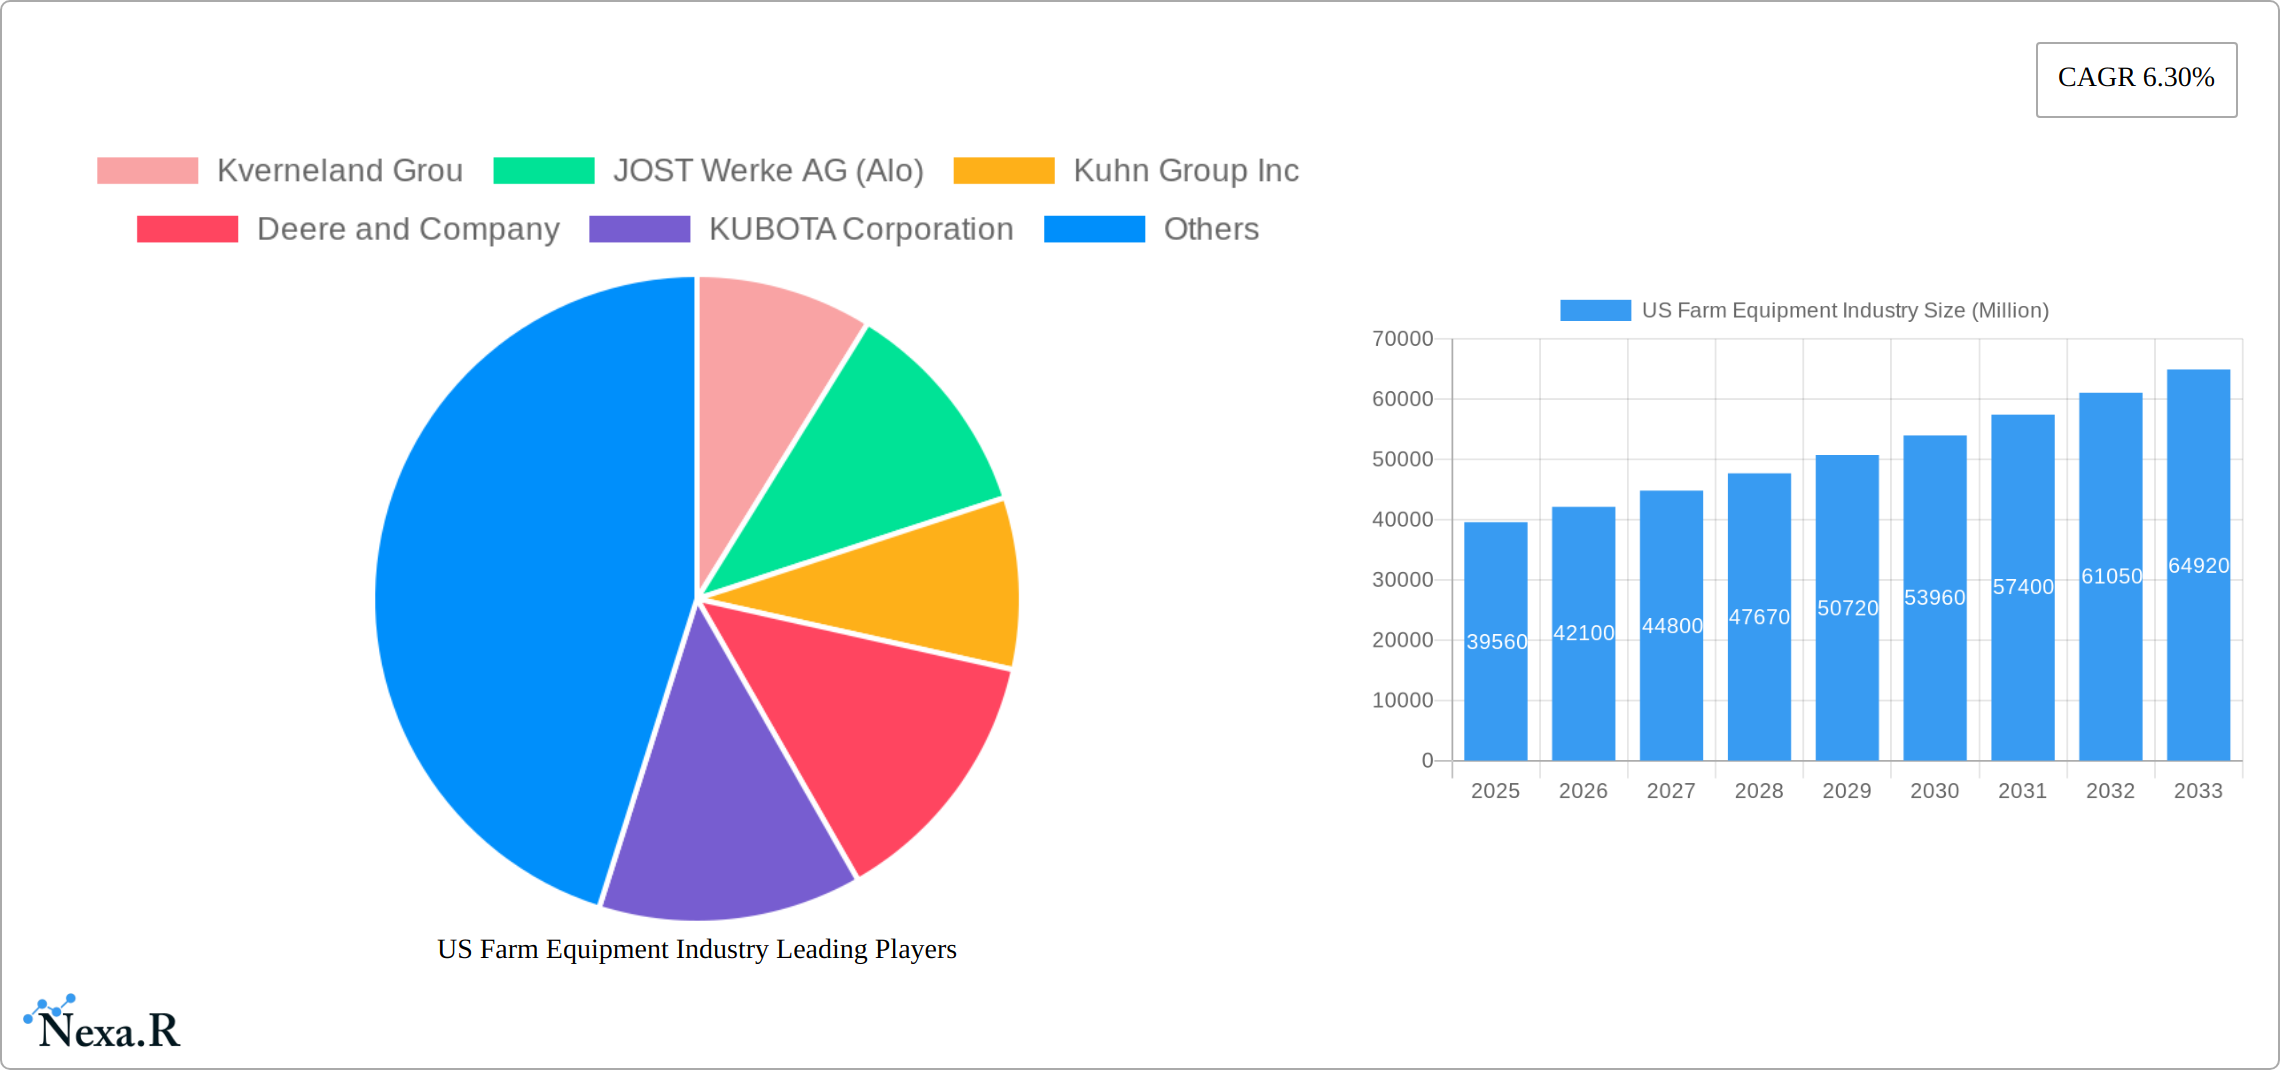
US Farm Equipment Industry Market Size (In Billion)
However, the industry faces certain challenges. Fluctuations in commodity prices and fuel costs can impact farmer investment decisions. Concerns around environmental sustainability and the potential impact of climate change also influence equipment choices, favoring more efficient and environmentally friendly machinery. Competition among established players like Deere & Company, AGCO Corporation, and CNH Industrial, along with emerging players offering cost-effective alternatives, keeps the market dynamic. The industry's future trajectory depends on successfully navigating these challenges while capitalizing on the opportunities presented by technological innovation and evolving agricultural practices. The continued integration of data analytics and the Internet of Things (IoT) within farm equipment will likely further drive market growth in the forecast period. This includes the development of smart tractors and connected farm management systems.
US Farm Equipment Industry Company Market Share
US Farm Equipment Industry Market Report: 2019-2033
This comprehensive report provides an in-depth analysis of the US farm equipment industry, encompassing market dynamics, growth trends, competitive landscape, and future outlook. The study period covers 2019-2033, with 2025 as the base year and a forecast period of 2025-2033. This report is essential for industry professionals, investors, and strategic decision-makers seeking to understand and capitalize on opportunities within this dynamic sector. The report analyzes the parent market (Agricultural Machinery) and its child market (Farm Equipment) for a holistic understanding.
US Farm Equipment Industry Market Dynamics & Structure
The US farm equipment market is characterized by a moderately concentrated landscape, where a few dominant players command a significant portion of market share. This concentration is a direct result of substantial capital investment, extensive R&D, and established distribution networks. A primary engine of growth is the relentless pace of technological innovation, particularly in the realm of precision agriculture and advanced automation. These advancements are reshaping how farms operate, boosting efficiency and sustainability. Furthermore, the industry navigates a complex web of stringent regulatory frameworks, encompassing emissions standards and safety mandates, which directly influence product design, manufacturing processes, and market access. While new equipment is at the forefront, competitive substitutes such as well-maintained used equipment and the adoption of alternative, less equipment-intensive farming practices, present ongoing challenges and opportunities for adaptation. The end-user demographic is evolving; while large-scale commercial farms remain the predominant customer base, there's a discernible and growing participation from smaller farms that are increasingly embracing advanced technologies to remain competitive. The market has also witnessed robust M&A activity, a clear indicator of ongoing consolidation, strategic integration of new technologies, and efforts to expand market reach and product portfolios.
- Market Concentration: Leading companies such as Deere & Company, CNH Industrial, and AGCO Corporation collectively hold an estimated market share of approximately 70-75%, underscoring a moderately concentrated market structure.
- Technological Innovation: Key innovation drivers include the widespread adoption of precision farming technologies like GPS-guided machinery, variable rate application systems, and increasingly sophisticated automation features, all aimed at enhancing operational efficiency, optimizing resource utilization, and boosting overall farm productivity.
- Regulatory Framework: Compliance with Environmental Protection Agency (EPA) emission standards and rigorous safety regulations significantly impacts the design, manufacturing, and certification of agricultural equipment.
- Competitive Substitutes: The market faces competition from the readily available used equipment sector, which offers cost-effective solutions, as well as the growing trend of adopting alternative farming methods that may require less specialized machinery.
- End-User Demographics: While large commercial farms continue to represent the largest segment of end-users, a notable trend is the increasing adoption of advanced technologies by smaller and medium-sized farms seeking to improve their operational efficiency and competitiveness.
- M&A Activity: The period between 2019 and 2024 has seen significant merger and acquisition activity, with approximately 15-20 key deals, primarily driven by the strategic imperative to integrate cutting-edge technologies, expand product offerings, and consolidate market presence.
US Farm Equipment Industry Growth Trends & Insights
The US farm equipment market experienced significant growth during the historical period (2019-2024), driven by factors such as increasing agricultural production, technological advancements, and government support programs. The market size is projected to reach xx million units by 2025, expanding at a CAGR of xx% during the forecast period (2025-2033). Adoption rates of precision farming technologies are steadily increasing, particularly among large-scale farms. Technological disruptions, including automation and data analytics, are transforming farming practices and boosting efficiency. Consumer behavior shifts toward sustainable and environmentally friendly farming practices are influencing equipment demand.
(Note: This section requires XXX data to be populated with specific metrics and detailed analysis based on the available data. This placeholder indicates where the detailed analysis should be inserted.)
Dominant Regions, Countries, or Segments in US Farm Equipment Industry
The Midwest region of the US dominates the farm equipment market due to its extensive agricultural land and high crop production. Within segments, the Harvesting Machinery segment (particularly combine harvesters) exhibits the highest growth potential, driven by the need for efficient grain harvesting. Planting Machinery also shows significant growth due to precision planting technologies.
- Key Drivers:
- Favorable government policies supporting agricultural development.
- Robust agricultural infrastructure.
- High crop yields and production volumes.
- Increasing adoption of precision agriculture technologies.
- Dominance Factors:
- High concentration of large-scale farms.
- Extensive arable land suitable for mechanized farming.
- Well-developed agricultural supply chains.
US Farm Equipment Industry Product Landscape
The US farm equipment market boasts an extensive and diverse product portfolio, spanning from foundational tillage and planting implements to highly specialized, automated harvesting systems. The industry's recent trajectory is marked by a strong focus on innovations that enhance efficiency, precision, and sustainability across all farming operations. Products are increasingly differentiated by advanced features such as integrated GPS guidance, sophisticated automation capabilities, seamless data connectivity, and intelligent machine-to-machine communication. The key selling propositions for these modern machines revolve around demonstrably increasing crop yields, significantly reducing operational costs through optimized resource management, and contributing to improved environmental stewardship. Underlying this continuous product evolution are rapid advancements in fields like robotics, artificial intelligence (AI), and sensor technologies, which are collectively driving the development of next-generation agricultural machinery designed for the demands of modern, data-driven farming.
Key Drivers, Barriers & Challenges in US Farm Equipment Industry
Key Drivers:
- The escalating global demand for more efficient, sustainable, and yield-maximizing farming practices to feed a growing population.
- Rapid technological advancements in precision agriculture, including sensor technology, data analytics, and automation, which offer significant improvements in productivity and resource management.
- Continued government support through various programs, subsidies, and incentives aimed at modernizing agricultural operations and promoting the adoption of advanced equipment.
Key Challenges & Restraints:
- Persistent supply chain disruptions, including raw material shortages and logistical bottlenecks, which can impact equipment availability, lead times, and overall cost.
- The increasing stringency of environmental regulations, which can necessitate substantial investments in research, development, and manufacturing to ensure compliance, thereby raising production costs.
- Intense competition from both well-established global manufacturers and agile emerging players, characterized by aggressive pricing strategies and a constant drive to innovate and introduce disruptive technologies, which can lead to compressed profit margins for established companies.
Emerging Opportunities in US Farm Equipment Industry
- Growing adoption of data-driven farming techniques.
- Increasing demand for autonomous and robotic equipment.
- Expansion into niche markets like organic farming and vertical agriculture.
Growth Accelerators in the US Farm Equipment Industry
The US farm equipment industry's growth is significantly propelled by technological breakthroughs in areas such as fully autonomous operation, AI-driven decision-making support systems, and highly advanced precision farming technologies. The formation of strategic partnerships between leading equipment manufacturers and innovative technology providers is a crucial catalyst, fostering a collaborative environment for accelerated development and market penetration. Furthermore, the proactive expansion into global markets, coupled with the agile adaptation of product offerings to suit diverse regional farming practices and environmental conditions, represents key strategies for sustained growth and market leadership.
Key Players Shaping the US Farm Equipment Industry Market
- Kverneland Group
- JOST Werke AG (Alo)
- Kuhn Group Inc
- Deere and Company
- KUBOTA Corporation
- CNH Industrial
- Farmtrac Tractor Europe
- AGCO Corporation
- Deutz-Fahr
- Mahindra Agriculture North America
- Claas KGaA mbH
Notable Milestones in US Farm Equipment Industry Sector
- December 2022: CNH Industrial launched new automation and autonomy solutions, enhancing productivity and addressing farmer challenges.
- May 2022: AGCO acquired JCA Industries, boosting engineering and software development for automated machines.
- April 2022: Deere & Company and GUSS Automation formed a joint venture for semi-autonomous sprayers.
In-Depth US Farm Equipment Industry Market Outlook
The US farm equipment market is poised for sustained growth, driven by technological innovation, increasing adoption of precision farming techniques, and the growing need for efficient and sustainable agricultural practices. Strategic partnerships and investments in research and development will further fuel market expansion, presenting significant opportunities for companies across the value chain. The market is expected to witness further consolidation, with larger players acquiring smaller companies to expand their product portfolio and technological capabilities.
US Farm Equipment Industry Segmentation
- 1. Production Analysis
- 2. Consumption Analysis
- 3. Import Market Analysis (Value & Volume)
- 4. Export Market Analysis (Value & Volume)
- 5. Price Trend Analysis
US Farm Equipment Industry Segmentation By Geography
-
1. North America
- 1.1. United States
- 1.2. Canada
- 1.3. Mexico
-
2. South America
- 2.1. Brazil
- 2.2. Argentina
- 2.3. Rest of South America
-
3. Europe
- 3.1. United Kingdom
- 3.2. Germany
- 3.3. France
- 3.4. Italy
- 3.5. Spain
- 3.6. Russia
- 3.7. Benelux
- 3.8. Nordics
- 3.9. Rest of Europe
-
4. Middle East & Africa
- 4.1. Turkey
- 4.2. Israel
- 4.3. GCC
- 4.4. North Africa
- 4.5. South Africa
- 4.6. Rest of Middle East & Africa
-
5. Asia Pacific
- 5.1. China
- 5.2. India
- 5.3. Japan
- 5.4. South Korea
- 5.5. ASEAN
- 5.6. Oceania
- 5.7. Rest of Asia Pacific
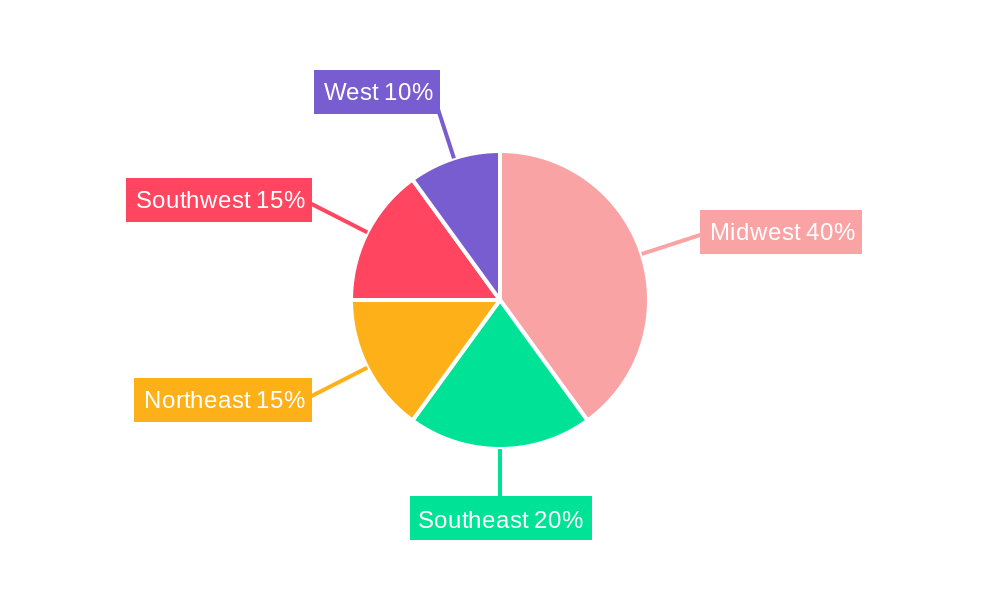
US Farm Equipment Industry Regional Market Share
Geographic Coverage of US Farm Equipment Industry
US Farm Equipment Industry REPORT HIGHLIGHTS
| Aspects | Details |
|---|---|
| Study Period | 2020-2034 |
| Base Year | 2025 |
| Estimated Year | 2026 |
| Forecast Period | 2026-2034 |
| Historical Period | 2020-2025 |
| Growth Rate | CAGR of 6.30% from 2020-2034 |
| Segmentation |
|
Table of Contents
- 1. Introduction
- 1.1. Research Scope
- 1.2. Market Segmentation
- 1.3. Research Objective
- 1.4. Definitions and Assumptions
- 2. Executive Summary
- 2.1. Market Snapshot
- 3. Market Dynamics
- 3.1. Market Drivers
- 3.2. Market Restrains
- 3.3. Market Trends
- 3.4. Market Opportunities
- 4. Market Factor Analysis
- 4.1. Porters Five Forces
- 4.1.1. Bargaining Power of Suppliers
- 4.1.2. Bargaining Power of Buyers
- 4.1.3. Threat of New Entrants
- 4.1.4. Threat of Substitutes
- 4.1.5. Competitive Rivalry
- 4.2. PESTEL analysis
- 4.3. BCG Analysis
- 4.3.1. Stars (High Growth, High Market Share)
- 4.3.2. Cash Cows (Low Growth, High Market Share)
- 4.3.3. Question Mark (High Growth, Low Market Share)
- 4.3.4. Dogs (Low Growth, Low Market Share)
- 4.4. Ansoff Matrix Analysis
- 4.5. Supply Chain Analysis
- 4.6. Regulatory Landscape
- 4.7. Current Market Potential and Opportunity Assessment (TAM–SAM–SOM Framework)
- 4.8. NRP Analyst Note
- 4.1. Porters Five Forces
- 5. Market Analysis, Insights and Forecast 2021-2033
- 5.1. Market Analysis, Insights and Forecast - by Production Analysis
- 5.2. Market Analysis, Insights and Forecast - by Consumption Analysis
- 5.3. Market Analysis, Insights and Forecast - by Import Market Analysis (Value & Volume)
- 5.4. Market Analysis, Insights and Forecast - by Export Market Analysis (Value & Volume)
- 5.5. Market Analysis, Insights and Forecast - by Price Trend Analysis
- 5.6. Market Analysis, Insights and Forecast - by Region
- 5.6.1. North America
- 5.6.2. South America
- 5.6.3. Europe
- 5.6.4. Middle East & Africa
- 5.6.5. Asia Pacific
- 6. Global US Farm Equipment Industry Analysis, Insights and Forecast, 2021-2033
- 6.1. Market Analysis, Insights and Forecast - by Production Analysis
- 6.2. Market Analysis, Insights and Forecast - by Consumption Analysis
- 6.3. Market Analysis, Insights and Forecast - by Import Market Analysis (Value & Volume)
- 6.4. Market Analysis, Insights and Forecast - by Export Market Analysis (Value & Volume)
- 6.5. Market Analysis, Insights and Forecast - by Price Trend Analysis
- 7. North America US Farm Equipment Industry Analysis, Insights and Forecast, 2020-2032
- 7.1. Market Analysis, Insights and Forecast - by Production Analysis
- 7.2. Market Analysis, Insights and Forecast - by Consumption Analysis
- 7.3. Market Analysis, Insights and Forecast - by Import Market Analysis (Value & Volume)
- 7.4. Market Analysis, Insights and Forecast - by Export Market Analysis (Value & Volume)
- 7.5. Market Analysis, Insights and Forecast - by Price Trend Analysis
- 8. South America US Farm Equipment Industry Analysis, Insights and Forecast, 2020-2032
- 8.1. Market Analysis, Insights and Forecast - by Production Analysis
- 8.2. Market Analysis, Insights and Forecast - by Consumption Analysis
- 8.3. Market Analysis, Insights and Forecast - by Import Market Analysis (Value & Volume)
- 8.4. Market Analysis, Insights and Forecast - by Export Market Analysis (Value & Volume)
- 8.5. Market Analysis, Insights and Forecast - by Price Trend Analysis
- 9. Europe US Farm Equipment Industry Analysis, Insights and Forecast, 2020-2032
- 9.1. Market Analysis, Insights and Forecast - by Production Analysis
- 9.2. Market Analysis, Insights and Forecast - by Consumption Analysis
- 9.3. Market Analysis, Insights and Forecast - by Import Market Analysis (Value & Volume)
- 9.4. Market Analysis, Insights and Forecast - by Export Market Analysis (Value & Volume)
- 9.5. Market Analysis, Insights and Forecast - by Price Trend Analysis
- 10. Middle East & Africa US Farm Equipment Industry Analysis, Insights and Forecast, 2020-2032
- 10.1. Market Analysis, Insights and Forecast - by Production Analysis
- 10.2. Market Analysis, Insights and Forecast - by Consumption Analysis
- 10.3. Market Analysis, Insights and Forecast - by Import Market Analysis (Value & Volume)
- 10.4. Market Analysis, Insights and Forecast - by Export Market Analysis (Value & Volume)
- 10.5. Market Analysis, Insights and Forecast - by Price Trend Analysis
- 11. Asia Pacific US Farm Equipment Industry Analysis, Insights and Forecast, 2020-2032
- 11.1. Market Analysis, Insights and Forecast - by Production Analysis
- 11.2. Market Analysis, Insights and Forecast - by Consumption Analysis
- 11.3. Market Analysis, Insights and Forecast - by Import Market Analysis (Value & Volume)
- 11.4. Market Analysis, Insights and Forecast - by Export Market Analysis (Value & Volume)
- 11.5. Market Analysis, Insights and Forecast - by Price Trend Analysis
- 12. Competitive Analysis
- 12.1. Company Profiles
- 12.1.1 Kverneland Grou
- 12.1.1.1. Company Overview
- 12.1.1.2. Products
- 12.1.1.3. Company Financials
- 12.1.1.4. SWOT Analysis
- 12.1.2 JOST Werke AG (Alo)
- 12.1.2.1. Company Overview
- 12.1.2.2. Products
- 12.1.2.3. Company Financials
- 12.1.2.4. SWOT Analysis
- 12.1.3 Kuhn Group Inc
- 12.1.3.1. Company Overview
- 12.1.3.2. Products
- 12.1.3.3. Company Financials
- 12.1.3.4. SWOT Analysis
- 12.1.4 Deere and Company
- 12.1.4.1. Company Overview
- 12.1.4.2. Products
- 12.1.4.3. Company Financials
- 12.1.4.4. SWOT Analysis
- 12.1.5 KUBOTA Corporation
- 12.1.5.1. Company Overview
- 12.1.5.2. Products
- 12.1.5.3. Company Financials
- 12.1.5.4. SWOT Analysis
- 12.1.6 CNH Industrial
- 12.1.6.1. Company Overview
- 12.1.6.2. Products
- 12.1.6.3. Company Financials
- 12.1.6.4. SWOT Analysis
- 12.1.7 Farmtrac Tractor Europe
- 12.1.7.1. Company Overview
- 12.1.7.2. Products
- 12.1.7.3. Company Financials
- 12.1.7.4. SWOT Analysis
- 12.1.8 AGCO Corporation
- 12.1.8.1. Company Overview
- 12.1.8.2. Products
- 12.1.8.3. Company Financials
- 12.1.8.4. SWOT Analysis
- 12.1.9 Deutz-Fahr
- 12.1.9.1. Company Overview
- 12.1.9.2. Products
- 12.1.9.3. Company Financials
- 12.1.9.4. SWOT Analysis
- 12.1.10 Mahindra Agriculture North America
- 12.1.10.1. Company Overview
- 12.1.10.2. Products
- 12.1.10.3. Company Financials
- 12.1.10.4. SWOT Analysis
- 12.1.11 Claas KGaA mbH
- 12.1.11.1. Company Overview
- 12.1.11.2. Products
- 12.1.11.3. Company Financials
- 12.1.11.4. SWOT Analysis
- 12.1.1 Kverneland Grou
- 12.2. Market Entropy
- 12.2.1 Company's Key Areas Served
- 12.2.2 Recent Developments
- 12.3. Company Market Share Analysis 2025
- 12.3.1 Top 5 Companies Market Share Analysis
- 12.3.2 Top 3 Companies Market Share Analysis
- 12.4. List of Potential Customers
- 13. Research Methodology
List of Figures
- Figure 1: Global US Farm Equipment Industry Revenue Breakdown (Million, %) by Region 2025 & 2033
- Figure 2: North America US Farm Equipment Industry Revenue (Million), by Production Analysis 2025 & 2033
- Figure 3: North America US Farm Equipment Industry Revenue Share (%), by Production Analysis 2025 & 2033
- Figure 4: North America US Farm Equipment Industry Revenue (Million), by Consumption Analysis 2025 & 2033
- Figure 5: North America US Farm Equipment Industry Revenue Share (%), by Consumption Analysis 2025 & 2033
- Figure 6: North America US Farm Equipment Industry Revenue (Million), by Import Market Analysis (Value & Volume) 2025 & 2033
- Figure 7: North America US Farm Equipment Industry Revenue Share (%), by Import Market Analysis (Value & Volume) 2025 & 2033
- Figure 8: North America US Farm Equipment Industry Revenue (Million), by Export Market Analysis (Value & Volume) 2025 & 2033
- Figure 9: North America US Farm Equipment Industry Revenue Share (%), by Export Market Analysis (Value & Volume) 2025 & 2033
- Figure 10: North America US Farm Equipment Industry Revenue (Million), by Price Trend Analysis 2025 & 2033
- Figure 11: North America US Farm Equipment Industry Revenue Share (%), by Price Trend Analysis 2025 & 2033
- Figure 12: North America US Farm Equipment Industry Revenue (Million), by Country 2025 & 2033
- Figure 13: North America US Farm Equipment Industry Revenue Share (%), by Country 2025 & 2033
- Figure 14: South America US Farm Equipment Industry Revenue (Million), by Production Analysis 2025 & 2033
- Figure 15: South America US Farm Equipment Industry Revenue Share (%), by Production Analysis 2025 & 2033
- Figure 16: South America US Farm Equipment Industry Revenue (Million), by Consumption Analysis 2025 & 2033
- Figure 17: South America US Farm Equipment Industry Revenue Share (%), by Consumption Analysis 2025 & 2033
- Figure 18: South America US Farm Equipment Industry Revenue (Million), by Import Market Analysis (Value & Volume) 2025 & 2033
- Figure 19: South America US Farm Equipment Industry Revenue Share (%), by Import Market Analysis (Value & Volume) 2025 & 2033
- Figure 20: South America US Farm Equipment Industry Revenue (Million), by Export Market Analysis (Value & Volume) 2025 & 2033
- Figure 21: South America US Farm Equipment Industry Revenue Share (%), by Export Market Analysis (Value & Volume) 2025 & 2033
- Figure 22: South America US Farm Equipment Industry Revenue (Million), by Price Trend Analysis 2025 & 2033
- Figure 23: South America US Farm Equipment Industry Revenue Share (%), by Price Trend Analysis 2025 & 2033
- Figure 24: South America US Farm Equipment Industry Revenue (Million), by Country 2025 & 2033
- Figure 25: South America US Farm Equipment Industry Revenue Share (%), by Country 2025 & 2033
- Figure 26: Europe US Farm Equipment Industry Revenue (Million), by Production Analysis 2025 & 2033
- Figure 27: Europe US Farm Equipment Industry Revenue Share (%), by Production Analysis 2025 & 2033
- Figure 28: Europe US Farm Equipment Industry Revenue (Million), by Consumption Analysis 2025 & 2033
- Figure 29: Europe US Farm Equipment Industry Revenue Share (%), by Consumption Analysis 2025 & 2033
- Figure 30: Europe US Farm Equipment Industry Revenue (Million), by Import Market Analysis (Value & Volume) 2025 & 2033
- Figure 31: Europe US Farm Equipment Industry Revenue Share (%), by Import Market Analysis (Value & Volume) 2025 & 2033
- Figure 32: Europe US Farm Equipment Industry Revenue (Million), by Export Market Analysis (Value & Volume) 2025 & 2033
- Figure 33: Europe US Farm Equipment Industry Revenue Share (%), by Export Market Analysis (Value & Volume) 2025 & 2033
- Figure 34: Europe US Farm Equipment Industry Revenue (Million), by Price Trend Analysis 2025 & 2033
- Figure 35: Europe US Farm Equipment Industry Revenue Share (%), by Price Trend Analysis 2025 & 2033
- Figure 36: Europe US Farm Equipment Industry Revenue (Million), by Country 2025 & 2033
- Figure 37: Europe US Farm Equipment Industry Revenue Share (%), by Country 2025 & 2033
- Figure 38: Middle East & Africa US Farm Equipment Industry Revenue (Million), by Production Analysis 2025 & 2033
- Figure 39: Middle East & Africa US Farm Equipment Industry Revenue Share (%), by Production Analysis 2025 & 2033
- Figure 40: Middle East & Africa US Farm Equipment Industry Revenue (Million), by Consumption Analysis 2025 & 2033
- Figure 41: Middle East & Africa US Farm Equipment Industry Revenue Share (%), by Consumption Analysis 2025 & 2033
- Figure 42: Middle East & Africa US Farm Equipment Industry Revenue (Million), by Import Market Analysis (Value & Volume) 2025 & 2033
- Figure 43: Middle East & Africa US Farm Equipment Industry Revenue Share (%), by Import Market Analysis (Value & Volume) 2025 & 2033
- Figure 44: Middle East & Africa US Farm Equipment Industry Revenue (Million), by Export Market Analysis (Value & Volume) 2025 & 2033
- Figure 45: Middle East & Africa US Farm Equipment Industry Revenue Share (%), by Export Market Analysis (Value & Volume) 2025 & 2033
- Figure 46: Middle East & Africa US Farm Equipment Industry Revenue (Million), by Price Trend Analysis 2025 & 2033
- Figure 47: Middle East & Africa US Farm Equipment Industry Revenue Share (%), by Price Trend Analysis 2025 & 2033
- Figure 48: Middle East & Africa US Farm Equipment Industry Revenue (Million), by Country 2025 & 2033
- Figure 49: Middle East & Africa US Farm Equipment Industry Revenue Share (%), by Country 2025 & 2033
- Figure 50: Asia Pacific US Farm Equipment Industry Revenue (Million), by Production Analysis 2025 & 2033
- Figure 51: Asia Pacific US Farm Equipment Industry Revenue Share (%), by Production Analysis 2025 & 2033
- Figure 52: Asia Pacific US Farm Equipment Industry Revenue (Million), by Consumption Analysis 2025 & 2033
- Figure 53: Asia Pacific US Farm Equipment Industry Revenue Share (%), by Consumption Analysis 2025 & 2033
- Figure 54: Asia Pacific US Farm Equipment Industry Revenue (Million), by Import Market Analysis (Value & Volume) 2025 & 2033
- Figure 55: Asia Pacific US Farm Equipment Industry Revenue Share (%), by Import Market Analysis (Value & Volume) 2025 & 2033
- Figure 56: Asia Pacific US Farm Equipment Industry Revenue (Million), by Export Market Analysis (Value & Volume) 2025 & 2033
- Figure 57: Asia Pacific US Farm Equipment Industry Revenue Share (%), by Export Market Analysis (Value & Volume) 2025 & 2033
- Figure 58: Asia Pacific US Farm Equipment Industry Revenue (Million), by Price Trend Analysis 2025 & 2033
- Figure 59: Asia Pacific US Farm Equipment Industry Revenue Share (%), by Price Trend Analysis 2025 & 2033
- Figure 60: Asia Pacific US Farm Equipment Industry Revenue (Million), by Country 2025 & 2033
- Figure 61: Asia Pacific US Farm Equipment Industry Revenue Share (%), by Country 2025 & 2033
List of Tables
- Table 1: Global US Farm Equipment Industry Revenue Million Forecast, by Production Analysis 2020 & 2033
- Table 2: Global US Farm Equipment Industry Revenue Million Forecast, by Consumption Analysis 2020 & 2033
- Table 3: Global US Farm Equipment Industry Revenue Million Forecast, by Import Market Analysis (Value & Volume) 2020 & 2033
- Table 4: Global US Farm Equipment Industry Revenue Million Forecast, by Export Market Analysis (Value & Volume) 2020 & 2033
- Table 5: Global US Farm Equipment Industry Revenue Million Forecast, by Price Trend Analysis 2020 & 2033
- Table 6: Global US Farm Equipment Industry Revenue Million Forecast, by Region 2020 & 2033
- Table 7: Global US Farm Equipment Industry Revenue Million Forecast, by Production Analysis 2020 & 2033
- Table 8: Global US Farm Equipment Industry Revenue Million Forecast, by Consumption Analysis 2020 & 2033
- Table 9: Global US Farm Equipment Industry Revenue Million Forecast, by Import Market Analysis (Value & Volume) 2020 & 2033
- Table 10: Global US Farm Equipment Industry Revenue Million Forecast, by Export Market Analysis (Value & Volume) 2020 & 2033
- Table 11: Global US Farm Equipment Industry Revenue Million Forecast, by Price Trend Analysis 2020 & 2033
- Table 12: Global US Farm Equipment Industry Revenue Million Forecast, by Country 2020 & 2033
- Table 13: United States US Farm Equipment Industry Revenue (Million) Forecast, by Application 2020 & 2033
- Table 14: Canada US Farm Equipment Industry Revenue (Million) Forecast, by Application 2020 & 2033
- Table 15: Mexico US Farm Equipment Industry Revenue (Million) Forecast, by Application 2020 & 2033
- Table 16: Global US Farm Equipment Industry Revenue Million Forecast, by Production Analysis 2020 & 2033
- Table 17: Global US Farm Equipment Industry Revenue Million Forecast, by Consumption Analysis 2020 & 2033
- Table 18: Global US Farm Equipment Industry Revenue Million Forecast, by Import Market Analysis (Value & Volume) 2020 & 2033
- Table 19: Global US Farm Equipment Industry Revenue Million Forecast, by Export Market Analysis (Value & Volume) 2020 & 2033
- Table 20: Global US Farm Equipment Industry Revenue Million Forecast, by Price Trend Analysis 2020 & 2033
- Table 21: Global US Farm Equipment Industry Revenue Million Forecast, by Country 2020 & 2033
- Table 22: Brazil US Farm Equipment Industry Revenue (Million) Forecast, by Application 2020 & 2033
- Table 23: Argentina US Farm Equipment Industry Revenue (Million) Forecast, by Application 2020 & 2033
- Table 24: Rest of South America US Farm Equipment Industry Revenue (Million) Forecast, by Application 2020 & 2033
- Table 25: Global US Farm Equipment Industry Revenue Million Forecast, by Production Analysis 2020 & 2033
- Table 26: Global US Farm Equipment Industry Revenue Million Forecast, by Consumption Analysis 2020 & 2033
- Table 27: Global US Farm Equipment Industry Revenue Million Forecast, by Import Market Analysis (Value & Volume) 2020 & 2033
- Table 28: Global US Farm Equipment Industry Revenue Million Forecast, by Export Market Analysis (Value & Volume) 2020 & 2033
- Table 29: Global US Farm Equipment Industry Revenue Million Forecast, by Price Trend Analysis 2020 & 2033
- Table 30: Global US Farm Equipment Industry Revenue Million Forecast, by Country 2020 & 2033
- Table 31: United Kingdom US Farm Equipment Industry Revenue (Million) Forecast, by Application 2020 & 2033
- Table 32: Germany US Farm Equipment Industry Revenue (Million) Forecast, by Application 2020 & 2033
- Table 33: France US Farm Equipment Industry Revenue (Million) Forecast, by Application 2020 & 2033
- Table 34: Italy US Farm Equipment Industry Revenue (Million) Forecast, by Application 2020 & 2033
- Table 35: Spain US Farm Equipment Industry Revenue (Million) Forecast, by Application 2020 & 2033
- Table 36: Russia US Farm Equipment Industry Revenue (Million) Forecast, by Application 2020 & 2033
- Table 37: Benelux US Farm Equipment Industry Revenue (Million) Forecast, by Application 2020 & 2033
- Table 38: Nordics US Farm Equipment Industry Revenue (Million) Forecast, by Application 2020 & 2033
- Table 39: Rest of Europe US Farm Equipment Industry Revenue (Million) Forecast, by Application 2020 & 2033
- Table 40: Global US Farm Equipment Industry Revenue Million Forecast, by Production Analysis 2020 & 2033
- Table 41: Global US Farm Equipment Industry Revenue Million Forecast, by Consumption Analysis 2020 & 2033
- Table 42: Global US Farm Equipment Industry Revenue Million Forecast, by Import Market Analysis (Value & Volume) 2020 & 2033
- Table 43: Global US Farm Equipment Industry Revenue Million Forecast, by Export Market Analysis (Value & Volume) 2020 & 2033
- Table 44: Global US Farm Equipment Industry Revenue Million Forecast, by Price Trend Analysis 2020 & 2033
- Table 45: Global US Farm Equipment Industry Revenue Million Forecast, by Country 2020 & 2033
- Table 46: Turkey US Farm Equipment Industry Revenue (Million) Forecast, by Application 2020 & 2033
- Table 47: Israel US Farm Equipment Industry Revenue (Million) Forecast, by Application 2020 & 2033
- Table 48: GCC US Farm Equipment Industry Revenue (Million) Forecast, by Application 2020 & 2033
- Table 49: North Africa US Farm Equipment Industry Revenue (Million) Forecast, by Application 2020 & 2033
- Table 50: South Africa US Farm Equipment Industry Revenue (Million) Forecast, by Application 2020 & 2033
- Table 51: Rest of Middle East & Africa US Farm Equipment Industry Revenue (Million) Forecast, by Application 2020 & 2033
- Table 52: Global US Farm Equipment Industry Revenue Million Forecast, by Production Analysis 2020 & 2033
- Table 53: Global US Farm Equipment Industry Revenue Million Forecast, by Consumption Analysis 2020 & 2033
- Table 54: Global US Farm Equipment Industry Revenue Million Forecast, by Import Market Analysis (Value & Volume) 2020 & 2033
- Table 55: Global US Farm Equipment Industry Revenue Million Forecast, by Export Market Analysis (Value & Volume) 2020 & 2033
- Table 56: Global US Farm Equipment Industry Revenue Million Forecast, by Price Trend Analysis 2020 & 2033
- Table 57: Global US Farm Equipment Industry Revenue Million Forecast, by Country 2020 & 2033
- Table 58: China US Farm Equipment Industry Revenue (Million) Forecast, by Application 2020 & 2033
- Table 59: India US Farm Equipment Industry Revenue (Million) Forecast, by Application 2020 & 2033
- Table 60: Japan US Farm Equipment Industry Revenue (Million) Forecast, by Application 2020 & 2033
- Table 61: South Korea US Farm Equipment Industry Revenue (Million) Forecast, by Application 2020 & 2033
- Table 62: ASEAN US Farm Equipment Industry Revenue (Million) Forecast, by Application 2020 & 2033
- Table 63: Oceania US Farm Equipment Industry Revenue (Million) Forecast, by Application 2020 & 2033
- Table 64: Rest of Asia Pacific US Farm Equipment Industry Revenue (Million) Forecast, by Application 2020 & 2033
Frequently Asked Questions
1. What is the projected Compound Annual Growth Rate (CAGR) of the US Farm Equipment Industry?
The projected CAGR is approximately 6.30%.
2. Which companies are prominent players in the US Farm Equipment Industry?
Key companies in the market include Kverneland Grou, JOST Werke AG (Alo), Kuhn Group Inc, Deere and Company, KUBOTA Corporation, CNH Industrial, Farmtrac Tractor Europe, AGCO Corporation, Deutz-Fahr, Mahindra Agriculture North America, Claas KGaA mbH.
3. What are the main segments of the US Farm Equipment Industry?
The market segments include Production Analysis, Consumption Analysis, Import Market Analysis (Value & Volume), Export Market Analysis (Value & Volume), Price Trend Analysis.
4. Can you provide details about the market size?
The market size is estimated to be USD 39.56 Million as of 2022.
5. What are some drivers contributing to market growth?
Low Availability of Skilled Labor; Technological Advancements.
6. What are the notable trends driving market growth?
Increasing Average Farm Size.
7. Are there any restraints impacting market growth?
Increasing Farm Expenditure; Security Concerns in Modern Farming Machinery.
8. Can you provide examples of recent developments in the market?
December 2022: CNH Industrial added new Automation and Autonomy Solutions to the Ag Tech portfolio in Phoenix, Arizona, and the USA. These New Driverless Tillage and Driver Assist Harvest solutions from Raven, and Baler Automation from Case IH and New Holland, can deliver automation and autonomous equipment enhancements and help solve farmers' most significant challenges to increasing productivity.
9. What pricing options are available for accessing the report?
Pricing options include single-user, multi-user, and enterprise licenses priced at USD 3800, USD 4500, and USD 5800 respectively.
10. Is the market size provided in terms of value or volume?
The market size is provided in terms of value, measured in Million.
11. Are there any specific market keywords associated with the report?
Yes, the market keyword associated with the report is "US Farm Equipment Industry," which aids in identifying and referencing the specific market segment covered.
12. How do I determine which pricing option suits my needs best?
The pricing options vary based on user requirements and access needs. Individual users may opt for single-user licenses, while businesses requiring broader access may choose multi-user or enterprise licenses for cost-effective access to the report.
13. Are there any additional resources or data provided in the US Farm Equipment Industry report?
While the report offers comprehensive insights, it's advisable to review the specific contents or supplementary materials provided to ascertain if additional resources or data are available.
14. How can I stay updated on further developments or reports in the US Farm Equipment Industry?
To stay informed about further developments, trends, and reports in the US Farm Equipment Industry, consider subscribing to industry newsletters, following relevant companies and organizations, or regularly checking reputable industry news sources and publications.
Methodology
Step 1 - Identification of Relevant Samples Size from Population Database


Step 2 - Approaches for Defining Global Market Size (Value, Volume* & Price*)

Note*: In applicable scenarios
Step 3 - Data Sources
Primary Research
- Web Analytics
- Survey Reports
- Research Institute
- Latest Research Reports
- Opinion Leaders
Secondary Research
- Annual Reports
- White Paper
- Latest Press Release
- Industry Association
- Paid Database
- Investor Presentations

Step 4 - Data Triangulation
Involves using different sources of information in order to increase the validity of a study
These sources are likely to be stakeholders in a program - participants, other researchers, program staff, other community members, and so on.
Then we put all data in single framework & apply various statistical tools to find out the dynamic on the market.
During the analysis stage, feedback from the stakeholder groups would be compared to determine areas of agreement as well as areas of divergence