

Key Insights
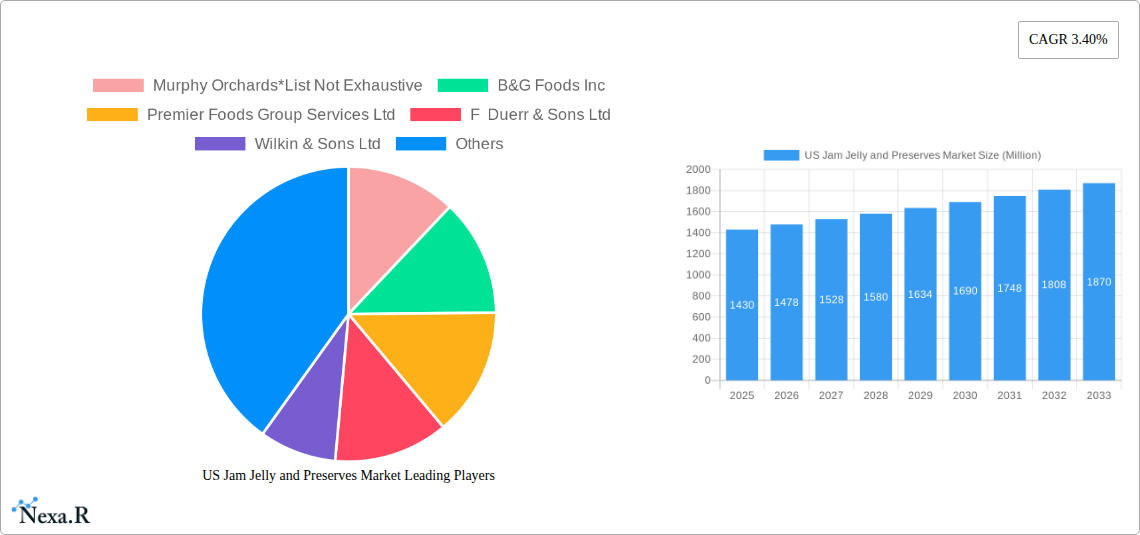
The US jam, jelly, and preserves market, valued at $1.43 billion in 2025, is projected to experience steady growth, driven by increasing consumer demand for convenient breakfast options and the rising popularity of artisanal and organic spreads. The market's Compound Annual Growth Rate (CAGR) of 3.40% from 2025 to 2033 suggests a consistent expansion, albeit at a moderate pace. Key growth drivers include the increasing preference for healthier and natural food products, leading to a surge in demand for organic and low-sugar varieties. Furthermore, innovative product launches, such as unique flavor combinations and convenient packaging formats (e.g., single-serve packs), are also fueling market expansion. Supermarkets and hypermarkets remain the dominant distribution channel, though online stores are experiencing significant growth due to increasing e-commerce penetration and convenient home delivery options. The market is segmented into various product types, with jams and jellies holding the largest market share followed by marmalades and preserves. Competitive landscape analysis reveals that established players like J.M. Smucker Company, Kraft Heinz, and Conagra Foods are leveraging their strong brand recognition and extensive distribution networks to maintain their market positions, while smaller, artisanal producers are capitalizing on the growing consumer preference for high-quality, locally sourced products.
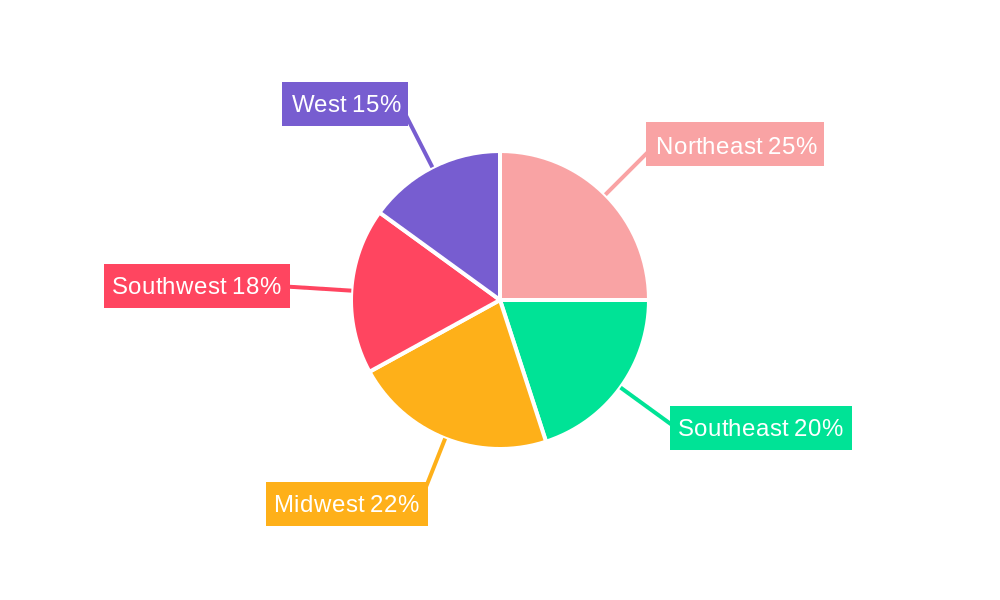
Despite the positive growth outlook, the market faces certain restraints. Fluctuating prices of raw materials, such as fruits and sugar, can impact profitability. Furthermore, changing consumer preferences towards healthier alternatives, including reduced sugar content and increased focus on natural ingredients, pose both opportunities and challenges for manufacturers. Companies must adapt their product portfolios to meet the evolving demands of health-conscious consumers. The regional distribution of the market shows considerable variation across the United States, with the Northeast and West regions likely demonstrating higher consumption levels due to factors like higher disposable incomes and a greater concentration of health-conscious consumers. This regional disparity presents both opportunities for targeted marketing campaigns and challenges in ensuring equitable market penetration. The forecast period of 2025-2033 presents ample opportunities for both established companies and new entrants to expand their market share and profitability through innovative product development and strategic distribution strategies.
US Jam, Jelly, and Preserves Market: A Comprehensive Report (2019-2033)
This comprehensive report provides an in-depth analysis of the US jam, jelly, and preserves market, encompassing market dynamics, growth trends, dominant segments, and key players. The study period covers 2019-2033, with 2025 as the base and estimated year. The report is crucial for industry professionals seeking to understand market trends and opportunities within this dynamic sector. The total market value in 2025 is estimated at xx Million units.
US Jam, Jelly, and Preserves Market Market Dynamics & Structure
The US jam, jelly, and preserves market is a moderately fragmented landscape with several key players and a growing number of smaller, niche brands. Market concentration is moderate, with the top 5 companies holding an estimated xx% market share in 2025. Technological innovation focuses on extending shelf life, improving taste and texture, and catering to specific dietary needs (e.g., keto, vegan). Regulatory frameworks primarily revolve around food safety and labeling requirements, influencing product formulation and marketing claims. Competitive product substitutes include other breakfast spreads like nut butters and yogurt. End-user demographics are diverse, encompassing all age groups, with a significant consumer base among families and health-conscious individuals. M&A activity has been moderate in recent years, driven by a desire for market expansion and product diversification. Approximately xx M&A deals were recorded between 2019 and 2024.
- Market Concentration: Moderate, top 5 players holding xx% market share (2025).
- Technological Innovation: Focus on shelf-life extension, enhanced taste/texture, and dietary needs.
- Regulatory Framework: Food safety, labeling regulations impacting formulation and marketing.
- Competitive Substitutes: Nut butters, yogurt, etc.
- End-User Demographics: Diverse age groups, strong family and health-conscious consumer base.
- M&A Activity: Moderate, xx deals (2019-2024), driven by expansion and diversification.
US Jam, Jelly, and Preserves Market Growth Trends & Insights
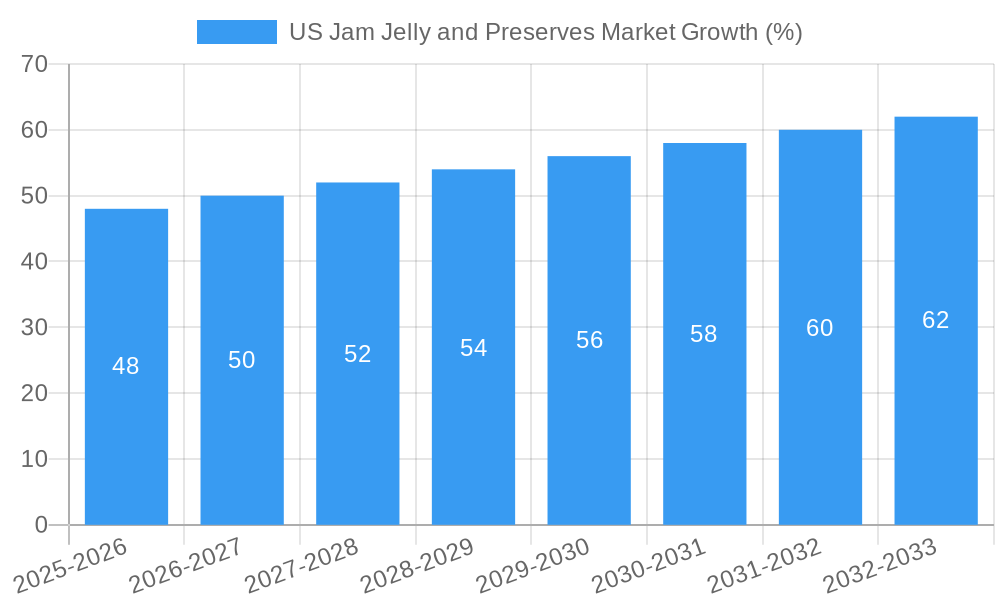
The US jam, jelly, and preserves market experienced a compound annual growth rate (CAGR) of xx% during the historical period (2019-2024), reaching a market size of xx Million units in 2024. The market is projected to continue its growth trajectory, with a forecasted CAGR of xx% from 2025 to 2033. This growth is primarily driven by increasing consumer demand for convenient breakfast options and the rising popularity of artisanal and specialty jams and preserves. Technological disruptions are impacting product development, with a focus on innovative packaging and improved preservation techniques. Consumer behavior is shifting towards healthier options with natural ingredients and reduced sugar content. Market penetration of premium products is increasing.
Dominant Regions, Countries, or Segments in US Jam Jelly and Preserves Market
The dominant segment within the US jam, jelly, and preserves market is the Jam and Jellies product type, representing xx% of the total market in 2025. This is due to its widespread appeal and versatility in various culinary applications. The Supermarket/Hypermarket distribution channel also leads, holding the largest market share (xx%) due to its extensive reach and established distribution network.
- Product Type: Jam and Jellies (xx% market share in 2025) drives market growth due to versatility and popularity.
- Distribution Channel: Supermarket/Hypermarket (xx% market share in 2025) dominates due to extensive reach.
- Regional Dominance: [Insert analysis of regional variations if available, otherwise indicate xx].
US Jam, Jelly, and Preserves Market Product Landscape
The product landscape is characterized by a diverse range of offerings, including traditional jams and jellies, exotic fruit preserves, and specialized products catering to specific dietary needs (e.g., organic, low-sugar, vegan). Product innovations focus on unique flavor combinations, convenient packaging (e.g., single-serve cups), and enhanced nutritional profiles. Key selling propositions include natural ingredients, artisanal production methods, and distinctive flavors.
Key Drivers, Barriers & Challenges in US Jam Jelly and Preserves Market
Key Drivers: Increasing demand for convenient breakfast options, growing popularity of artisanal and specialty products, health consciousness driving demand for low-sugar and organic options.
Challenges: Fluctuating raw material prices, intense competition from established and emerging brands, increasing pressure to reduce sugar content without compromising taste, stringent food safety regulations, and supply chain disruptions. These challenges have resulted in an estimated xx% increase in production costs between 2021 and 2024.
Emerging Opportunities in US Jam Jelly and Preserves Market
Emerging opportunities lie in the growth of specialized dietary products (keto-friendly, vegan), the increasing demand for unique and exotic flavors, and the expansion into new distribution channels such as online retail. Exploring innovative packaging solutions and tapping into the growing interest in local and sustainable sourcing are also key growth avenues.
Growth Accelerators in the US Jam Jelly and Preserves Market Industry
Technological advancements in preservation techniques, sustainable sourcing initiatives, strategic partnerships with food retailers and foodservice operators, and effective marketing campaigns emphasizing product quality and health benefits are driving long-term growth.
Key Players Shaping the US Jam Jelly and Preserves Market Market
- Murphy Orchards
- B&G Foods Inc
- Premier Foods Group Services Ltd
- F Duerr & Sons Ltd
- Wilkin & Sons Ltd
- The Hain Celestial Group Inc
- National Grape Cooperative Association
- The J M Smucker Company
- The Kraft Heinz Company
- Andros Group
- Conagra Foods Inc
Notable Milestones in US Jam Jelly and Preserves Market Sector
- February 2021: Good Good introduces three new keto-friendly and vegan jam flavors.
- September 2022: Kraft Heinz collaborates with StartLife to enhance product innovation.
- January 2023: Conagra Brands launches Snack Pack Starburst All Pink Juicy Gels.
In-Depth US Jam Jelly and Preserves Market Market Outlook
The US jam, jelly, and preserves market is poised for continued growth, fueled by evolving consumer preferences and ongoing innovation. Opportunities exist in expanding into niche markets, leveraging online channels, and focusing on sustainable and healthy product offerings. Strategic partnerships and effective marketing will be crucial for success in this competitive landscape. The market is projected to reach xx Million units by 2033.
US Jam Jelly and Preserves Market Segmentation
-
1. Product Type
- 1.1. Jam and Jellies
- 1.2. Marmalade
- 1.3. Preserves
-
2. Distribution Channel
- 2.1. Supermarket/Hypermarket
- 2.2. Convenience Store
- 2.3. Online Stores
- 2.4. Other Distribution Channels
US Jam Jelly and Preserves Market Segmentation By Geography
-
1. North America
- 1.1. United States
- 1.2. Canada
- 1.3. Mexico
-
2. South America
- 2.1. Brazil
- 2.2. Argentina
- 2.3. Rest of South America
-
3. Europe
- 3.1. United Kingdom
- 3.2. Germany
- 3.3. France
- 3.4. Italy
- 3.5. Spain
- 3.6. Russia
- 3.7. Benelux
- 3.8. Nordics
- 3.9. Rest of Europe
-
4. Middle East & Africa
- 4.1. Turkey
- 4.2. Israel
- 4.3. GCC
- 4.4. North Africa
- 4.5. South Africa
- 4.6. Rest of Middle East & Africa
-
5. Asia Pacific
- 5.1. China
- 5.2. India
- 5.3. Japan
- 5.4. South Korea
- 5.5. ASEAN
- 5.6. Oceania
- 5.7. Rest of Asia Pacific
US Jam Jelly and Preserves Market REPORT HIGHLIGHTS
| Aspects | Details |
|---|---|
| Study Period | 2019-2033 |
| Base Year | 2024 |
| Estimated Year | 2025 |
| Forecast Period | 2025-2033 |
| Historical Period | 2019-2024 |
| Growth Rate | CAGR of 3.40% from 2019-2033 |
| Segmentation |
|
Table of Contents
- 1. Introduction
- 1.1. Research Scope
- 1.2. Market Segmentation
- 1.3. Research Methodology
- 1.4. Definitions and Assumptions
- 2. Executive Summary
- 2.1. Introduction
- 3. Market Dynamics
- 3.1. Introduction
- 3.2. Market Drivers
- 3.2.1. Prevalence of Lactose Intolerance Driving the Market; Growing Influence of Healthy Lifestyle Trends and Rising Non-Traditional Users
- 3.3. Market Restrains
- 3.3.1. Wide Availability of Alternative Protein Sources
- 3.4. Market Trends
- 3.4.1. Increasing Demand for Organic Food Products
- 4. Market Factor Analysis
- 4.1. Porters Five Forces
- 4.2. Supply/Value Chain
- 4.3. PESTEL analysis
- 4.4. Market Entropy
- 4.5. Patent/Trademark Analysis
- 5. Global US Jam Jelly and Preserves Market Analysis, Insights and Forecast, 2019-2031
- 5.1. Market Analysis, Insights and Forecast - by Product Type
- 5.1.1. Jam and Jellies
- 5.1.2. Marmalade
- 5.1.3. Preserves
- 5.2. Market Analysis, Insights and Forecast - by Distribution Channel
- 5.2.1. Supermarket/Hypermarket
- 5.2.2. Convenience Store
- 5.2.3. Online Stores
- 5.2.4. Other Distribution Channels
- 5.3. Market Analysis, Insights and Forecast - by Region
- 5.3.1. North America
- 5.3.2. South America
- 5.3.3. Europe
- 5.3.4. Middle East & Africa
- 5.3.5. Asia Pacific
- 5.1. Market Analysis, Insights and Forecast - by Product Type
- 6. North America US Jam Jelly and Preserves Market Analysis, Insights and Forecast, 2019-2031
- 6.1. Market Analysis, Insights and Forecast - by Product Type
- 6.1.1. Jam and Jellies
- 6.1.2. Marmalade
- 6.1.3. Preserves
- 6.2. Market Analysis, Insights and Forecast - by Distribution Channel
- 6.2.1. Supermarket/Hypermarket
- 6.2.2. Convenience Store
- 6.2.3. Online Stores
- 6.2.4. Other Distribution Channels
- 6.1. Market Analysis, Insights and Forecast - by Product Type
- 7. South America US Jam Jelly and Preserves Market Analysis, Insights and Forecast, 2019-2031
- 7.1. Market Analysis, Insights and Forecast - by Product Type
- 7.1.1. Jam and Jellies
- 7.1.2. Marmalade
- 7.1.3. Preserves
- 7.2. Market Analysis, Insights and Forecast - by Distribution Channel
- 7.2.1. Supermarket/Hypermarket
- 7.2.2. Convenience Store
- 7.2.3. Online Stores
- 7.2.4. Other Distribution Channels
- 7.1. Market Analysis, Insights and Forecast - by Product Type
- 8. Europe US Jam Jelly and Preserves Market Analysis, Insights and Forecast, 2019-2031
- 8.1. Market Analysis, Insights and Forecast - by Product Type
- 8.1.1. Jam and Jellies
- 8.1.2. Marmalade
- 8.1.3. Preserves
- 8.2. Market Analysis, Insights and Forecast - by Distribution Channel
- 8.2.1. Supermarket/Hypermarket
- 8.2.2. Convenience Store
- 8.2.3. Online Stores
- 8.2.4. Other Distribution Channels
- 8.1. Market Analysis, Insights and Forecast - by Product Type
- 9. Middle East & Africa US Jam Jelly and Preserves Market Analysis, Insights and Forecast, 2019-2031
- 9.1. Market Analysis, Insights and Forecast - by Product Type
- 9.1.1. Jam and Jellies
- 9.1.2. Marmalade
- 9.1.3. Preserves
- 9.2. Market Analysis, Insights and Forecast - by Distribution Channel
- 9.2.1. Supermarket/Hypermarket
- 9.2.2. Convenience Store
- 9.2.3. Online Stores
- 9.2.4. Other Distribution Channels
- 9.1. Market Analysis, Insights and Forecast - by Product Type
- 10. Asia Pacific US Jam Jelly and Preserves Market Analysis, Insights and Forecast, 2019-2031
- 10.1. Market Analysis, Insights and Forecast - by Product Type
- 10.1.1. Jam and Jellies
- 10.1.2. Marmalade
- 10.1.3. Preserves
- 10.2. Market Analysis, Insights and Forecast - by Distribution Channel
- 10.2.1. Supermarket/Hypermarket
- 10.2.2. Convenience Store
- 10.2.3. Online Stores
- 10.2.4. Other Distribution Channels
- 10.1. Market Analysis, Insights and Forecast - by Product Type
- 11. Northeast US Jam Jelly and Preserves Market Analysis, Insights and Forecast, 2019-2031
- 12. Southeast US Jam Jelly and Preserves Market Analysis, Insights and Forecast, 2019-2031
- 13. Midwest US Jam Jelly and Preserves Market Analysis, Insights and Forecast, 2019-2031
- 14. Southwest US Jam Jelly and Preserves Market Analysis, Insights and Forecast, 2019-2031
- 15. West US Jam Jelly and Preserves Market Analysis, Insights and Forecast, 2019-2031
- 16. Competitive Analysis
- 16.1. Global Market Share Analysis 2024
- 16.2. Company Profiles
- 16.2.1 Murphy Orchards*List Not Exhaustive
- 16.2.1.1. Overview
- 16.2.1.2. Products
- 16.2.1.3. SWOT Analysis
- 16.2.1.4. Recent Developments
- 16.2.1.5. Financials (Based on Availability)
- 16.2.2 B&G Foods Inc
- 16.2.2.1. Overview
- 16.2.2.2. Products
- 16.2.2.3. SWOT Analysis
- 16.2.2.4. Recent Developments
- 16.2.2.5. Financials (Based on Availability)
- 16.2.3 Premier Foods Group Services Ltd
- 16.2.3.1. Overview
- 16.2.3.2. Products
- 16.2.3.3. SWOT Analysis
- 16.2.3.4. Recent Developments
- 16.2.3.5. Financials (Based on Availability)
- 16.2.4 F Duerr & Sons Ltd
- 16.2.4.1. Overview
- 16.2.4.2. Products
- 16.2.4.3. SWOT Analysis
- 16.2.4.4. Recent Developments
- 16.2.4.5. Financials (Based on Availability)
- 16.2.5 Wilkin & Sons Ltd
- 16.2.5.1. Overview
- 16.2.5.2. Products
- 16.2.5.3. SWOT Analysis
- 16.2.5.4. Recent Developments
- 16.2.5.5. Financials (Based on Availability)
- 16.2.6 The Hain Celestial Group Inc
- 16.2.6.1. Overview
- 16.2.6.2. Products
- 16.2.6.3. SWOT Analysis
- 16.2.6.4. Recent Developments
- 16.2.6.5. Financials (Based on Availability)
- 16.2.7 National Grape Cooperative Association
- 16.2.7.1. Overview
- 16.2.7.2. Products
- 16.2.7.3. SWOT Analysis
- 16.2.7.4. Recent Developments
- 16.2.7.5. Financials (Based on Availability)
- 16.2.8 The J M Smucker Company
- 16.2.8.1. Overview
- 16.2.8.2. Products
- 16.2.8.3. SWOT Analysis
- 16.2.8.4. Recent Developments
- 16.2.8.5. Financials (Based on Availability)
- 16.2.9 The Kraft Heinz Company
- 16.2.9.1. Overview
- 16.2.9.2. Products
- 16.2.9.3. SWOT Analysis
- 16.2.9.4. Recent Developments
- 16.2.9.5. Financials (Based on Availability)
- 16.2.10 Andros Group
- 16.2.10.1. Overview
- 16.2.10.2. Products
- 16.2.10.3. SWOT Analysis
- 16.2.10.4. Recent Developments
- 16.2.10.5. Financials (Based on Availability)
- 16.2.11 Conagra Foods Inc
- 16.2.11.1. Overview
- 16.2.11.2. Products
- 16.2.11.3. SWOT Analysis
- 16.2.11.4. Recent Developments
- 16.2.11.5. Financials (Based on Availability)
- 16.2.1 Murphy Orchards*List Not Exhaustive
List of Figures
- Figure 1: Global US Jam Jelly and Preserves Market Revenue Breakdown (Million, %) by Region 2024 & 2032
- Figure 2: Global US Jam Jelly and Preserves Market Volume Breakdown (Liters, %) by Region 2024 & 2032
- Figure 3: United states US Jam Jelly and Preserves Market Revenue (Million), by Country 2024 & 2032
- Figure 4: United states US Jam Jelly and Preserves Market Volume (Liters), by Country 2024 & 2032
- Figure 5: United states US Jam Jelly and Preserves Market Revenue Share (%), by Country 2024 & 2032
- Figure 6: United states US Jam Jelly and Preserves Market Volume Share (%), by Country 2024 & 2032
- Figure 7: North America US Jam Jelly and Preserves Market Revenue (Million), by Product Type 2024 & 2032
- Figure 8: North America US Jam Jelly and Preserves Market Volume (Liters), by Product Type 2024 & 2032
- Figure 9: North America US Jam Jelly and Preserves Market Revenue Share (%), by Product Type 2024 & 2032
- Figure 10: North America US Jam Jelly and Preserves Market Volume Share (%), by Product Type 2024 & 2032
- Figure 11: North America US Jam Jelly and Preserves Market Revenue (Million), by Distribution Channel 2024 & 2032
- Figure 12: North America US Jam Jelly and Preserves Market Volume (Liters), by Distribution Channel 2024 & 2032
- Figure 13: North America US Jam Jelly and Preserves Market Revenue Share (%), by Distribution Channel 2024 & 2032
- Figure 14: North America US Jam Jelly and Preserves Market Volume Share (%), by Distribution Channel 2024 & 2032
- Figure 15: North America US Jam Jelly and Preserves Market Revenue (Million), by Country 2024 & 2032
- Figure 16: North America US Jam Jelly and Preserves Market Volume (Liters), by Country 2024 & 2032
- Figure 17: North America US Jam Jelly and Preserves Market Revenue Share (%), by Country 2024 & 2032
- Figure 18: North America US Jam Jelly and Preserves Market Volume Share (%), by Country 2024 & 2032
- Figure 19: South America US Jam Jelly and Preserves Market Revenue (Million), by Product Type 2024 & 2032
- Figure 20: South America US Jam Jelly and Preserves Market Volume (Liters), by Product Type 2024 & 2032
- Figure 21: South America US Jam Jelly and Preserves Market Revenue Share (%), by Product Type 2024 & 2032
- Figure 22: South America US Jam Jelly and Preserves Market Volume Share (%), by Product Type 2024 & 2032
- Figure 23: South America US Jam Jelly and Preserves Market Revenue (Million), by Distribution Channel 2024 & 2032
- Figure 24: South America US Jam Jelly and Preserves Market Volume (Liters), by Distribution Channel 2024 & 2032
- Figure 25: South America US Jam Jelly and Preserves Market Revenue Share (%), by Distribution Channel 2024 & 2032
- Figure 26: South America US Jam Jelly and Preserves Market Volume Share (%), by Distribution Channel 2024 & 2032
- Figure 27: South America US Jam Jelly and Preserves Market Revenue (Million), by Country 2024 & 2032
- Figure 28: South America US Jam Jelly and Preserves Market Volume (Liters), by Country 2024 & 2032
- Figure 29: South America US Jam Jelly and Preserves Market Revenue Share (%), by Country 2024 & 2032
- Figure 30: South America US Jam Jelly and Preserves Market Volume Share (%), by Country 2024 & 2032
- Figure 31: Europe US Jam Jelly and Preserves Market Revenue (Million), by Product Type 2024 & 2032
- Figure 32: Europe US Jam Jelly and Preserves Market Volume (Liters), by Product Type 2024 & 2032
- Figure 33: Europe US Jam Jelly and Preserves Market Revenue Share (%), by Product Type 2024 & 2032
- Figure 34: Europe US Jam Jelly and Preserves Market Volume Share (%), by Product Type 2024 & 2032
- Figure 35: Europe US Jam Jelly and Preserves Market Revenue (Million), by Distribution Channel 2024 & 2032
- Figure 36: Europe US Jam Jelly and Preserves Market Volume (Liters), by Distribution Channel 2024 & 2032
- Figure 37: Europe US Jam Jelly and Preserves Market Revenue Share (%), by Distribution Channel 2024 & 2032
- Figure 38: Europe US Jam Jelly and Preserves Market Volume Share (%), by Distribution Channel 2024 & 2032
- Figure 39: Europe US Jam Jelly and Preserves Market Revenue (Million), by Country 2024 & 2032
- Figure 40: Europe US Jam Jelly and Preserves Market Volume (Liters), by Country 2024 & 2032
- Figure 41: Europe US Jam Jelly and Preserves Market Revenue Share (%), by Country 2024 & 2032
- Figure 42: Europe US Jam Jelly and Preserves Market Volume Share (%), by Country 2024 & 2032
- Figure 43: Middle East & Africa US Jam Jelly and Preserves Market Revenue (Million), by Product Type 2024 & 2032
- Figure 44: Middle East & Africa US Jam Jelly and Preserves Market Volume (Liters), by Product Type 2024 & 2032
- Figure 45: Middle East & Africa US Jam Jelly and Preserves Market Revenue Share (%), by Product Type 2024 & 2032
- Figure 46: Middle East & Africa US Jam Jelly and Preserves Market Volume Share (%), by Product Type 2024 & 2032
- Figure 47: Middle East & Africa US Jam Jelly and Preserves Market Revenue (Million), by Distribution Channel 2024 & 2032
- Figure 48: Middle East & Africa US Jam Jelly and Preserves Market Volume (Liters), by Distribution Channel 2024 & 2032
- Figure 49: Middle East & Africa US Jam Jelly and Preserves Market Revenue Share (%), by Distribution Channel 2024 & 2032
- Figure 50: Middle East & Africa US Jam Jelly and Preserves Market Volume Share (%), by Distribution Channel 2024 & 2032
- Figure 51: Middle East & Africa US Jam Jelly and Preserves Market Revenue (Million), by Country 2024 & 2032
- Figure 52: Middle East & Africa US Jam Jelly and Preserves Market Volume (Liters), by Country 2024 & 2032
- Figure 53: Middle East & Africa US Jam Jelly and Preserves Market Revenue Share (%), by Country 2024 & 2032
- Figure 54: Middle East & Africa US Jam Jelly and Preserves Market Volume Share (%), by Country 2024 & 2032
- Figure 55: Asia Pacific US Jam Jelly and Preserves Market Revenue (Million), by Product Type 2024 & 2032
- Figure 56: Asia Pacific US Jam Jelly and Preserves Market Volume (Liters), by Product Type 2024 & 2032
- Figure 57: Asia Pacific US Jam Jelly and Preserves Market Revenue Share (%), by Product Type 2024 & 2032
- Figure 58: Asia Pacific US Jam Jelly and Preserves Market Volume Share (%), by Product Type 2024 & 2032
- Figure 59: Asia Pacific US Jam Jelly and Preserves Market Revenue (Million), by Distribution Channel 2024 & 2032
- Figure 60: Asia Pacific US Jam Jelly and Preserves Market Volume (Liters), by Distribution Channel 2024 & 2032
- Figure 61: Asia Pacific US Jam Jelly and Preserves Market Revenue Share (%), by Distribution Channel 2024 & 2032
- Figure 62: Asia Pacific US Jam Jelly and Preserves Market Volume Share (%), by Distribution Channel 2024 & 2032
- Figure 63: Asia Pacific US Jam Jelly and Preserves Market Revenue (Million), by Country 2024 & 2032
- Figure 64: Asia Pacific US Jam Jelly and Preserves Market Volume (Liters), by Country 2024 & 2032
- Figure 65: Asia Pacific US Jam Jelly and Preserves Market Revenue Share (%), by Country 2024 & 2032
- Figure 66: Asia Pacific US Jam Jelly and Preserves Market Volume Share (%), by Country 2024 & 2032
List of Tables
- Table 1: Global US Jam Jelly and Preserves Market Revenue Million Forecast, by Region 2019 & 2032
- Table 2: Global US Jam Jelly and Preserves Market Volume Liters Forecast, by Region 2019 & 2032
- Table 3: Global US Jam Jelly and Preserves Market Revenue Million Forecast, by Product Type 2019 & 2032
- Table 4: Global US Jam Jelly and Preserves Market Volume Liters Forecast, by Product Type 2019 & 2032
- Table 5: Global US Jam Jelly and Preserves Market Revenue Million Forecast, by Distribution Channel 2019 & 2032
- Table 6: Global US Jam Jelly and Preserves Market Volume Liters Forecast, by Distribution Channel 2019 & 2032
- Table 7: Global US Jam Jelly and Preserves Market Revenue Million Forecast, by Region 2019 & 2032
- Table 8: Global US Jam Jelly and Preserves Market Volume Liters Forecast, by Region 2019 & 2032
- Table 9: Global US Jam Jelly and Preserves Market Revenue Million Forecast, by Country 2019 & 2032
- Table 10: Global US Jam Jelly and Preserves Market Volume Liters Forecast, by Country 2019 & 2032
- Table 11: Northeast US Jam Jelly and Preserves Market Revenue (Million) Forecast, by Application 2019 & 2032
- Table 12: Northeast US Jam Jelly and Preserves Market Volume (Liters) Forecast, by Application 2019 & 2032
- Table 13: Southeast US Jam Jelly and Preserves Market Revenue (Million) Forecast, by Application 2019 & 2032
- Table 14: Southeast US Jam Jelly and Preserves Market Volume (Liters) Forecast, by Application 2019 & 2032
- Table 15: Midwest US Jam Jelly and Preserves Market Revenue (Million) Forecast, by Application 2019 & 2032
- Table 16: Midwest US Jam Jelly and Preserves Market Volume (Liters) Forecast, by Application 2019 & 2032
- Table 17: Southwest US Jam Jelly and Preserves Market Revenue (Million) Forecast, by Application 2019 & 2032
- Table 18: Southwest US Jam Jelly and Preserves Market Volume (Liters) Forecast, by Application 2019 & 2032
- Table 19: West US Jam Jelly and Preserves Market Revenue (Million) Forecast, by Application 2019 & 2032
- Table 20: West US Jam Jelly and Preserves Market Volume (Liters) Forecast, by Application 2019 & 2032
- Table 21: Global US Jam Jelly and Preserves Market Revenue Million Forecast, by Product Type 2019 & 2032
- Table 22: Global US Jam Jelly and Preserves Market Volume Liters Forecast, by Product Type 2019 & 2032
- Table 23: Global US Jam Jelly and Preserves Market Revenue Million Forecast, by Distribution Channel 2019 & 2032
- Table 24: Global US Jam Jelly and Preserves Market Volume Liters Forecast, by Distribution Channel 2019 & 2032
- Table 25: Global US Jam Jelly and Preserves Market Revenue Million Forecast, by Country 2019 & 2032
- Table 26: Global US Jam Jelly and Preserves Market Volume Liters Forecast, by Country 2019 & 2032
- Table 27: United States US Jam Jelly and Preserves Market Revenue (Million) Forecast, by Application 2019 & 2032
- Table 28: United States US Jam Jelly and Preserves Market Volume (Liters) Forecast, by Application 2019 & 2032
- Table 29: Canada US Jam Jelly and Preserves Market Revenue (Million) Forecast, by Application 2019 & 2032
- Table 30: Canada US Jam Jelly and Preserves Market Volume (Liters) Forecast, by Application 2019 & 2032
- Table 31: Mexico US Jam Jelly and Preserves Market Revenue (Million) Forecast, by Application 2019 & 2032
- Table 32: Mexico US Jam Jelly and Preserves Market Volume (Liters) Forecast, by Application 2019 & 2032
- Table 33: Global US Jam Jelly and Preserves Market Revenue Million Forecast, by Product Type 2019 & 2032
- Table 34: Global US Jam Jelly and Preserves Market Volume Liters Forecast, by Product Type 2019 & 2032
- Table 35: Global US Jam Jelly and Preserves Market Revenue Million Forecast, by Distribution Channel 2019 & 2032
- Table 36: Global US Jam Jelly and Preserves Market Volume Liters Forecast, by Distribution Channel 2019 & 2032
- Table 37: Global US Jam Jelly and Preserves Market Revenue Million Forecast, by Country 2019 & 2032
- Table 38: Global US Jam Jelly and Preserves Market Volume Liters Forecast, by Country 2019 & 2032
- Table 39: Brazil US Jam Jelly and Preserves Market Revenue (Million) Forecast, by Application 2019 & 2032
- Table 40: Brazil US Jam Jelly and Preserves Market Volume (Liters) Forecast, by Application 2019 & 2032
- Table 41: Argentina US Jam Jelly and Preserves Market Revenue (Million) Forecast, by Application 2019 & 2032
- Table 42: Argentina US Jam Jelly and Preserves Market Volume (Liters) Forecast, by Application 2019 & 2032
- Table 43: Rest of South America US Jam Jelly and Preserves Market Revenue (Million) Forecast, by Application 2019 & 2032
- Table 44: Rest of South America US Jam Jelly and Preserves Market Volume (Liters) Forecast, by Application 2019 & 2032
- Table 45: Global US Jam Jelly and Preserves Market Revenue Million Forecast, by Product Type 2019 & 2032
- Table 46: Global US Jam Jelly and Preserves Market Volume Liters Forecast, by Product Type 2019 & 2032
- Table 47: Global US Jam Jelly and Preserves Market Revenue Million Forecast, by Distribution Channel 2019 & 2032
- Table 48: Global US Jam Jelly and Preserves Market Volume Liters Forecast, by Distribution Channel 2019 & 2032
- Table 49: Global US Jam Jelly and Preserves Market Revenue Million Forecast, by Country 2019 & 2032
- Table 50: Global US Jam Jelly and Preserves Market Volume Liters Forecast, by Country 2019 & 2032
- Table 51: United Kingdom US Jam Jelly and Preserves Market Revenue (Million) Forecast, by Application 2019 & 2032
- Table 52: United Kingdom US Jam Jelly and Preserves Market Volume (Liters) Forecast, by Application 2019 & 2032
- Table 53: Germany US Jam Jelly and Preserves Market Revenue (Million) Forecast, by Application 2019 & 2032
- Table 54: Germany US Jam Jelly and Preserves Market Volume (Liters) Forecast, by Application 2019 & 2032
- Table 55: France US Jam Jelly and Preserves Market Revenue (Million) Forecast, by Application 2019 & 2032
- Table 56: France US Jam Jelly and Preserves Market Volume (Liters) Forecast, by Application 2019 & 2032
- Table 57: Italy US Jam Jelly and Preserves Market Revenue (Million) Forecast, by Application 2019 & 2032
- Table 58: Italy US Jam Jelly and Preserves Market Volume (Liters) Forecast, by Application 2019 & 2032
- Table 59: Spain US Jam Jelly and Preserves Market Revenue (Million) Forecast, by Application 2019 & 2032
- Table 60: Spain US Jam Jelly and Preserves Market Volume (Liters) Forecast, by Application 2019 & 2032
- Table 61: Russia US Jam Jelly and Preserves Market Revenue (Million) Forecast, by Application 2019 & 2032
- Table 62: Russia US Jam Jelly and Preserves Market Volume (Liters) Forecast, by Application 2019 & 2032
- Table 63: Benelux US Jam Jelly and Preserves Market Revenue (Million) Forecast, by Application 2019 & 2032
- Table 64: Benelux US Jam Jelly and Preserves Market Volume (Liters) Forecast, by Application 2019 & 2032
- Table 65: Nordics US Jam Jelly and Preserves Market Revenue (Million) Forecast, by Application 2019 & 2032
- Table 66: Nordics US Jam Jelly and Preserves Market Volume (Liters) Forecast, by Application 2019 & 2032
- Table 67: Rest of Europe US Jam Jelly and Preserves Market Revenue (Million) Forecast, by Application 2019 & 2032
- Table 68: Rest of Europe US Jam Jelly and Preserves Market Volume (Liters) Forecast, by Application 2019 & 2032
- Table 69: Global US Jam Jelly and Preserves Market Revenue Million Forecast, by Product Type 2019 & 2032
- Table 70: Global US Jam Jelly and Preserves Market Volume Liters Forecast, by Product Type 2019 & 2032
- Table 71: Global US Jam Jelly and Preserves Market Revenue Million Forecast, by Distribution Channel 2019 & 2032
- Table 72: Global US Jam Jelly and Preserves Market Volume Liters Forecast, by Distribution Channel 2019 & 2032
- Table 73: Global US Jam Jelly and Preserves Market Revenue Million Forecast, by Country 2019 & 2032
- Table 74: Global US Jam Jelly and Preserves Market Volume Liters Forecast, by Country 2019 & 2032
- Table 75: Turkey US Jam Jelly and Preserves Market Revenue (Million) Forecast, by Application 2019 & 2032
- Table 76: Turkey US Jam Jelly and Preserves Market Volume (Liters) Forecast, by Application 2019 & 2032
- Table 77: Israel US Jam Jelly and Preserves Market Revenue (Million) Forecast, by Application 2019 & 2032
- Table 78: Israel US Jam Jelly and Preserves Market Volume (Liters) Forecast, by Application 2019 & 2032
- Table 79: GCC US Jam Jelly and Preserves Market Revenue (Million) Forecast, by Application 2019 & 2032
- Table 80: GCC US Jam Jelly and Preserves Market Volume (Liters) Forecast, by Application 2019 & 2032
- Table 81: North Africa US Jam Jelly and Preserves Market Revenue (Million) Forecast, by Application 2019 & 2032
- Table 82: North Africa US Jam Jelly and Preserves Market Volume (Liters) Forecast, by Application 2019 & 2032
- Table 83: South Africa US Jam Jelly and Preserves Market Revenue (Million) Forecast, by Application 2019 & 2032
- Table 84: South Africa US Jam Jelly and Preserves Market Volume (Liters) Forecast, by Application 2019 & 2032
- Table 85: Rest of Middle East & Africa US Jam Jelly and Preserves Market Revenue (Million) Forecast, by Application 2019 & 2032
- Table 86: Rest of Middle East & Africa US Jam Jelly and Preserves Market Volume (Liters) Forecast, by Application 2019 & 2032
- Table 87: Global US Jam Jelly and Preserves Market Revenue Million Forecast, by Product Type 2019 & 2032
- Table 88: Global US Jam Jelly and Preserves Market Volume Liters Forecast, by Product Type 2019 & 2032
- Table 89: Global US Jam Jelly and Preserves Market Revenue Million Forecast, by Distribution Channel 2019 & 2032
- Table 90: Global US Jam Jelly and Preserves Market Volume Liters Forecast, by Distribution Channel 2019 & 2032
- Table 91: Global US Jam Jelly and Preserves Market Revenue Million Forecast, by Country 2019 & 2032
- Table 92: Global US Jam Jelly and Preserves Market Volume Liters Forecast, by Country 2019 & 2032
- Table 93: China US Jam Jelly and Preserves Market Revenue (Million) Forecast, by Application 2019 & 2032
- Table 94: China US Jam Jelly and Preserves Market Volume (Liters) Forecast, by Application 2019 & 2032
- Table 95: India US Jam Jelly and Preserves Market Revenue (Million) Forecast, by Application 2019 & 2032
- Table 96: India US Jam Jelly and Preserves Market Volume (Liters) Forecast, by Application 2019 & 2032
- Table 97: Japan US Jam Jelly and Preserves Market Revenue (Million) Forecast, by Application 2019 & 2032
- Table 98: Japan US Jam Jelly and Preserves Market Volume (Liters) Forecast, by Application 2019 & 2032
- Table 99: South Korea US Jam Jelly and Preserves Market Revenue (Million) Forecast, by Application 2019 & 2032
- Table 100: South Korea US Jam Jelly and Preserves Market Volume (Liters) Forecast, by Application 2019 & 2032
- Table 101: ASEAN US Jam Jelly and Preserves Market Revenue (Million) Forecast, by Application 2019 & 2032
- Table 102: ASEAN US Jam Jelly and Preserves Market Volume (Liters) Forecast, by Application 2019 & 2032
- Table 103: Oceania US Jam Jelly and Preserves Market Revenue (Million) Forecast, by Application 2019 & 2032
- Table 104: Oceania US Jam Jelly and Preserves Market Volume (Liters) Forecast, by Application 2019 & 2032
- Table 105: Rest of Asia Pacific US Jam Jelly and Preserves Market Revenue (Million) Forecast, by Application 2019 & 2032
- Table 106: Rest of Asia Pacific US Jam Jelly and Preserves Market Volume (Liters) Forecast, by Application 2019 & 2032
Frequently Asked Questions
1. What is the projected Compound Annual Growth Rate (CAGR) of the US Jam Jelly and Preserves Market?
The projected CAGR is approximately 3.40%.
2. Which companies are prominent players in the US Jam Jelly and Preserves Market?
Key companies in the market include Murphy Orchards*List Not Exhaustive, B&G Foods Inc, Premier Foods Group Services Ltd, F Duerr & Sons Ltd, Wilkin & Sons Ltd, The Hain Celestial Group Inc, National Grape Cooperative Association, The J M Smucker Company, The Kraft Heinz Company, Andros Group, Conagra Foods Inc.
3. What are the main segments of the US Jam Jelly and Preserves Market?
The market segments include Product Type, Distribution Channel.
4. Can you provide details about the market size?
The market size is estimated to be USD 1430 Million as of 2022.
5. What are some drivers contributing to market growth?
Prevalence of Lactose Intolerance Driving the Market; Growing Influence of Healthy Lifestyle Trends and Rising Non-Traditional Users.
6. What are the notable trends driving market growth?
Increasing Demand for Organic Food Products.
7. Are there any restraints impacting market growth?
Wide Availability of Alternative Protein Sources.
8. Can you provide examples of recent developments in the market?
January 2023: Conagra Brands unveiled a new line of products, including the Snack Pack Starburst All Pink Juicy Gels. These delightful treats are specifically crafted with the signature all-pink flavor to replicate the irresistible experience of savoring a strawberry-flavored Starburst.
9. What pricing options are available for accessing the report?
Pricing options include single-user, multi-user, and enterprise licenses priced at USD 3800, USD 4500, and USD 5800 respectively.
10. Is the market size provided in terms of value or volume?
The market size is provided in terms of value, measured in Million and volume, measured in Liters.
11. Are there any specific market keywords associated with the report?
Yes, the market keyword associated with the report is "US Jam Jelly and Preserves Market," which aids in identifying and referencing the specific market segment covered.
12. How do I determine which pricing option suits my needs best?
The pricing options vary based on user requirements and access needs. Individual users may opt for single-user licenses, while businesses requiring broader access may choose multi-user or enterprise licenses for cost-effective access to the report.
13. Are there any additional resources or data provided in the US Jam Jelly and Preserves Market report?
While the report offers comprehensive insights, it's advisable to review the specific contents or supplementary materials provided to ascertain if additional resources or data are available.
14. How can I stay updated on further developments or reports in the US Jam Jelly and Preserves Market?
To stay informed about further developments, trends, and reports in the US Jam Jelly and Preserves Market, consider subscribing to industry newsletters, following relevant companies and organizations, or regularly checking reputable industry news sources and publications.
Methodology
Step 1 - Identification of Relevant Samples Size from Population Database


Step 2 - Approaches for Defining Global Market Size (Value, Volume* & Price*)

Note*: In applicable scenarios
Step 3 - Data Sources
Primary Research
- Web Analytics
- Survey Reports
- Research Institute
- Latest Research Reports
- Opinion Leaders
Secondary Research
- Annual Reports
- White Paper
- Latest Press Release
- Industry Association
- Paid Database
- Investor Presentations

Step 4 - Data Triangulation
Involves using different sources of information in order to increase the validity of a study
These sources are likely to be stakeholders in a program - participants, other researchers, program staff, other community members, and so on.
Then we put all data in single framework & apply various statistical tools to find out the dynamic on the market.
During the analysis stage, feedback from the stakeholder groups would be compared to determine areas of agreement as well as areas of divergence
