

Key Insights
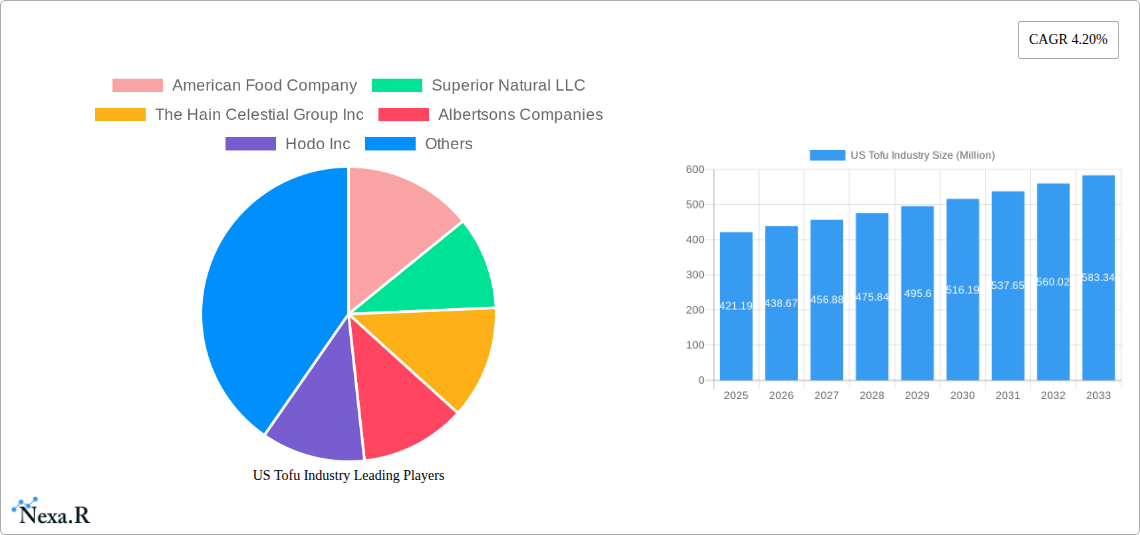
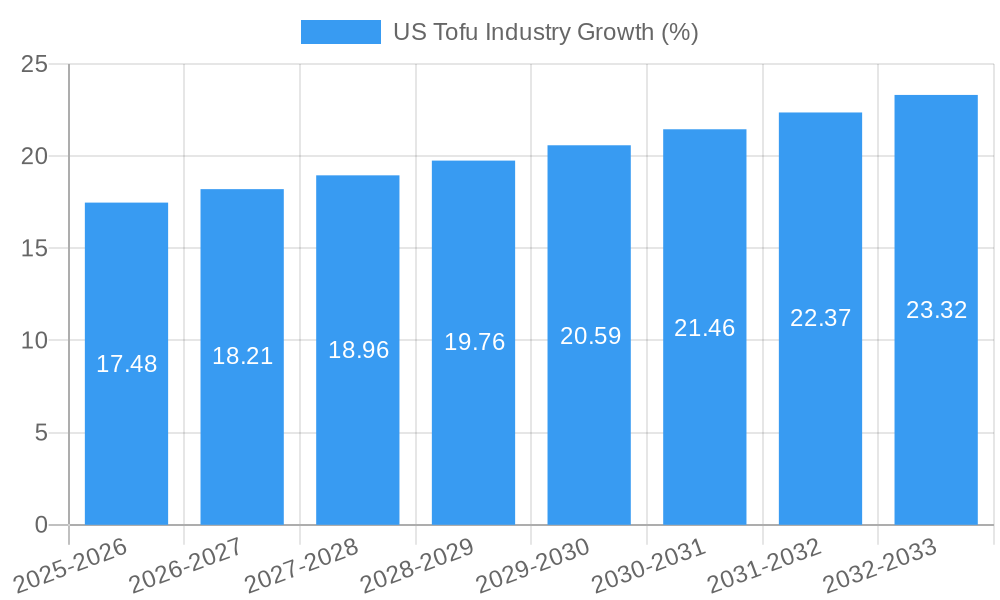
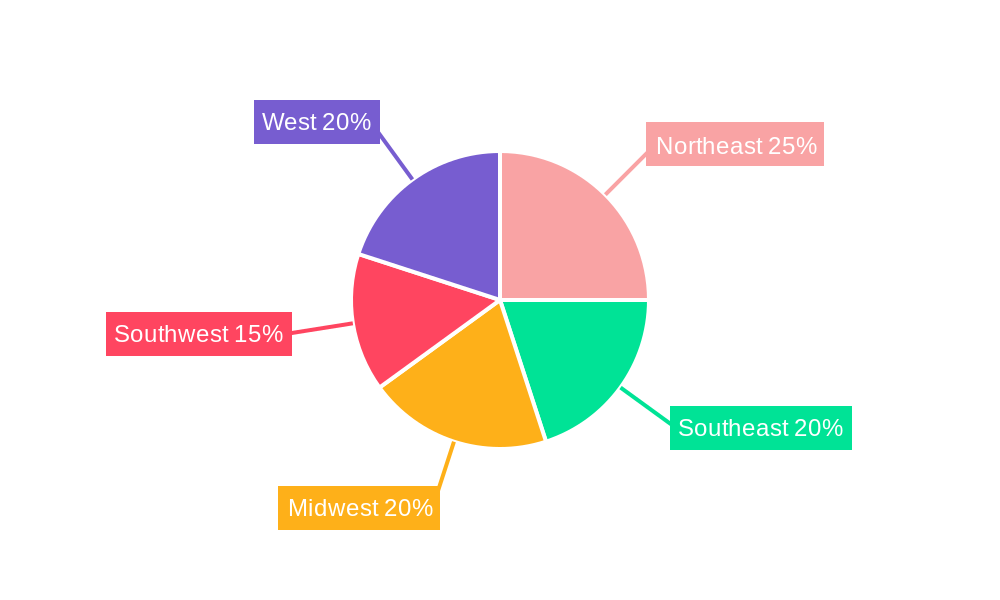
The US tofu market, valued at $421.19 million in 2025, is projected to experience robust growth, exhibiting a Compound Annual Growth Rate (CAGR) of 4.20% from 2025 to 2033. This expansion is fueled by several key drivers. The increasing popularity of plant-based diets and veganism among health-conscious consumers significantly contributes to market growth. Rising awareness of the health benefits associated with tofu, including its high protein content and low saturated fat, further fuels demand. The expanding availability of tofu in various forms, from traditional blocks to innovative ready-to-eat products, caters to diverse consumer preferences and lifestyles. Moreover, the growing presence of tofu in mainstream grocery stores and restaurants broadens market reach and accessibility. The market segmentation reveals a significant portion attributed to the off-trade distribution channel, indicating strong retail sales. Competitive landscape analysis reveals key players such as American Food Company, Superior Natural LLC, and The Hain Celestial Group Inc., among others, vying for market share through product innovation and strategic distribution partnerships. Regional variations exist within the US market, with potential growth opportunities varying across the Northeast, Southeast, Midwest, Southwest, and West regions based on factors such as consumer preferences and regional dietary habits. While precise regional market share data isn't provided, regional differences in adoption of plant-based diets and consumer spending will likely influence future growth patterns.
The market's growth trajectory is, however, subject to certain restraints. Fluctuations in the price of soybeans, the primary ingredient in tofu production, pose a potential challenge. Consumer perceptions regarding taste and texture, sometimes considered less appealing compared to meat-based alternatives, may also hinder wider adoption. Overcoming these challenges requires sustained efforts in product innovation, targeted marketing campaigns that highlight the versatility and taste profiles of tofu, and competitive pricing strategies. Continued exploration of new product formats and partnerships within the food service sector could propel market growth beyond current projections. Future growth depends on maintaining a balance between affordability, product innovation, and effective marketing strategies that highlight the health and environmental advantages of tofu in the context of current consumer trends.
US Tofu Industry Market Report: 2019-2033
This comprehensive report provides a detailed analysis of the US Tofu industry, encompassing market dynamics, growth trends, competitive landscape, and future outlook. The report covers the period from 2019 to 2033, with a base year of 2025 and a forecast period of 2025-2033. This in-depth study will be invaluable for industry professionals, investors, and anyone seeking to understand the current state and future trajectory of this dynamic market. The report's insights are derived from extensive market research and data analysis, providing a solid foundation for informed decision-making. The US Tofu market is segmented into various categories, including the parent market of plant-based foods and the child markets of silken tofu, firm tofu, and organic tofu. Furthermore, distribution channels are categorized as off-trade (retail) and on-trade (food service). Market size values are presented in millions of units.
US Tofu Industry Market Dynamics & Structure
The US tofu market exhibits a moderately fragmented structure, with several key players competing for market share. Technological innovation, particularly in product diversification and processing techniques, is a significant driver. Regulatory frameworks regarding food labeling and health claims influence market dynamics. Competitive substitutes include other plant-based protein sources like tempeh and seitan. End-user demographics are shifting towards younger, health-conscious consumers, fueling demand for organic and specialized tofu products. M&A activity, as evidenced by recent acquisitions, plays a significant role in consolidating market power and expanding product portfolios.
- Market Concentration: xx% market share held by the top 5 players in 2024.
- Technological Innovation: Focus on improved texture, flavor, and shelf life.
- Regulatory Framework: Compliance with FDA guidelines for labeling and food safety.
- Competitive Substitutes: Plant-based proteins (tempeh, seitan, etc.) pose competition.
- End-User Demographics: Growing demand driven by health-conscious millennials and Gen Z.
- M&A Trends: xx M&A deals in the past five years, indicating consolidation.
US Tofu Industry Growth Trends & Insights
The US tofu market is experiencing steady growth, driven by increasing consumer awareness of health benefits, dietary shifts towards plant-based diets, and the rise of veganism and vegetarianism. Technological advancements are leading to improved product quality and innovative applications, expanding the market reach. The adoption rate of tofu as a protein source is increasing significantly, especially among younger demographics. Consumer behavior is increasingly influenced by sustainability and ethical sourcing concerns, driving demand for organic and sustainably produced tofu.
- Market Size Evolution: The market size was estimated at xx million units in 2024 and is projected to reach xx million units by 2033.
- CAGR: The CAGR for the forecast period (2025-2033) is estimated at xx%.
- Market Penetration: xx% market penetration in 2024, projected to increase to xx% by 2033.
- Technological Disruptions: Advancements in processing and packaging technologies.
- Consumer Behavior Shifts: Growing preference for organic, non-GMO, and sustainably sourced tofu.
Dominant Regions, Countries, or Segments in US Tofu Industry
The Off-Trade distribution channel dominates the US tofu market, accounting for xx% of sales in 2024, driven by widespread retail availability in supermarkets, specialty stores, and online platforms. This is further fueled by increasing consumer preference for convenience and readily accessible options. Growth in this segment is also influenced by factors such as targeted marketing campaigns focused on plant-based diets and the increasing variety of tofu products available in retail settings.
- Off-Trade Dominance: High market share (xx%) attributed to convenient retail accessibility.
- Key Drivers: Extensive retail distribution networks, strong marketing campaigns, and diverse product offerings.
- Growth Potential: Continuous expansion into new retail channels and increased product diversification.
US Tofu Industry Product Landscape
The US tofu market offers a variety of products, including silken, firm, extra-firm, and organic tofu, catering to different culinary preferences and applications. Recent innovations focus on enhanced textures, flavors, and functional properties, broadening the appeal of tofu beyond its traditional applications. Products incorporating unique flavor profiles and convenient formats are gaining traction, expanding the market's reach and driving consumer interest. Technological advancements focus on improving production efficiency, reducing environmental impact, and enhancing product shelf life.
Key Drivers, Barriers & Challenges in US Tofu Industry
Key Drivers:
- Growing adoption of plant-based diets.
- Increasing health consciousness among consumers.
- Product innovation and diversification.
- Rising demand for organic and sustainably sourced food.
Challenges & Restraints:
- Competition from other plant-based protein sources.
- Price volatility of soy, the primary ingredient.
- Maintaining product quality and shelf life.
- Regulatory compliance and labeling requirements.
Emerging Opportunities in US Tofu Industry
Emerging opportunities lie in expanding into new market segments (e.g., functional foods, ready-to-eat meals), developing innovative product formats (e.g., shelf-stable tofu, tofu-based snacks), and exploring new flavors and applications. Targeting specific consumer demographics with tailored marketing strategies and capitalizing on the growing demand for convenience and sustainable food options present significant opportunities for growth. Exploring new protein sources and production methods to address environmental concerns is also a key area of opportunity.
Growth Accelerators in the US Tofu Industry
Technological advancements in production processes, leading to improved efficiency and reduced costs, will accelerate market growth. Strategic partnerships between tofu producers and food service companies will expand market reach and create new product opportunities. Expanding into new geographical markets and exploring export potential will further drive growth. Investing in research and development to enhance product quality and create innovative applications will fuel long-term market expansion.
Key Players Shaping the US Tofu Industry Market
- American Food Company
- Superior Natural LLC
- The Hain Celestial Group Inc
- Albertsons Companies
- Hodo Inc
- Pulmuone Corporate
- House Foods Group Inc
- Morinaga Milk Industry Co Ltd
Notable Milestones in US Tofu Industry Sector
- June 2022: Morinaga Nutritional Foods launched Mori-Nu Yuzu Flavored Silken Tofu.
- February 2023: Morinaga Nutritional Foods acquired Tofurky and Moocho.
- March 2023: Hodo launched Miso Tofu and Indian Spiced Tofu.
In-Depth US Tofu Industry Market Outlook
The US tofu industry is poised for continued growth, driven by the increasing popularity of plant-based diets, health consciousness, and product innovation. Strategic investments in research and development, sustainable practices, and efficient supply chains will be crucial for long-term success. The expanding market presents significant opportunities for both established players and new entrants, particularly those focusing on innovative products, sustainable practices, and targeted marketing strategies. The potential for market expansion is significant, particularly in regions with growing awareness of plant-based options.
US Tofu Industry Segmentation
-
1. Distribution Channel
-
1.1. Off-Trade
- 1.1.1. Convenience Stores
- 1.1.2. Online Channel
- 1.1.3. Supermarkets and Hypermarkets
- 1.1.4. Others
- 1.2. On-Trade
-
1.1. Off-Trade
US Tofu Industry Segmentation By Geography
-
1. North America
- 1.1. United States
- 1.2. Canada
- 1.3. Mexico
-
2. South America
- 2.1. Brazil
- 2.2. Argentina
- 2.3. Rest of South America
-
3. Europe
- 3.1. United Kingdom
- 3.2. Germany
- 3.3. France
- 3.4. Italy
- 3.5. Spain
- 3.6. Russia
- 3.7. Benelux
- 3.8. Nordics
- 3.9. Rest of Europe
-
4. Middle East & Africa
- 4.1. Turkey
- 4.2. Israel
- 4.3. GCC
- 4.4. North Africa
- 4.5. South Africa
- 4.6. Rest of Middle East & Africa
-
5. Asia Pacific
- 5.1. China
- 5.2. India
- 5.3. Japan
- 5.4. South Korea
- 5.5. ASEAN
- 5.6. Oceania
- 5.7. Rest of Asia Pacific
US Tofu Industry REPORT HIGHLIGHTS
| Aspects | Details |
|---|---|
| Study Period | 2019-2033 |
| Base Year | 2024 |
| Estimated Year | 2025 |
| Forecast Period | 2025-2033 |
| Historical Period | 2019-2024 |
| Growth Rate | CAGR of 4.20% from 2019-2033 |
| Segmentation |
|
Table of Contents
- 1. Introduction
- 1.1. Research Scope
- 1.2. Market Segmentation
- 1.3. Research Methodology
- 1.4. Definitions and Assumptions
- 2. Executive Summary
- 2.1. Introduction
- 3. Market Dynamics
- 3.1. Introduction
- 3.2. Market Drivers
- 3.2.1. Escalating Demand for Processed Poultry Products; Favorable Government Initiatives to Boost Production
- 3.3. Market Restrains
- 3.3.1. Rising Vegan Trend among Young Consumers; Deeper Penetration of Red Meat Across Saudi Arabia
- 3.4. Market Trends
- 3.4.1. Increasing demand for new variants in the tofu market through the expanded e-commerce channels drives the market
- 4. Market Factor Analysis
- 4.1. Porters Five Forces
- 4.2. Supply/Value Chain
- 4.3. PESTEL analysis
- 4.4. Market Entropy
- 4.5. Patent/Trademark Analysis
- 5. Global US Tofu Industry Analysis, Insights and Forecast, 2019-2031
- 5.1. Market Analysis, Insights and Forecast - by Distribution Channel
- 5.1.1. Off-Trade
- 5.1.1.1. Convenience Stores
- 5.1.1.2. Online Channel
- 5.1.1.3. Supermarkets and Hypermarkets
- 5.1.1.4. Others
- 5.1.2. On-Trade
- 5.1.1. Off-Trade
- 5.2. Market Analysis, Insights and Forecast - by Region
- 5.2.1. North America
- 5.2.2. South America
- 5.2.3. Europe
- 5.2.4. Middle East & Africa
- 5.2.5. Asia Pacific
- 5.1. Market Analysis, Insights and Forecast - by Distribution Channel
- 6. North America US Tofu Industry Analysis, Insights and Forecast, 2019-2031
- 6.1. Market Analysis, Insights and Forecast - by Distribution Channel
- 6.1.1. Off-Trade
- 6.1.1.1. Convenience Stores
- 6.1.1.2. Online Channel
- 6.1.1.3. Supermarkets and Hypermarkets
- 6.1.1.4. Others
- 6.1.2. On-Trade
- 6.1.1. Off-Trade
- 6.1. Market Analysis, Insights and Forecast - by Distribution Channel
- 7. South America US Tofu Industry Analysis, Insights and Forecast, 2019-2031
- 7.1. Market Analysis, Insights and Forecast - by Distribution Channel
- 7.1.1. Off-Trade
- 7.1.1.1. Convenience Stores
- 7.1.1.2. Online Channel
- 7.1.1.3. Supermarkets and Hypermarkets
- 7.1.1.4. Others
- 7.1.2. On-Trade
- 7.1.1. Off-Trade
- 7.1. Market Analysis, Insights and Forecast - by Distribution Channel
- 8. Europe US Tofu Industry Analysis, Insights and Forecast, 2019-2031
- 8.1. Market Analysis, Insights and Forecast - by Distribution Channel
- 8.1.1. Off-Trade
- 8.1.1.1. Convenience Stores
- 8.1.1.2. Online Channel
- 8.1.1.3. Supermarkets and Hypermarkets
- 8.1.1.4. Others
- 8.1.2. On-Trade
- 8.1.1. Off-Trade
- 8.1. Market Analysis, Insights and Forecast - by Distribution Channel
- 9. Middle East & Africa US Tofu Industry Analysis, Insights and Forecast, 2019-2031
- 9.1. Market Analysis, Insights and Forecast - by Distribution Channel
- 9.1.1. Off-Trade
- 9.1.1.1. Convenience Stores
- 9.1.1.2. Online Channel
- 9.1.1.3. Supermarkets and Hypermarkets
- 9.1.1.4. Others
- 9.1.2. On-Trade
- 9.1.1. Off-Trade
- 9.1. Market Analysis, Insights and Forecast - by Distribution Channel
- 10. Asia Pacific US Tofu Industry Analysis, Insights and Forecast, 2019-2031
- 10.1. Market Analysis, Insights and Forecast - by Distribution Channel
- 10.1.1. Off-Trade
- 10.1.1.1. Convenience Stores
- 10.1.1.2. Online Channel
- 10.1.1.3. Supermarkets and Hypermarkets
- 10.1.1.4. Others
- 10.1.2. On-Trade
- 10.1.1. Off-Trade
- 10.1. Market Analysis, Insights and Forecast - by Distribution Channel
- 11. Northeast US Tofu Industry Analysis, Insights and Forecast, 2019-2031
- 12. Southeast US Tofu Industry Analysis, Insights and Forecast, 2019-2031
- 13. Midwest US Tofu Industry Analysis, Insights and Forecast, 2019-2031
- 14. Southwest US Tofu Industry Analysis, Insights and Forecast, 2019-2031
- 15. West US Tofu Industry Analysis, Insights and Forecast, 2019-2031
- 16. Competitive Analysis
- 16.1. Global Market Share Analysis 2024
- 16.2. Company Profiles
- 16.2.1 American Food Company
- 16.2.1.1. Overview
- 16.2.1.2. Products
- 16.2.1.3. SWOT Analysis
- 16.2.1.4. Recent Developments
- 16.2.1.5. Financials (Based on Availability)
- 16.2.2 Superior Natural LLC
- 16.2.2.1. Overview
- 16.2.2.2. Products
- 16.2.2.3. SWOT Analysis
- 16.2.2.4. Recent Developments
- 16.2.2.5. Financials (Based on Availability)
- 16.2.3 The Hain Celestial Group Inc
- 16.2.3.1. Overview
- 16.2.3.2. Products
- 16.2.3.3. SWOT Analysis
- 16.2.3.4. Recent Developments
- 16.2.3.5. Financials (Based on Availability)
- 16.2.4 Albertsons Companies
- 16.2.4.1. Overview
- 16.2.4.2. Products
- 16.2.4.3. SWOT Analysis
- 16.2.4.4. Recent Developments
- 16.2.4.5. Financials (Based on Availability)
- 16.2.5 Hodo Inc
- 16.2.5.1. Overview
- 16.2.5.2. Products
- 16.2.5.3. SWOT Analysis
- 16.2.5.4. Recent Developments
- 16.2.5.5. Financials (Based on Availability)
- 16.2.6 Pulmuone Corporate
- 16.2.6.1. Overview
- 16.2.6.2. Products
- 16.2.6.3. SWOT Analysis
- 16.2.6.4. Recent Developments
- 16.2.6.5. Financials (Based on Availability)
- 16.2.7 House Foods Group Inc
- 16.2.7.1. Overview
- 16.2.7.2. Products
- 16.2.7.3. SWOT Analysis
- 16.2.7.4. Recent Developments
- 16.2.7.5. Financials (Based on Availability)
- 16.2.8 Morinaga Milk Industry Co Ltd
- 16.2.8.1. Overview
- 16.2.8.2. Products
- 16.2.8.3. SWOT Analysis
- 16.2.8.4. Recent Developments
- 16.2.8.5. Financials (Based on Availability)
- 16.2.1 American Food Company
List of Figures
- Figure 1: Global US Tofu Industry Revenue Breakdown (Million, %) by Region 2024 & 2032
- Figure 2: Global US Tofu Industry Volume Breakdown (K Tons, %) by Region 2024 & 2032
- Figure 3: United states US Tofu Industry Revenue (Million), by Country 2024 & 2032
- Figure 4: United states US Tofu Industry Volume (K Tons), by Country 2024 & 2032
- Figure 5: United states US Tofu Industry Revenue Share (%), by Country 2024 & 2032
- Figure 6: United states US Tofu Industry Volume Share (%), by Country 2024 & 2032
- Figure 7: North America US Tofu Industry Revenue (Million), by Distribution Channel 2024 & 2032
- Figure 8: North America US Tofu Industry Volume (K Tons), by Distribution Channel 2024 & 2032
- Figure 9: North America US Tofu Industry Revenue Share (%), by Distribution Channel 2024 & 2032
- Figure 10: North America US Tofu Industry Volume Share (%), by Distribution Channel 2024 & 2032
- Figure 11: North America US Tofu Industry Revenue (Million), by Country 2024 & 2032
- Figure 12: North America US Tofu Industry Volume (K Tons), by Country 2024 & 2032
- Figure 13: North America US Tofu Industry Revenue Share (%), by Country 2024 & 2032
- Figure 14: North America US Tofu Industry Volume Share (%), by Country 2024 & 2032
- Figure 15: South America US Tofu Industry Revenue (Million), by Distribution Channel 2024 & 2032
- Figure 16: South America US Tofu Industry Volume (K Tons), by Distribution Channel 2024 & 2032
- Figure 17: South America US Tofu Industry Revenue Share (%), by Distribution Channel 2024 & 2032
- Figure 18: South America US Tofu Industry Volume Share (%), by Distribution Channel 2024 & 2032
- Figure 19: South America US Tofu Industry Revenue (Million), by Country 2024 & 2032
- Figure 20: South America US Tofu Industry Volume (K Tons), by Country 2024 & 2032
- Figure 21: South America US Tofu Industry Revenue Share (%), by Country 2024 & 2032
- Figure 22: South America US Tofu Industry Volume Share (%), by Country 2024 & 2032
- Figure 23: Europe US Tofu Industry Revenue (Million), by Distribution Channel 2024 & 2032
- Figure 24: Europe US Tofu Industry Volume (K Tons), by Distribution Channel 2024 & 2032
- Figure 25: Europe US Tofu Industry Revenue Share (%), by Distribution Channel 2024 & 2032
- Figure 26: Europe US Tofu Industry Volume Share (%), by Distribution Channel 2024 & 2032
- Figure 27: Europe US Tofu Industry Revenue (Million), by Country 2024 & 2032
- Figure 28: Europe US Tofu Industry Volume (K Tons), by Country 2024 & 2032
- Figure 29: Europe US Tofu Industry Revenue Share (%), by Country 2024 & 2032
- Figure 30: Europe US Tofu Industry Volume Share (%), by Country 2024 & 2032
- Figure 31: Middle East & Africa US Tofu Industry Revenue (Million), by Distribution Channel 2024 & 2032
- Figure 32: Middle East & Africa US Tofu Industry Volume (K Tons), by Distribution Channel 2024 & 2032
- Figure 33: Middle East & Africa US Tofu Industry Revenue Share (%), by Distribution Channel 2024 & 2032
- Figure 34: Middle East & Africa US Tofu Industry Volume Share (%), by Distribution Channel 2024 & 2032
- Figure 35: Middle East & Africa US Tofu Industry Revenue (Million), by Country 2024 & 2032
- Figure 36: Middle East & Africa US Tofu Industry Volume (K Tons), by Country 2024 & 2032
- Figure 37: Middle East & Africa US Tofu Industry Revenue Share (%), by Country 2024 & 2032
- Figure 38: Middle East & Africa US Tofu Industry Volume Share (%), by Country 2024 & 2032
- Figure 39: Asia Pacific US Tofu Industry Revenue (Million), by Distribution Channel 2024 & 2032
- Figure 40: Asia Pacific US Tofu Industry Volume (K Tons), by Distribution Channel 2024 & 2032
- Figure 41: Asia Pacific US Tofu Industry Revenue Share (%), by Distribution Channel 2024 & 2032
- Figure 42: Asia Pacific US Tofu Industry Volume Share (%), by Distribution Channel 2024 & 2032
- Figure 43: Asia Pacific US Tofu Industry Revenue (Million), by Country 2024 & 2032
- Figure 44: Asia Pacific US Tofu Industry Volume (K Tons), by Country 2024 & 2032
- Figure 45: Asia Pacific US Tofu Industry Revenue Share (%), by Country 2024 & 2032
- Figure 46: Asia Pacific US Tofu Industry Volume Share (%), by Country 2024 & 2032
List of Tables
- Table 1: Global US Tofu Industry Revenue Million Forecast, by Region 2019 & 2032
- Table 2: Global US Tofu Industry Volume K Tons Forecast, by Region 2019 & 2032
- Table 3: Global US Tofu Industry Revenue Million Forecast, by Distribution Channel 2019 & 2032
- Table 4: Global US Tofu Industry Volume K Tons Forecast, by Distribution Channel 2019 & 2032
- Table 5: Global US Tofu Industry Revenue Million Forecast, by Region 2019 & 2032
- Table 6: Global US Tofu Industry Volume K Tons Forecast, by Region 2019 & 2032
- Table 7: Global US Tofu Industry Revenue Million Forecast, by Country 2019 & 2032
- Table 8: Global US Tofu Industry Volume K Tons Forecast, by Country 2019 & 2032
- Table 9: Northeast US Tofu Industry Revenue (Million) Forecast, by Application 2019 & 2032
- Table 10: Northeast US Tofu Industry Volume (K Tons) Forecast, by Application 2019 & 2032
- Table 11: Southeast US Tofu Industry Revenue (Million) Forecast, by Application 2019 & 2032
- Table 12: Southeast US Tofu Industry Volume (K Tons) Forecast, by Application 2019 & 2032
- Table 13: Midwest US Tofu Industry Revenue (Million) Forecast, by Application 2019 & 2032
- Table 14: Midwest US Tofu Industry Volume (K Tons) Forecast, by Application 2019 & 2032
- Table 15: Southwest US Tofu Industry Revenue (Million) Forecast, by Application 2019 & 2032
- Table 16: Southwest US Tofu Industry Volume (K Tons) Forecast, by Application 2019 & 2032
- Table 17: West US Tofu Industry Revenue (Million) Forecast, by Application 2019 & 2032
- Table 18: West US Tofu Industry Volume (K Tons) Forecast, by Application 2019 & 2032
- Table 19: Global US Tofu Industry Revenue Million Forecast, by Distribution Channel 2019 & 2032
- Table 20: Global US Tofu Industry Volume K Tons Forecast, by Distribution Channel 2019 & 2032
- Table 21: Global US Tofu Industry Revenue Million Forecast, by Country 2019 & 2032
- Table 22: Global US Tofu Industry Volume K Tons Forecast, by Country 2019 & 2032
- Table 23: United States US Tofu Industry Revenue (Million) Forecast, by Application 2019 & 2032
- Table 24: United States US Tofu Industry Volume (K Tons) Forecast, by Application 2019 & 2032
- Table 25: Canada US Tofu Industry Revenue (Million) Forecast, by Application 2019 & 2032
- Table 26: Canada US Tofu Industry Volume (K Tons) Forecast, by Application 2019 & 2032
- Table 27: Mexico US Tofu Industry Revenue (Million) Forecast, by Application 2019 & 2032
- Table 28: Mexico US Tofu Industry Volume (K Tons) Forecast, by Application 2019 & 2032
- Table 29: Global US Tofu Industry Revenue Million Forecast, by Distribution Channel 2019 & 2032
- Table 30: Global US Tofu Industry Volume K Tons Forecast, by Distribution Channel 2019 & 2032
- Table 31: Global US Tofu Industry Revenue Million Forecast, by Country 2019 & 2032
- Table 32: Global US Tofu Industry Volume K Tons Forecast, by Country 2019 & 2032
- Table 33: Brazil US Tofu Industry Revenue (Million) Forecast, by Application 2019 & 2032
- Table 34: Brazil US Tofu Industry Volume (K Tons) Forecast, by Application 2019 & 2032
- Table 35: Argentina US Tofu Industry Revenue (Million) Forecast, by Application 2019 & 2032
- Table 36: Argentina US Tofu Industry Volume (K Tons) Forecast, by Application 2019 & 2032
- Table 37: Rest of South America US Tofu Industry Revenue (Million) Forecast, by Application 2019 & 2032
- Table 38: Rest of South America US Tofu Industry Volume (K Tons) Forecast, by Application 2019 & 2032
- Table 39: Global US Tofu Industry Revenue Million Forecast, by Distribution Channel 2019 & 2032
- Table 40: Global US Tofu Industry Volume K Tons Forecast, by Distribution Channel 2019 & 2032
- Table 41: Global US Tofu Industry Revenue Million Forecast, by Country 2019 & 2032
- Table 42: Global US Tofu Industry Volume K Tons Forecast, by Country 2019 & 2032
- Table 43: United Kingdom US Tofu Industry Revenue (Million) Forecast, by Application 2019 & 2032
- Table 44: United Kingdom US Tofu Industry Volume (K Tons) Forecast, by Application 2019 & 2032
- Table 45: Germany US Tofu Industry Revenue (Million) Forecast, by Application 2019 & 2032
- Table 46: Germany US Tofu Industry Volume (K Tons) Forecast, by Application 2019 & 2032
- Table 47: France US Tofu Industry Revenue (Million) Forecast, by Application 2019 & 2032
- Table 48: France US Tofu Industry Volume (K Tons) Forecast, by Application 2019 & 2032
- Table 49: Italy US Tofu Industry Revenue (Million) Forecast, by Application 2019 & 2032
- Table 50: Italy US Tofu Industry Volume (K Tons) Forecast, by Application 2019 & 2032
- Table 51: Spain US Tofu Industry Revenue (Million) Forecast, by Application 2019 & 2032
- Table 52: Spain US Tofu Industry Volume (K Tons) Forecast, by Application 2019 & 2032
- Table 53: Russia US Tofu Industry Revenue (Million) Forecast, by Application 2019 & 2032
- Table 54: Russia US Tofu Industry Volume (K Tons) Forecast, by Application 2019 & 2032
- Table 55: Benelux US Tofu Industry Revenue (Million) Forecast, by Application 2019 & 2032
- Table 56: Benelux US Tofu Industry Volume (K Tons) Forecast, by Application 2019 & 2032
- Table 57: Nordics US Tofu Industry Revenue (Million) Forecast, by Application 2019 & 2032
- Table 58: Nordics US Tofu Industry Volume (K Tons) Forecast, by Application 2019 & 2032
- Table 59: Rest of Europe US Tofu Industry Revenue (Million) Forecast, by Application 2019 & 2032
- Table 60: Rest of Europe US Tofu Industry Volume (K Tons) Forecast, by Application 2019 & 2032
- Table 61: Global US Tofu Industry Revenue Million Forecast, by Distribution Channel 2019 & 2032
- Table 62: Global US Tofu Industry Volume K Tons Forecast, by Distribution Channel 2019 & 2032
- Table 63: Global US Tofu Industry Revenue Million Forecast, by Country 2019 & 2032
- Table 64: Global US Tofu Industry Volume K Tons Forecast, by Country 2019 & 2032
- Table 65: Turkey US Tofu Industry Revenue (Million) Forecast, by Application 2019 & 2032
- Table 66: Turkey US Tofu Industry Volume (K Tons) Forecast, by Application 2019 & 2032
- Table 67: Israel US Tofu Industry Revenue (Million) Forecast, by Application 2019 & 2032
- Table 68: Israel US Tofu Industry Volume (K Tons) Forecast, by Application 2019 & 2032
- Table 69: GCC US Tofu Industry Revenue (Million) Forecast, by Application 2019 & 2032
- Table 70: GCC US Tofu Industry Volume (K Tons) Forecast, by Application 2019 & 2032
- Table 71: North Africa US Tofu Industry Revenue (Million) Forecast, by Application 2019 & 2032
- Table 72: North Africa US Tofu Industry Volume (K Tons) Forecast, by Application 2019 & 2032
- Table 73: South Africa US Tofu Industry Revenue (Million) Forecast, by Application 2019 & 2032
- Table 74: South Africa US Tofu Industry Volume (K Tons) Forecast, by Application 2019 & 2032
- Table 75: Rest of Middle East & Africa US Tofu Industry Revenue (Million) Forecast, by Application 2019 & 2032
- Table 76: Rest of Middle East & Africa US Tofu Industry Volume (K Tons) Forecast, by Application 2019 & 2032
- Table 77: Global US Tofu Industry Revenue Million Forecast, by Distribution Channel 2019 & 2032
- Table 78: Global US Tofu Industry Volume K Tons Forecast, by Distribution Channel 2019 & 2032
- Table 79: Global US Tofu Industry Revenue Million Forecast, by Country 2019 & 2032
- Table 80: Global US Tofu Industry Volume K Tons Forecast, by Country 2019 & 2032
- Table 81: China US Tofu Industry Revenue (Million) Forecast, by Application 2019 & 2032
- Table 82: China US Tofu Industry Volume (K Tons) Forecast, by Application 2019 & 2032
- Table 83: India US Tofu Industry Revenue (Million) Forecast, by Application 2019 & 2032
- Table 84: India US Tofu Industry Volume (K Tons) Forecast, by Application 2019 & 2032
- Table 85: Japan US Tofu Industry Revenue (Million) Forecast, by Application 2019 & 2032
- Table 86: Japan US Tofu Industry Volume (K Tons) Forecast, by Application 2019 & 2032
- Table 87: South Korea US Tofu Industry Revenue (Million) Forecast, by Application 2019 & 2032
- Table 88: South Korea US Tofu Industry Volume (K Tons) Forecast, by Application 2019 & 2032
- Table 89: ASEAN US Tofu Industry Revenue (Million) Forecast, by Application 2019 & 2032
- Table 90: ASEAN US Tofu Industry Volume (K Tons) Forecast, by Application 2019 & 2032
- Table 91: Oceania US Tofu Industry Revenue (Million) Forecast, by Application 2019 & 2032
- Table 92: Oceania US Tofu Industry Volume (K Tons) Forecast, by Application 2019 & 2032
- Table 93: Rest of Asia Pacific US Tofu Industry Revenue (Million) Forecast, by Application 2019 & 2032
- Table 94: Rest of Asia Pacific US Tofu Industry Volume (K Tons) Forecast, by Application 2019 & 2032
Frequently Asked Questions
1. What is the projected Compound Annual Growth Rate (CAGR) of the US Tofu Industry?
The projected CAGR is approximately 4.20%.
2. Which companies are prominent players in the US Tofu Industry?
Key companies in the market include American Food Company, Superior Natural LLC, The Hain Celestial Group Inc, Albertsons Companies, Hodo Inc, Pulmuone Corporate, House Foods Group Inc, Morinaga Milk Industry Co Ltd.
3. What are the main segments of the US Tofu Industry?
The market segments include Distribution Channel.
4. Can you provide details about the market size?
The market size is estimated to be USD 421.19 Million as of 2022.
5. What are some drivers contributing to market growth?
Escalating Demand for Processed Poultry Products; Favorable Government Initiatives to Boost Production.
6. What are the notable trends driving market growth?
Increasing demand for new variants in the tofu market through the expanded e-commerce channels drives the market.
7. Are there any restraints impacting market growth?
Rising Vegan Trend among Young Consumers; Deeper Penetration of Red Meat Across Saudi Arabia.
8. Can you provide examples of recent developments in the market?
March 2023: Hodo launched two new block tofus with vibrant global flavors which include Miso Tofu and Indian Spiced Tofu.February 2023: Morinaga Nutritional Foods acquired US plant-based company, Tofurky and its sister brand Moocho. Morinaga has been a tofu supplier for Tofurky products for 17 years. The acquisition of Tofurky and Moocho will help the company to strengthen the integrated supply chain and category growth for the brands.June 2022: Morinaga Nutritional Foods launched Mori-Nu Yuzu Flavored Silken Tofu, known for its velvety smooth texture. The product has a firm texture, is versatile, and can be added to desserts or blended for preparation.
9. What pricing options are available for accessing the report?
Pricing options include single-user, multi-user, and enterprise licenses priced at USD 3800, USD 4500, and USD 5800 respectively.
10. Is the market size provided in terms of value or volume?
The market size is provided in terms of value, measured in Million and volume, measured in K Tons.
11. Are there any specific market keywords associated with the report?
Yes, the market keyword associated with the report is "US Tofu Industry," which aids in identifying and referencing the specific market segment covered.
12. How do I determine which pricing option suits my needs best?
The pricing options vary based on user requirements and access needs. Individual users may opt for single-user licenses, while businesses requiring broader access may choose multi-user or enterprise licenses for cost-effective access to the report.
13. Are there any additional resources or data provided in the US Tofu Industry report?
While the report offers comprehensive insights, it's advisable to review the specific contents or supplementary materials provided to ascertain if additional resources or data are available.
14. How can I stay updated on further developments or reports in the US Tofu Industry?
To stay informed about further developments, trends, and reports in the US Tofu Industry, consider subscribing to industry newsletters, following relevant companies and organizations, or regularly checking reputable industry news sources and publications.
Methodology
Step 1 - Identification of Relevant Samples Size from Population Database


Step 2 - Approaches for Defining Global Market Size (Value, Volume* & Price*)

Note*: In applicable scenarios
Step 3 - Data Sources
Primary Research
- Web Analytics
- Survey Reports
- Research Institute
- Latest Research Reports
- Opinion Leaders
Secondary Research
- Annual Reports
- White Paper
- Latest Press Release
- Industry Association
- Paid Database
- Investor Presentations

Step 4 - Data Triangulation
Involves using different sources of information in order to increase the validity of a study
These sources are likely to be stakeholders in a program - participants, other researchers, program staff, other community members, and so on.
Then we put all data in single framework & apply various statistical tools to find out the dynamic on the market.
During the analysis stage, feedback from the stakeholder groups would be compared to determine areas of agreement as well as areas of divergence
