

Key Insights
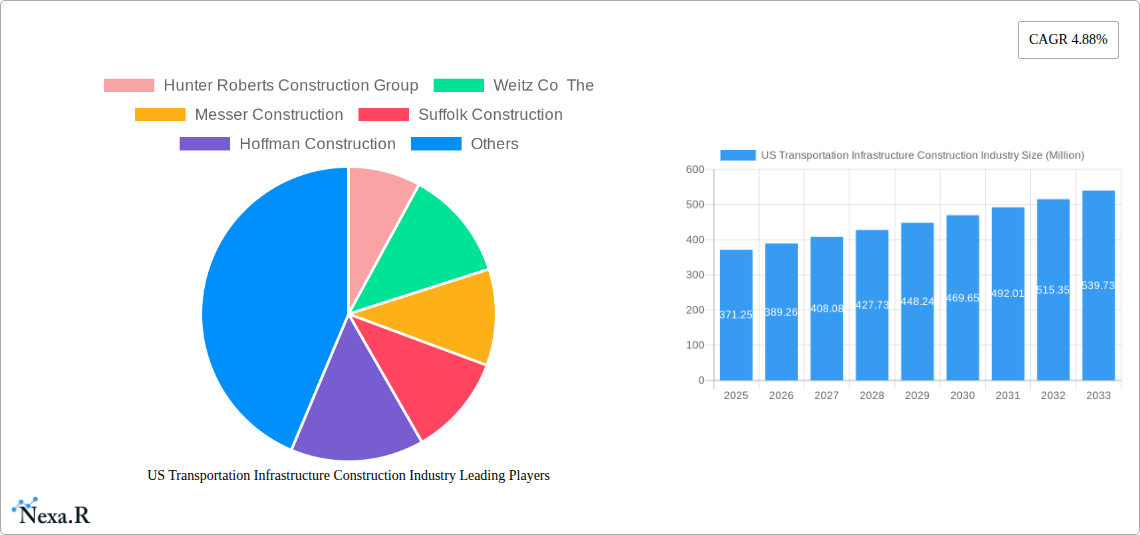
The US transportation infrastructure construction industry, valued at $371.25 million in 2025, is projected to experience robust growth, driven by increasing urbanization, aging infrastructure, and government initiatives focused on improving connectivity and sustainability. The 4.88% CAGR from 2025 to 2033 indicates a significant expansion of the market, with substantial investment needed to address the backlog of repairs and upgrades across roadways, railways, airports, ports, and inland waterways. Key drivers include the Bipartisan Infrastructure Law, which allocates significant funding for infrastructure improvements, alongside a rising demand for efficient and resilient transportation systems to support economic growth and population mobility. Growth will likely be regionally diverse, with states experiencing rapid population growth and significant economic activity potentially witnessing higher investment. Challenges include material cost inflation, supply chain disruptions, and skilled labor shortages, which could impact project timelines and overall market growth. However, innovative construction techniques, such as prefabrication and modular construction, are expected to mitigate some of these challenges and enhance efficiency. The competitive landscape includes both large multinational firms and regional contractors, emphasizing the need for strong project management capabilities and strategic partnerships to secure contracts.
The segmentation by type (roadways, railways, airports, ports, and inland waterways) highlights the diverse opportunities within the market. Roadways are likely to remain a dominant segment due to extensive network coverage and ongoing maintenance requirements. Railways, airports, and ports will see increasing investments focused on capacity expansion and modernization to handle growing freight and passenger volumes. The inland waterways segment may witness slower but consistent growth driven by improved logistics and reduced transportation costs. Competitive analysis reveals that major players like AECOM, Skanska USA, and Balfour Beatty US will actively compete for large-scale projects, while regional contractors will focus on smaller, localized projects. Successful players will need to demonstrate expertise in sustainable construction practices, technological innovation, and efficient project delivery to thrive in this dynamic market.
US Transportation Infrastructure Construction Industry Market Report: 2019-2033
This comprehensive report provides a detailed analysis of the US Transportation Infrastructure Construction Industry, encompassing market dynamics, growth trends, key players, and future outlook. The study period covers 2019-2033, with a base year of 2025 and a forecast period of 2025-2033. This report is essential for industry professionals, investors, and policymakers seeking a deep understanding of this vital sector. The parent market is the broader US Construction industry, and the child markets analyzed include Roadways, Railways, Airports, Ports and Inland Waterways.
US Transportation Infrastructure Construction Industry Market Dynamics & Structure
The US transportation infrastructure construction market is characterized by moderate concentration, with a few large players alongside numerous smaller firms. Technological innovation, particularly in materials science and construction management software, is a key driver. Stringent regulatory frameworks, including environmental regulations and safety standards, significantly impact operations. While concrete and steel remain dominant materials, alternatives like composite materials are gaining traction. End-user demographics are diverse, encompassing federal, state, and local governments, as well as private entities. The M&A landscape is active, driven by consolidation efforts and expansion into new technologies.
- Market Concentration: Moderately concentrated, with the top 5 firms holding an estimated xx% market share in 2025.
- Technological Innovation: Adoption of Building Information Modeling (BIM), automation, and advanced materials driving efficiency gains.
- Regulatory Framework: Compliance costs and permitting delays present challenges. Stringent environmental regulations are driving innovation in sustainable construction practices.
- Competitive Substitutes: Limited direct substitutes, but alternative construction methods and materials exert indirect competition.
- End-User Demographics: Federal, state, and local government agencies constitute the largest segment, followed by private sector developers and toll operators.
- M&A Trends: Consolidation is expected to continue, with an estimated xx M&A deals annually in the forecast period. Deals are mainly driven by expansion into new segments and technologies.
US Transportation Infrastructure Construction Industry Growth Trends & Insights
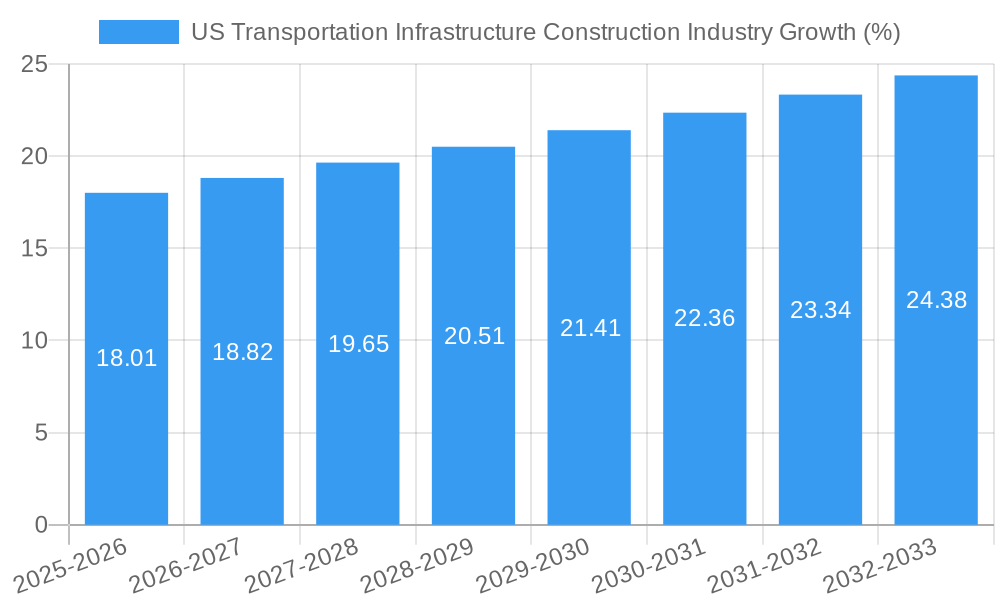
The US transportation infrastructure construction market experienced robust growth during the historical period (2019-2024), driven by increasing government spending on infrastructure projects and private investment. The market size reached USD xx million in 2024, and is projected to reach USD xx million by 2033, exhibiting a CAGR of xx% during the forecast period. Technological advancements, such as automation and the use of sustainable materials, are accelerating adoption and improving efficiency. Consumer preferences are shifting towards more resilient and environmentally friendly infrastructure. However, supply chain disruptions and labor shortages are posing challenges.
- Market Size (2024): USD xx million
- Projected Market Size (2033): USD xx million
- CAGR (2025-2033): xx%
- Market Penetration (2025): xx%
Dominant Regions, Countries, or Segments in US Transportation Infrastructure Construction Industry
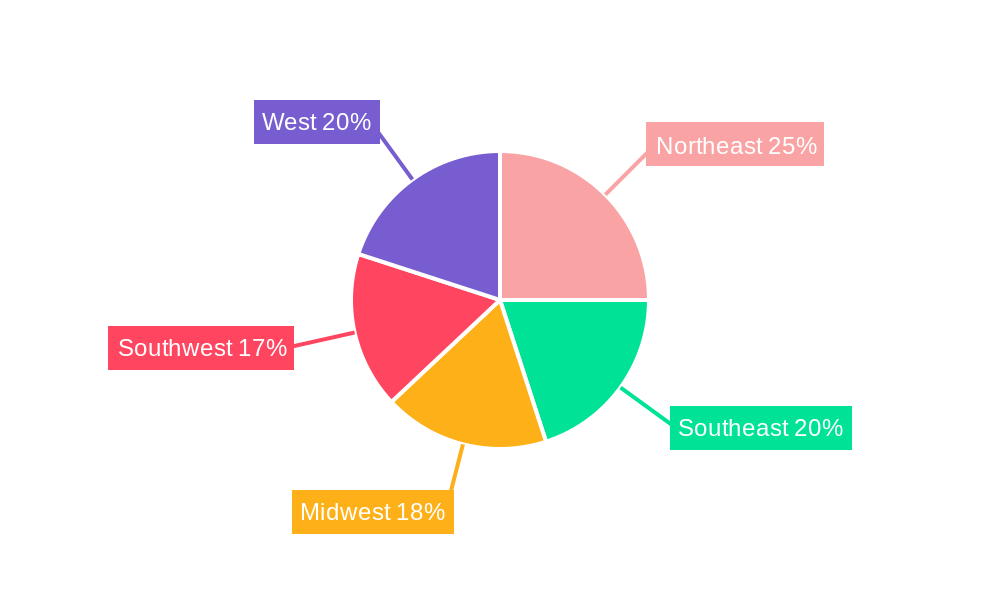
The Roadways segment dominates the US transportation infrastructure construction market, driven by the extensive network of highways and the ongoing need for maintenance and expansion. Significant government investment in highway projects, coupled with increasing urbanization and traffic congestion, fuels this segment's growth. The Northeast and Southern regions are key growth areas due to high population density and significant infrastructure development plans. Airports are also a rapidly expanding segment, fueled by rising air travel demand and government investments in airport modernization.
- Roadways: Largest segment, driven by extensive existing infrastructure and continuous expansion needs.
- Railways: Growth driven by investments in high-speed rail and freight networks.
- Airports: Significant expansion and modernization projects fueling high growth potential.
- Ports and Inland Waterways: Growth driven by increasing global trade and need for modernization of port facilities.
US Transportation Infrastructure Construction Industry Product Landscape
The product landscape includes a diverse range of construction materials, equipment, and services. Innovation focuses on sustainable, high-performance materials and technologies that enhance efficiency and reduce environmental impact. Products are increasingly integrated with advanced monitoring and management systems. Unique selling propositions include durability, cost-effectiveness, and environmental sustainability.
Key Drivers, Barriers & Challenges in US Transportation Infrastructure Construction Industry
Key Drivers: Increased government spending on infrastructure projects (e.g., Bipartisan Infrastructure Law), growing urbanization, and technological advancements are key drivers. Demand for improved transportation efficiency and safety also fuels the market.
Key Challenges: Supply chain disruptions, labor shortages, and fluctuating material prices impact project timelines and costs. Regulatory hurdles and permitting delays present significant challenges. Intense competition among construction firms adds pressure on pricing and profitability.
Emerging Opportunities in US Transportation Infrastructure Construction Industry
Emerging opportunities include the development of smart infrastructure, integrating technology for improved monitoring and management. The expansion of electric vehicle charging infrastructure and the adoption of innovative construction methods and materials also present significant growth potential. The development of vertiports for eVTOLs presents a new niche market.
Growth Accelerators in the US Transportation Infrastructure Construction Industry
Government initiatives promoting sustainable infrastructure and the adoption of advanced technologies are key growth accelerators. Strategic partnerships between construction firms and technology providers are driving innovation. Expansion into new segments, such as the development of electric vehicle charging infrastructure and vertiports, offers significant growth potential.
Key Players Shaping the US Transportation Infrastructure Construction Industry Market
- Hunter Roberts Construction Group
- Weitz Co The
- Messer Construction
- Suffolk Construction
- Hoffman Construction
- Jacobs
- Turner Construction Co
- Clune Construction
- Whiting-Turner Contracting Co The
- VRH Construction
- Walsh Group The
- Clark Group
- Balfour Beatty US
- Webcor Builders
- Wendel
- LeChase Construction
- AECOM
- Hill Intl
- Skanska USA
- PCL Construction Enterprises (List Not Exhaustive)
Notable Milestones in US Transportation Infrastructure Construction Industry Sector
- September 2023: FMCSA announced over USD 80 million in grant awards under President Biden's Bipartisan Infrastructure Law, boosting safety initiatives for commercial motor vehicles.
- November 2022: Wisconsin DOT awarded a USD 201 million contract for I-43 expansion, highlighting significant state-level investment in highway infrastructure.
- September 2022: AECOM completed a due diligence framework for a Florida vertiport network, signaling the emergence of air mobility as a new market segment.
In-Depth US Transportation Infrastructure Construction Industry Market Outlook
The US transportation infrastructure construction market is poised for continued growth, driven by ongoing government investment, technological advancements, and increasing demand for efficient and sustainable transportation systems. The market’s future potential is significant, particularly in segments such as smart infrastructure, electric vehicle charging, and air mobility. Strategic opportunities exist for firms that can effectively leverage technological innovation, build strong partnerships, and adapt to evolving regulatory landscapes.
US Transportation Infrastructure Construction Industry Segmentation
-
1. Type
- 1.1. Roadways
- 1.2. Railways
- 1.3. Airports
- 1.4. Ports and Inland Waterways
US Transportation Infrastructure Construction Industry Segmentation By Geography
-
1. North America
- 1.1. United States
- 1.2. Canada
- 1.3. Mexico
-
2. South America
- 2.1. Brazil
- 2.2. Argentina
- 2.3. Rest of South America
-
3. Europe
- 3.1. United Kingdom
- 3.2. Germany
- 3.3. France
- 3.4. Italy
- 3.5. Spain
- 3.6. Russia
- 3.7. Benelux
- 3.8. Nordics
- 3.9. Rest of Europe
-
4. Middle East & Africa
- 4.1. Turkey
- 4.2. Israel
- 4.3. GCC
- 4.4. North Africa
- 4.5. South Africa
- 4.6. Rest of Middle East & Africa
-
5. Asia Pacific
- 5.1. China
- 5.2. India
- 5.3. Japan
- 5.4. South Korea
- 5.5. ASEAN
- 5.6. Oceania
- 5.7. Rest of Asia Pacific
US Transportation Infrastructure Construction Industry REPORT HIGHLIGHTS
| Aspects | Details |
|---|---|
| Study Period | 2019-2033 |
| Base Year | 2024 |
| Estimated Year | 2025 |
| Forecast Period | 2025-2033 |
| Historical Period | 2019-2024 |
| Growth Rate | CAGR of 4.88% from 2019-2033 |
| Segmentation |
|
Table of Contents
- 1. Introduction
- 1.1. Research Scope
- 1.2. Market Segmentation
- 1.3. Research Methodology
- 1.4. Definitions and Assumptions
- 2. Executive Summary
- 2.1. Introduction
- 3. Market Dynamics
- 3.1. Introduction
- 3.2. Market Drivers
- 3.2.1. 4.; Increase In Tourism Industry4.; Sustainability and Environmental Concerns
- 3.3. Market Restrains
- 3.3.1. 4.; Financial Constraints4.; High Maintenance
- 3.4. Market Trends
- 3.4.1. Government Initiatives for Infrastructural Development to Boost the Market
- 4. Market Factor Analysis
- 4.1. Porters Five Forces
- 4.2. Supply/Value Chain
- 4.3. PESTEL analysis
- 4.4. Market Entropy
- 4.5. Patent/Trademark Analysis
- 5. Global US Transportation Infrastructure Construction Industry Analysis, Insights and Forecast, 2019-2031
- 5.1. Market Analysis, Insights and Forecast - by Type
- 5.1.1. Roadways
- 5.1.2. Railways
- 5.1.3. Airports
- 5.1.4. Ports and Inland Waterways
- 5.2. Market Analysis, Insights and Forecast - by Region
- 5.2.1. North America
- 5.2.2. South America
- 5.2.3. Europe
- 5.2.4. Middle East & Africa
- 5.2.5. Asia Pacific
- 5.1. Market Analysis, Insights and Forecast - by Type
- 6. North America US Transportation Infrastructure Construction Industry Analysis, Insights and Forecast, 2019-2031
- 6.1. Market Analysis, Insights and Forecast - by Type
- 6.1.1. Roadways
- 6.1.2. Railways
- 6.1.3. Airports
- 6.1.4. Ports and Inland Waterways
- 6.1. Market Analysis, Insights and Forecast - by Type
- 7. South America US Transportation Infrastructure Construction Industry Analysis, Insights and Forecast, 2019-2031
- 7.1. Market Analysis, Insights and Forecast - by Type
- 7.1.1. Roadways
- 7.1.2. Railways
- 7.1.3. Airports
- 7.1.4. Ports and Inland Waterways
- 7.1. Market Analysis, Insights and Forecast - by Type
- 8. Europe US Transportation Infrastructure Construction Industry Analysis, Insights and Forecast, 2019-2031
- 8.1. Market Analysis, Insights and Forecast - by Type
- 8.1.1. Roadways
- 8.1.2. Railways
- 8.1.3. Airports
- 8.1.4. Ports and Inland Waterways
- 8.1. Market Analysis, Insights and Forecast - by Type
- 9. Middle East & Africa US Transportation Infrastructure Construction Industry Analysis, Insights and Forecast, 2019-2031
- 9.1. Market Analysis, Insights and Forecast - by Type
- 9.1.1. Roadways
- 9.1.2. Railways
- 9.1.3. Airports
- 9.1.4. Ports and Inland Waterways
- 9.1. Market Analysis, Insights and Forecast - by Type
- 10. Asia Pacific US Transportation Infrastructure Construction Industry Analysis, Insights and Forecast, 2019-2031
- 10.1. Market Analysis, Insights and Forecast - by Type
- 10.1.1. Roadways
- 10.1.2. Railways
- 10.1.3. Airports
- 10.1.4. Ports and Inland Waterways
- 10.1. Market Analysis, Insights and Forecast - by Type
- 11. Northeast US Transportation Infrastructure Construction Industry Analysis, Insights and Forecast, 2019-2031
- 12. Southeast US Transportation Infrastructure Construction Industry Analysis, Insights and Forecast, 2019-2031
- 13. Midwest US Transportation Infrastructure Construction Industry Analysis, Insights and Forecast, 2019-2031
- 14. Southwest US Transportation Infrastructure Construction Industry Analysis, Insights and Forecast, 2019-2031
- 15. West US Transportation Infrastructure Construction Industry Analysis, Insights and Forecast, 2019-2031
- 16. Competitive Analysis
- 16.1. Global Market Share Analysis 2024
- 16.2. Company Profiles
- 16.2.1 Hunter Roberts Construction Group
- 16.2.1.1. Overview
- 16.2.1.2. Products
- 16.2.1.3. SWOT Analysis
- 16.2.1.4. Recent Developments
- 16.2.1.5. Financials (Based on Availability)
- 16.2.2 Weitz Co The
- 16.2.2.1. Overview
- 16.2.2.2. Products
- 16.2.2.3. SWOT Analysis
- 16.2.2.4. Recent Developments
- 16.2.2.5. Financials (Based on Availability)
- 16.2.3 Messer Construction
- 16.2.3.1. Overview
- 16.2.3.2. Products
- 16.2.3.3. SWOT Analysis
- 16.2.3.4. Recent Developments
- 16.2.3.5. Financials (Based on Availability)
- 16.2.4 Suffolk Construction
- 16.2.4.1. Overview
- 16.2.4.2. Products
- 16.2.4.3. SWOT Analysis
- 16.2.4.4. Recent Developments
- 16.2.4.5. Financials (Based on Availability)
- 16.2.5 Hoffman Construction
- 16.2.5.1. Overview
- 16.2.5.2. Products
- 16.2.5.3. SWOT Analysis
- 16.2.5.4. Recent Developments
- 16.2.5.5. Financials (Based on Availability)
- 16.2.6 Jacobs
- 16.2.6.1. Overview
- 16.2.6.2. Products
- 16.2.6.3. SWOT Analysis
- 16.2.6.4. Recent Developments
- 16.2.6.5. Financials (Based on Availability)
- 16.2.7 Turner Construction Co
- 16.2.7.1. Overview
- 16.2.7.2. Products
- 16.2.7.3. SWOT Analysis
- 16.2.7.4. Recent Developments
- 16.2.7.5. Financials (Based on Availability)
- 16.2.8 Clune Construction
- 16.2.8.1. Overview
- 16.2.8.2. Products
- 16.2.8.3. SWOT Analysis
- 16.2.8.4. Recent Developments
- 16.2.8.5. Financials (Based on Availability)
- 16.2.9 Whiting-Turner Contracting Co The
- 16.2.9.1. Overview
- 16.2.9.2. Products
- 16.2.9.3. SWOT Analysis
- 16.2.9.4. Recent Developments
- 16.2.9.5. Financials (Based on Availability)
- 16.2.10 VRH Construction
- 16.2.10.1. Overview
- 16.2.10.2. Products
- 16.2.10.3. SWOT Analysis
- 16.2.10.4. Recent Developments
- 16.2.10.5. Financials (Based on Availability)
- 16.2.11 Walsh Group The
- 16.2.11.1. Overview
- 16.2.11.2. Products
- 16.2.11.3. SWOT Analysis
- 16.2.11.4. Recent Developments
- 16.2.11.5. Financials (Based on Availability)
- 16.2.12 Clark Group
- 16.2.12.1. Overview
- 16.2.12.2. Products
- 16.2.12.3. SWOT Analysis
- 16.2.12.4. Recent Developments
- 16.2.12.5. Financials (Based on Availability)
- 16.2.13 Balfour Beatty US
- 16.2.13.1. Overview
- 16.2.13.2. Products
- 16.2.13.3. SWOT Analysis
- 16.2.13.4. Recent Developments
- 16.2.13.5. Financials (Based on Availability)
- 16.2.14 Webcor Builders
- 16.2.14.1. Overview
- 16.2.14.2. Products
- 16.2.14.3. SWOT Analysis
- 16.2.14.4. Recent Developments
- 16.2.14.5. Financials (Based on Availability)
- 16.2.15 Wendel
- 16.2.15.1. Overview
- 16.2.15.2. Products
- 16.2.15.3. SWOT Analysis
- 16.2.15.4. Recent Developments
- 16.2.15.5. Financials (Based on Availability)
- 16.2.16 LeChase Construction**List Not Exhaustive
- 16.2.16.1. Overview
- 16.2.16.2. Products
- 16.2.16.3. SWOT Analysis
- 16.2.16.4. Recent Developments
- 16.2.16.5. Financials (Based on Availability)
- 16.2.17 AECOM
- 16.2.17.1. Overview
- 16.2.17.2. Products
- 16.2.17.3. SWOT Analysis
- 16.2.17.4. Recent Developments
- 16.2.17.5. Financials (Based on Availability)
- 16.2.18 Hill Intl
- 16.2.18.1. Overview
- 16.2.18.2. Products
- 16.2.18.3. SWOT Analysis
- 16.2.18.4. Recent Developments
- 16.2.18.5. Financials (Based on Availability)
- 16.2.19 Skanska USA
- 16.2.19.1. Overview
- 16.2.19.2. Products
- 16.2.19.3. SWOT Analysis
- 16.2.19.4. Recent Developments
- 16.2.19.5. Financials (Based on Availability)
- 16.2.20 PCL Construction Enterprises
- 16.2.20.1. Overview
- 16.2.20.2. Products
- 16.2.20.3. SWOT Analysis
- 16.2.20.4. Recent Developments
- 16.2.20.5. Financials (Based on Availability)
- 16.2.1 Hunter Roberts Construction Group
List of Figures
- Figure 1: Global US Transportation Infrastructure Construction Industry Revenue Breakdown (Million, %) by Region 2024 & 2032
- Figure 2: United states US Transportation Infrastructure Construction Industry Revenue (Million), by Country 2024 & 2032
- Figure 3: United states US Transportation Infrastructure Construction Industry Revenue Share (%), by Country 2024 & 2032
- Figure 4: North America US Transportation Infrastructure Construction Industry Revenue (Million), by Type 2024 & 2032
- Figure 5: North America US Transportation Infrastructure Construction Industry Revenue Share (%), by Type 2024 & 2032
- Figure 6: North America US Transportation Infrastructure Construction Industry Revenue (Million), by Country 2024 & 2032
- Figure 7: North America US Transportation Infrastructure Construction Industry Revenue Share (%), by Country 2024 & 2032
- Figure 8: South America US Transportation Infrastructure Construction Industry Revenue (Million), by Type 2024 & 2032
- Figure 9: South America US Transportation Infrastructure Construction Industry Revenue Share (%), by Type 2024 & 2032
- Figure 10: South America US Transportation Infrastructure Construction Industry Revenue (Million), by Country 2024 & 2032
- Figure 11: South America US Transportation Infrastructure Construction Industry Revenue Share (%), by Country 2024 & 2032
- Figure 12: Europe US Transportation Infrastructure Construction Industry Revenue (Million), by Type 2024 & 2032
- Figure 13: Europe US Transportation Infrastructure Construction Industry Revenue Share (%), by Type 2024 & 2032
- Figure 14: Europe US Transportation Infrastructure Construction Industry Revenue (Million), by Country 2024 & 2032
- Figure 15: Europe US Transportation Infrastructure Construction Industry Revenue Share (%), by Country 2024 & 2032
- Figure 16: Middle East & Africa US Transportation Infrastructure Construction Industry Revenue (Million), by Type 2024 & 2032
- Figure 17: Middle East & Africa US Transportation Infrastructure Construction Industry Revenue Share (%), by Type 2024 & 2032
- Figure 18: Middle East & Africa US Transportation Infrastructure Construction Industry Revenue (Million), by Country 2024 & 2032
- Figure 19: Middle East & Africa US Transportation Infrastructure Construction Industry Revenue Share (%), by Country 2024 & 2032
- Figure 20: Asia Pacific US Transportation Infrastructure Construction Industry Revenue (Million), by Type 2024 & 2032
- Figure 21: Asia Pacific US Transportation Infrastructure Construction Industry Revenue Share (%), by Type 2024 & 2032
- Figure 22: Asia Pacific US Transportation Infrastructure Construction Industry Revenue (Million), by Country 2024 & 2032
- Figure 23: Asia Pacific US Transportation Infrastructure Construction Industry Revenue Share (%), by Country 2024 & 2032
List of Tables
- Table 1: Global US Transportation Infrastructure Construction Industry Revenue Million Forecast, by Region 2019 & 2032
- Table 2: Global US Transportation Infrastructure Construction Industry Revenue Million Forecast, by Type 2019 & 2032
- Table 3: Global US Transportation Infrastructure Construction Industry Revenue Million Forecast, by Region 2019 & 2032
- Table 4: Global US Transportation Infrastructure Construction Industry Revenue Million Forecast, by Country 2019 & 2032
- Table 5: Northeast US Transportation Infrastructure Construction Industry Revenue (Million) Forecast, by Application 2019 & 2032
- Table 6: Southeast US Transportation Infrastructure Construction Industry Revenue (Million) Forecast, by Application 2019 & 2032
- Table 7: Midwest US Transportation Infrastructure Construction Industry Revenue (Million) Forecast, by Application 2019 & 2032
- Table 8: Southwest US Transportation Infrastructure Construction Industry Revenue (Million) Forecast, by Application 2019 & 2032
- Table 9: West US Transportation Infrastructure Construction Industry Revenue (Million) Forecast, by Application 2019 & 2032
- Table 10: Global US Transportation Infrastructure Construction Industry Revenue Million Forecast, by Type 2019 & 2032
- Table 11: Global US Transportation Infrastructure Construction Industry Revenue Million Forecast, by Country 2019 & 2032
- Table 12: United States US Transportation Infrastructure Construction Industry Revenue (Million) Forecast, by Application 2019 & 2032
- Table 13: Canada US Transportation Infrastructure Construction Industry Revenue (Million) Forecast, by Application 2019 & 2032
- Table 14: Mexico US Transportation Infrastructure Construction Industry Revenue (Million) Forecast, by Application 2019 & 2032
- Table 15: Global US Transportation Infrastructure Construction Industry Revenue Million Forecast, by Type 2019 & 2032
- Table 16: Global US Transportation Infrastructure Construction Industry Revenue Million Forecast, by Country 2019 & 2032
- Table 17: Brazil US Transportation Infrastructure Construction Industry Revenue (Million) Forecast, by Application 2019 & 2032
- Table 18: Argentina US Transportation Infrastructure Construction Industry Revenue (Million) Forecast, by Application 2019 & 2032
- Table 19: Rest of South America US Transportation Infrastructure Construction Industry Revenue (Million) Forecast, by Application 2019 & 2032
- Table 20: Global US Transportation Infrastructure Construction Industry Revenue Million Forecast, by Type 2019 & 2032
- Table 21: Global US Transportation Infrastructure Construction Industry Revenue Million Forecast, by Country 2019 & 2032
- Table 22: United Kingdom US Transportation Infrastructure Construction Industry Revenue (Million) Forecast, by Application 2019 & 2032
- Table 23: Germany US Transportation Infrastructure Construction Industry Revenue (Million) Forecast, by Application 2019 & 2032
- Table 24: France US Transportation Infrastructure Construction Industry Revenue (Million) Forecast, by Application 2019 & 2032
- Table 25: Italy US Transportation Infrastructure Construction Industry Revenue (Million) Forecast, by Application 2019 & 2032
- Table 26: Spain US Transportation Infrastructure Construction Industry Revenue (Million) Forecast, by Application 2019 & 2032
- Table 27: Russia US Transportation Infrastructure Construction Industry Revenue (Million) Forecast, by Application 2019 & 2032
- Table 28: Benelux US Transportation Infrastructure Construction Industry Revenue (Million) Forecast, by Application 2019 & 2032
- Table 29: Nordics US Transportation Infrastructure Construction Industry Revenue (Million) Forecast, by Application 2019 & 2032
- Table 30: Rest of Europe US Transportation Infrastructure Construction Industry Revenue (Million) Forecast, by Application 2019 & 2032
- Table 31: Global US Transportation Infrastructure Construction Industry Revenue Million Forecast, by Type 2019 & 2032
- Table 32: Global US Transportation Infrastructure Construction Industry Revenue Million Forecast, by Country 2019 & 2032
- Table 33: Turkey US Transportation Infrastructure Construction Industry Revenue (Million) Forecast, by Application 2019 & 2032
- Table 34: Israel US Transportation Infrastructure Construction Industry Revenue (Million) Forecast, by Application 2019 & 2032
- Table 35: GCC US Transportation Infrastructure Construction Industry Revenue (Million) Forecast, by Application 2019 & 2032
- Table 36: North Africa US Transportation Infrastructure Construction Industry Revenue (Million) Forecast, by Application 2019 & 2032
- Table 37: South Africa US Transportation Infrastructure Construction Industry Revenue (Million) Forecast, by Application 2019 & 2032
- Table 38: Rest of Middle East & Africa US Transportation Infrastructure Construction Industry Revenue (Million) Forecast, by Application 2019 & 2032
- Table 39: Global US Transportation Infrastructure Construction Industry Revenue Million Forecast, by Type 2019 & 2032
- Table 40: Global US Transportation Infrastructure Construction Industry Revenue Million Forecast, by Country 2019 & 2032
- Table 41: China US Transportation Infrastructure Construction Industry Revenue (Million) Forecast, by Application 2019 & 2032
- Table 42: India US Transportation Infrastructure Construction Industry Revenue (Million) Forecast, by Application 2019 & 2032
- Table 43: Japan US Transportation Infrastructure Construction Industry Revenue (Million) Forecast, by Application 2019 & 2032
- Table 44: South Korea US Transportation Infrastructure Construction Industry Revenue (Million) Forecast, by Application 2019 & 2032
- Table 45: ASEAN US Transportation Infrastructure Construction Industry Revenue (Million) Forecast, by Application 2019 & 2032
- Table 46: Oceania US Transportation Infrastructure Construction Industry Revenue (Million) Forecast, by Application 2019 & 2032
- Table 47: Rest of Asia Pacific US Transportation Infrastructure Construction Industry Revenue (Million) Forecast, by Application 2019 & 2032
Frequently Asked Questions
1. What is the projected Compound Annual Growth Rate (CAGR) of the US Transportation Infrastructure Construction Industry?
The projected CAGR is approximately 4.88%.
2. Which companies are prominent players in the US Transportation Infrastructure Construction Industry?
Key companies in the market include Hunter Roberts Construction Group, Weitz Co The, Messer Construction, Suffolk Construction, Hoffman Construction, Jacobs, Turner Construction Co, Clune Construction, Whiting-Turner Contracting Co The, VRH Construction, Walsh Group The, Clark Group, Balfour Beatty US, Webcor Builders, Wendel, LeChase Construction**List Not Exhaustive, AECOM, Hill Intl, Skanska USA, PCL Construction Enterprises.
3. What are the main segments of the US Transportation Infrastructure Construction Industry?
The market segments include Type.
4. Can you provide details about the market size?
The market size is estimated to be USD 371.25 Million as of 2022.
5. What are some drivers contributing to market growth?
4.; Increase In Tourism Industry4.; Sustainability and Environmental Concerns.
6. What are the notable trends driving market growth?
Government Initiatives for Infrastructural Development to Boost the Market.
7. Are there any restraints impacting market growth?
4.; Financial Constraints4.; High Maintenance.
8. Can you provide examples of recent developments in the market?
September 2023: FMCSA announced more than USD 80 million in grant awards under President Biden's Bipartisan infrastructure law. This record-breaking funding will help prevent commercial motor vehicle (CMT) crashes from occurring more often and more severely on our nation's roads and help truck drivers by increasing access to commercial truck parking, leveraging critical technology, and enhancing safety in work areas, rural areas, and high-crash corridors. Grant beneficiaries include state and local governments, nonprofit organizations, and colleges and universities across the nation.
9. What pricing options are available for accessing the report?
Pricing options include single-user, multi-user, and enterprise licenses priced at USD 3800, USD 4500, and USD 5800 respectively.
10. Is the market size provided in terms of value or volume?
The market size is provided in terms of value, measured in Million.
11. Are there any specific market keywords associated with the report?
Yes, the market keyword associated with the report is "US Transportation Infrastructure Construction Industry," which aids in identifying and referencing the specific market segment covered.
12. How do I determine which pricing option suits my needs best?
The pricing options vary based on user requirements and access needs. Individual users may opt for single-user licenses, while businesses requiring broader access may choose multi-user or enterprise licenses for cost-effective access to the report.
13. Are there any additional resources or data provided in the US Transportation Infrastructure Construction Industry report?
While the report offers comprehensive insights, it's advisable to review the specific contents or supplementary materials provided to ascertain if additional resources or data are available.
14. How can I stay updated on further developments or reports in the US Transportation Infrastructure Construction Industry?
To stay informed about further developments, trends, and reports in the US Transportation Infrastructure Construction Industry, consider subscribing to industry newsletters, following relevant companies and organizations, or regularly checking reputable industry news sources and publications.
Methodology
Step 1 - Identification of Relevant Samples Size from Population Database


Step 2 - Approaches for Defining Global Market Size (Value, Volume* & Price*)

Note*: In applicable scenarios
Step 3 - Data Sources
Primary Research
- Web Analytics
- Survey Reports
- Research Institute
- Latest Research Reports
- Opinion Leaders
Secondary Research
- Annual Reports
- White Paper
- Latest Press Release
- Industry Association
- Paid Database
- Investor Presentations

Step 4 - Data Triangulation
Involves using different sources of information in order to increase the validity of a study
These sources are likely to be stakeholders in a program - participants, other researchers, program staff, other community members, and so on.
Then we put all data in single framework & apply various statistical tools to find out the dynamic on the market.
During the analysis stage, feedback from the stakeholder groups would be compared to determine areas of agreement as well as areas of divergence
