

Key Insights
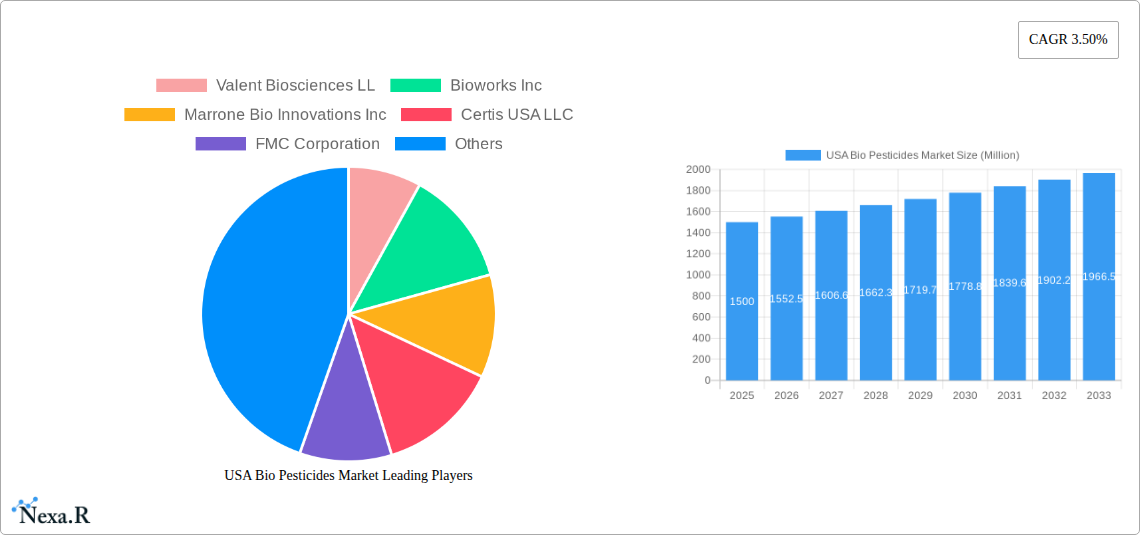
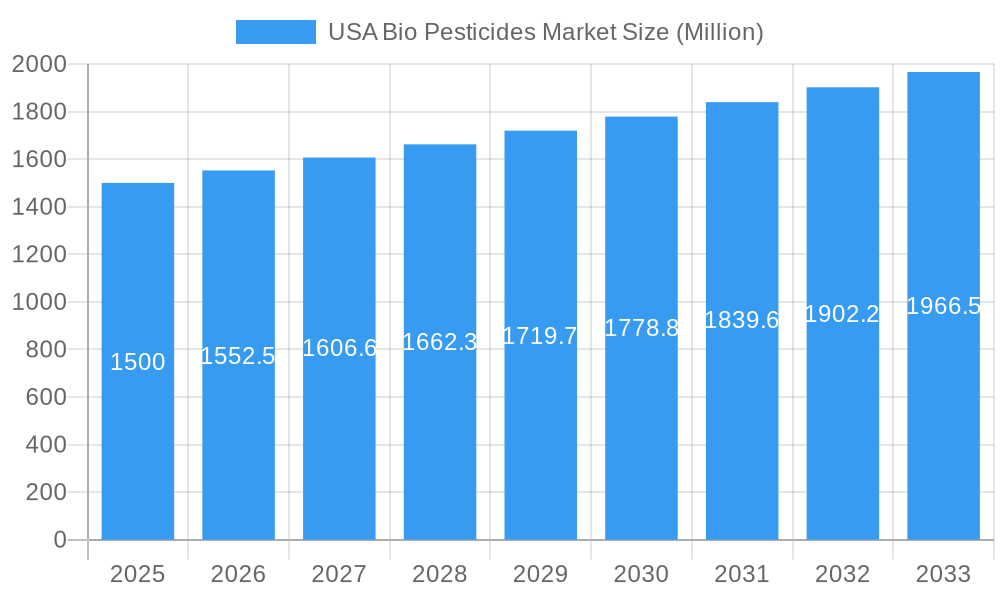
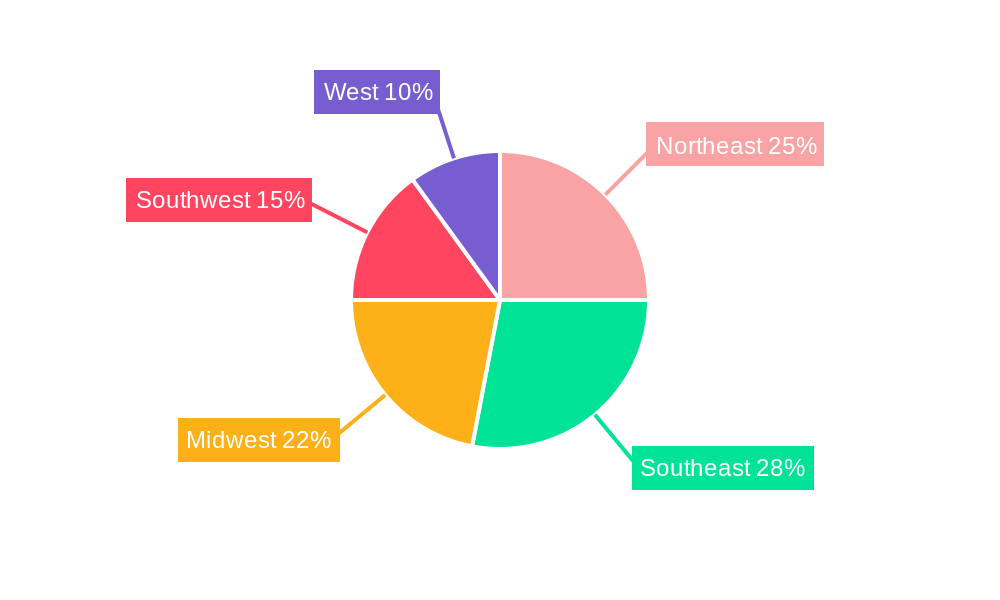
The US Biopesticides Market is experiencing robust growth, driven by increasing consumer demand for organically-produced food, stringent regulations on synthetic pesticides, and growing awareness of environmental sustainability. The market, valued at approximately $1.5 billion in 2025, is projected to exhibit a compound annual growth rate (CAGR) of 3.50% from 2025 to 2033, reaching an estimated market value exceeding $2.2 billion by 2033. This growth is fueled by several key factors, including the rising adoption of biopesticides in cash crops like corn and soybeans, as well as in horticultural crops and row crops. The increasing prevalence of pest and disease resistance to conventional pesticides further strengthens the market appeal of biopesticides, offering a more sustainable and effective alternative. Major market segments include biofungicides, bioherbicides, and bioinsecticides, with biofungicides currently holding the largest market share due to the prevalence of fungal diseases affecting various crops. Leading companies like Valent Biosciences, Bioworks, and Marrone Bio Innovations are actively involved in research and development, driving innovation and expanding the biopesticide product portfolio. The Northeast, Southeast, and Midwest regions are key contributors to market growth, driven by significant agricultural activities.
USA Bio Pesticides Market Market Size (In Billion)
The market's growth trajectory, however, is not without challenges. High initial investment costs associated with biopesticide production and development can serve as a restraint. Furthermore, the efficacy of biopesticides can be affected by environmental factors, leading to inconsistent results compared to synthetic pesticides. However, ongoing research and development efforts, coupled with increasing government support for sustainable agriculture practices, are anticipated to overcome these hurdles. The continued expansion of the organic farming sector and growing consumer preference for pesticide-free produce are expected to drive significant future growth within the US biopesticide market, presenting lucrative opportunities for industry players. Regional variations in agricultural practices and pest prevalence will influence market penetration across different US states. The increasing adoption of precision agriculture techniques will also further enhance the efficacy and targeted application of biopesticides, optimizing resource utilization and minimizing environmental impact.
USA Bio Pesticides Market Company Market Share
USA Bio Pesticides Market: A Comprehensive Report (2019-2033)
This comprehensive report provides an in-depth analysis of the USA Bio Pesticides Market, encompassing market dynamics, growth trends, leading segments, key players, and future outlook. With a focus on the parent market (Agricultural Pesticides) and child markets (Biofungicides, Bioherbicides, Bioinsecticides), this report is an invaluable resource for industry professionals, investors, and stakeholders seeking to understand and capitalize on this rapidly expanding sector. The report covers the historical period (2019-2024), base year (2025), and forecast period (2025-2033), providing a clear trajectory for future market performance. The market size is presented in Million units throughout.
USA Bio Pesticides Market Dynamics & Structure
The USA Bio Pesticides Market is characterized by a moderately concentrated structure, with key players like Valent Biosciences LLC, Corteva Agriscience, and Certis USA LLC holding significant market share. Technological innovation, driven by the need for sustainable and environmentally friendly pest control solutions, is a major growth driver. Stringent regulatory frameworks governing pesticide use and increasing consumer demand for organic and sustainably produced food are shaping market dynamics. Biopesticides are increasingly viewed as viable alternatives to synthetic pesticides, fueled by growing concerns about environmental impact and human health. Mergers and acquisitions (M&A) activity, as evidenced by Corteva Agriscience's acquisition of Symborg in 2022, signals consolidation and expansion within the industry. Innovation barriers include high research and development costs, stringent regulatory approval processes, and the need to demonstrate efficacy comparable to synthetic pesticides.
- Market Concentration: Moderately concentrated, with top 5 players holding approximately xx% market share in 2024.
- Technological Innovation: Focus on enhanced efficacy, targeted delivery systems, and novel biocontrol agents.
- Regulatory Landscape: Stringent EPA regulations driving the need for robust efficacy and safety data.
- Competitive Landscape: Intense competition amongst established players and emerging biotech firms.
- M&A Activity: Significant M&A activity projected to increase market consolidation over the forecast period. xx deals predicted between 2025 and 2033.
- End-User Demographics: Driven by large-scale commercial farms, followed by smaller horticultural and organic farms.
USA Bio Pesticides Market Growth Trends & Insights
The USA Bio Pesticides Market exhibits robust growth, driven by factors such as increasing awareness of environmental concerns, stringent regulations on synthetic pesticides, and rising consumer preference for organically grown produce. Market size is projected to grow from xx million units in 2024 to xx million units by 2033, representing a CAGR of xx%. Adoption rates are increasing across various crop types, particularly in cash crops and horticultural crops. Technological disruptions, such as the development of novel biopesticides with enhanced efficacy and targeted delivery systems, are accelerating market growth. Consumer behavior shifts towards sustainable and environmentally friendly products are further fueling market expansion. Market penetration is expected to increase from xx% in 2024 to xx% by 2033.
Dominant Regions, Countries, or Segments in USA Bio Pesticides Market
The California and Florida regions, along with the Midwestern states, are leading the USA Bio Pesticides Market due to their extensive agricultural activities. Among crop types, cash crops and horticultural crops show the highest adoption rates, driven by higher profitability and consumer demand for organic produce. Within the product segments, Bioinsecticides and Biofungicides represent the largest market share, followed by Bioherbicides.
- Leading Region: California and Florida show highest adoption and market share due to favorable climate and extensive agriculture.
- Leading Crop Type: Cash crops drive the market, followed closely by horticultural crops.
- Leading Product Segment: Bioinsecticides and Biofungicides dominate due to wide-spread pest and disease prevalence.
- Key Drivers: Growing consumer demand for organic food, stringent regulations on synthetic pesticides, and increasing government support for sustainable agriculture.
USA Bio Pesticides Market Product Landscape
The USA Bio Pesticides Market showcases a diverse range of products, including microbial-based biopesticides, bioinsecticides derived from naturally occurring substances, and bioherbicides targeting specific weed species. These products are characterized by their target specificity, minimal environmental impact, and reduced human health risks. Technological advancements focus on enhancing efficacy, developing targeted delivery systems, and extending the shelf life of these products. Unique selling propositions include improved environmental compatibility and reduced pesticide residue levels in food products.
Key Drivers, Barriers & Challenges in USA Bio Pesticides Market
Key Drivers: Growing consumer demand for organic produce, increasing awareness of environmental issues, stringent regulations on synthetic pesticides, and government initiatives promoting sustainable agriculture.
Key Challenges: High research and development costs, stringent regulatory approval processes, challenges in demonstrating efficacy comparable to synthetic pesticides, and the need for consistent product performance across diverse environmental conditions. Supply chain complexities limit the consistent availability of raw materials; this affects the timely production of biopesticides. This leads to inconsistent supply and subsequently higher pricing.
Emerging Opportunities in USA Bio Pesticides Market
Emerging opportunities include the development of novel biopesticides with enhanced efficacy, the exploration of new application methods (e.g., targeted delivery systems), and expansion into untapped markets, such as organic farming and specialty crops. Increasing consumer demand for sustainable solutions and evolving regulatory frameworks create a favorable environment for market expansion. Moreover, focusing on research and development of biopesticides tailored to specific pest problems and crops can create substantial growth opportunities.
Growth Accelerators in the USA Bio Pesticides Market Industry
Technological breakthroughs, such as advancements in microbial engineering and formulation technologies, are key growth accelerators. Strategic partnerships between biotech companies and agricultural enterprises enhance product development and market penetration. Market expansion strategies focusing on emerging markets and untapped segments are vital for long-term growth. Increased government funding for research and development in biopesticides creates additional impetus for industry expansion.
Key Players Shaping the USA Bio Pesticides Market Market
- Valent Biosciences LLC
- Bioworks Inc
- Marrone Bio Innovations Inc
- Certis USA LLC
- FMC Corporation
- Andermatt Group AG
- Indogulf BioAg LLC (Biotech Division of Indogulf Company)
- Corteva Agriscience
- Terramera Inc
- Lallemand Inc
Notable Milestones in USA Bio Pesticides Market Sector
- June 2022: Certis Biologicals and Novozymes collaborate to develop new technologies for fungal disease control in row crops.
- June 2022: Valent BioSciences LLC expands its biorational manufacturing facility to meet rising demand.
- September 2022: Corteva Agriscience acquires Symborg to expand its biologicals portfolio.
In-Depth USA Bio Pesticides Market Market Outlook
The future of the USA Bio Pesticides Market is promising, driven by continued growth in demand for sustainable agricultural solutions. Technological innovations, strategic partnerships, and expanding market penetration across various crop types will fuel market expansion. The focus on developing highly effective and targeted biopesticides will unlock substantial growth potential, making it an attractive sector for investment and innovation.
USA Bio Pesticides Market Segmentation
- 1. Production Analysis
- 2. Consumption Analysis
- 3. Import Market Analysis (Value & Volume)
- 4. Export Market Analysis (Value & Volume)
- 5. Price Trend Analysis
USA Bio Pesticides Market Segmentation By Geography
-
1. North America
- 1.1. United States
- 1.2. Canada
- 1.3. Mexico
-
2. South America
- 2.1. Brazil
- 2.2. Argentina
- 2.3. Rest of South America
-
3. Europe
- 3.1. United Kingdom
- 3.2. Germany
- 3.3. France
- 3.4. Italy
- 3.5. Spain
- 3.6. Russia
- 3.7. Benelux
- 3.8. Nordics
- 3.9. Rest of Europe
-
4. Middle East & Africa
- 4.1. Turkey
- 4.2. Israel
- 4.3. GCC
- 4.4. North Africa
- 4.5. South Africa
- 4.6. Rest of Middle East & Africa
-
5. Asia Pacific
- 5.1. China
- 5.2. India
- 5.3. Japan
- 5.4. South Korea
- 5.5. ASEAN
- 5.6. Oceania
- 5.7. Rest of Asia Pacific
USA Bio Pesticides Market Regional Market Share
Geographic Coverage of USA Bio Pesticides Market
USA Bio Pesticides Market REPORT HIGHLIGHTS
| Aspects | Details |
|---|---|
| Study Period | 2020-2034 |
| Base Year | 2025 |
| Estimated Year | 2026 |
| Forecast Period | 2026-2034 |
| Historical Period | 2020-2025 |
| Growth Rate | CAGR of 9.1% from 2020-2034 |
| Segmentation |
|
Table of Contents
- 1. Introduction
- 1.1. Research Scope
- 1.2. Market Segmentation
- 1.3. Research Methodology
- 1.4. Definitions and Assumptions
- 2. Executive Summary
- 2.1. Introduction
- 3. Market Dynamics
- 3.1. Introduction
- 3.2. Market Drivers
- 3.2.1. Seed Treatment As A Solution To Enhance Yield; Growing Awareness For Seed Treatment Among The Farmers; Rising Trend Of Organic Farming
- 3.3. Market Restrains
- 3.3.1. Limitations Across Farm-Level Seed Treatment; Rising Environmental Concerns
- 3.4. Market Trends
- 3.4.1. Row Crops is the largest Crop Type
- 4. Market Factor Analysis
- 4.1. Porters Five Forces
- 4.2. Supply/Value Chain
- 4.3. PESTEL analysis
- 4.4. Market Entropy
- 4.5. Patent/Trademark Analysis
- 5. Global USA Bio Pesticides Market Analysis, Insights and Forecast, 2020-2032
- 5.1. Market Analysis, Insights and Forecast - by Production Analysis
- 5.2. Market Analysis, Insights and Forecast - by Consumption Analysis
- 5.3. Market Analysis, Insights and Forecast - by Import Market Analysis (Value & Volume)
- 5.4. Market Analysis, Insights and Forecast - by Export Market Analysis (Value & Volume)
- 5.5. Market Analysis, Insights and Forecast - by Price Trend Analysis
- 5.6. Market Analysis, Insights and Forecast - by Region
- 5.6.1. North America
- 5.6.2. South America
- 5.6.3. Europe
- 5.6.4. Middle East & Africa
- 5.6.5. Asia Pacific
- 5.1. Market Analysis, Insights and Forecast - by Production Analysis
- 6. North America USA Bio Pesticides Market Analysis, Insights and Forecast, 2020-2032
- 6.1. Market Analysis, Insights and Forecast - by Production Analysis
- 6.2. Market Analysis, Insights and Forecast - by Consumption Analysis
- 6.3. Market Analysis, Insights and Forecast - by Import Market Analysis (Value & Volume)
- 6.4. Market Analysis, Insights and Forecast - by Export Market Analysis (Value & Volume)
- 6.5. Market Analysis, Insights and Forecast - by Price Trend Analysis
- 6.1. Market Analysis, Insights and Forecast - by Production Analysis
- 7. South America USA Bio Pesticides Market Analysis, Insights and Forecast, 2020-2032
- 7.1. Market Analysis, Insights and Forecast - by Production Analysis
- 7.2. Market Analysis, Insights and Forecast - by Consumption Analysis
- 7.3. Market Analysis, Insights and Forecast - by Import Market Analysis (Value & Volume)
- 7.4. Market Analysis, Insights and Forecast - by Export Market Analysis (Value & Volume)
- 7.5. Market Analysis, Insights and Forecast - by Price Trend Analysis
- 7.1. Market Analysis, Insights and Forecast - by Production Analysis
- 8. Europe USA Bio Pesticides Market Analysis, Insights and Forecast, 2020-2032
- 8.1. Market Analysis, Insights and Forecast - by Production Analysis
- 8.2. Market Analysis, Insights and Forecast - by Consumption Analysis
- 8.3. Market Analysis, Insights and Forecast - by Import Market Analysis (Value & Volume)
- 8.4. Market Analysis, Insights and Forecast - by Export Market Analysis (Value & Volume)
- 8.5. Market Analysis, Insights and Forecast - by Price Trend Analysis
- 8.1. Market Analysis, Insights and Forecast - by Production Analysis
- 9. Middle East & Africa USA Bio Pesticides Market Analysis, Insights and Forecast, 2020-2032
- 9.1. Market Analysis, Insights and Forecast - by Production Analysis
- 9.2. Market Analysis, Insights and Forecast - by Consumption Analysis
- 9.3. Market Analysis, Insights and Forecast - by Import Market Analysis (Value & Volume)
- 9.4. Market Analysis, Insights and Forecast - by Export Market Analysis (Value & Volume)
- 9.5. Market Analysis, Insights and Forecast - by Price Trend Analysis
- 9.1. Market Analysis, Insights and Forecast - by Production Analysis
- 10. Asia Pacific USA Bio Pesticides Market Analysis, Insights and Forecast, 2020-2032
- 10.1. Market Analysis, Insights and Forecast - by Production Analysis
- 10.2. Market Analysis, Insights and Forecast - by Consumption Analysis
- 10.3. Market Analysis, Insights and Forecast - by Import Market Analysis (Value & Volume)
- 10.4. Market Analysis, Insights and Forecast - by Export Market Analysis (Value & Volume)
- 10.5. Market Analysis, Insights and Forecast - by Price Trend Analysis
- 10.1. Market Analysis, Insights and Forecast - by Production Analysis
- 11. Competitive Analysis
- 11.1. Global Market Share Analysis 2025
- 11.2. Company Profiles
- 11.2.1 Valent Biosciences LL
- 11.2.1.1. Overview
- 11.2.1.2. Products
- 11.2.1.3. SWOT Analysis
- 11.2.1.4. Recent Developments
- 11.2.1.5. Financials (Based on Availability)
- 11.2.2 Bioworks Inc
- 11.2.2.1. Overview
- 11.2.2.2. Products
- 11.2.2.3. SWOT Analysis
- 11.2.2.4. Recent Developments
- 11.2.2.5. Financials (Based on Availability)
- 11.2.3 Marrone Bio Innovations Inc
- 11.2.3.1. Overview
- 11.2.3.2. Products
- 11.2.3.3. SWOT Analysis
- 11.2.3.4. Recent Developments
- 11.2.3.5. Financials (Based on Availability)
- 11.2.4 Certis USA LLC
- 11.2.4.1. Overview
- 11.2.4.2. Products
- 11.2.4.3. SWOT Analysis
- 11.2.4.4. Recent Developments
- 11.2.4.5. Financials (Based on Availability)
- 11.2.5 FMC Corporation
- 11.2.5.1. Overview
- 11.2.5.2. Products
- 11.2.5.3. SWOT Analysis
- 11.2.5.4. Recent Developments
- 11.2.5.5. Financials (Based on Availability)
- 11.2.6 Andermatt Group AG
- 11.2.6.1. Overview
- 11.2.6.2. Products
- 11.2.6.3. SWOT Analysis
- 11.2.6.4. Recent Developments
- 11.2.6.5. Financials (Based on Availability)
- 11.2.7 Indogulf BioAg LLC (Biotech Division of Indogulf Company)
- 11.2.7.1. Overview
- 11.2.7.2. Products
- 11.2.7.3. SWOT Analysis
- 11.2.7.4. Recent Developments
- 11.2.7.5. Financials (Based on Availability)
- 11.2.8 Corteva Agriscience
- 11.2.8.1. Overview
- 11.2.8.2. Products
- 11.2.8.3. SWOT Analysis
- 11.2.8.4. Recent Developments
- 11.2.8.5. Financials (Based on Availability)
- 11.2.9 Terramera Inc
- 11.2.9.1. Overview
- 11.2.9.2. Products
- 11.2.9.3. SWOT Analysis
- 11.2.9.4. Recent Developments
- 11.2.9.5. Financials (Based on Availability)
- 11.2.10 Lallemand Inc
- 11.2.10.1. Overview
- 11.2.10.2. Products
- 11.2.10.3. SWOT Analysis
- 11.2.10.4. Recent Developments
- 11.2.10.5. Financials (Based on Availability)
- 11.2.1 Valent Biosciences LL
List of Figures
- Figure 1: Global USA Bio Pesticides Market Revenue Breakdown (undefined, %) by Region 2025 & 2033
- Figure 2: North America USA Bio Pesticides Market Revenue (undefined), by Production Analysis 2025 & 2033
- Figure 3: North America USA Bio Pesticides Market Revenue Share (%), by Production Analysis 2025 & 2033
- Figure 4: North America USA Bio Pesticides Market Revenue (undefined), by Consumption Analysis 2025 & 2033
- Figure 5: North America USA Bio Pesticides Market Revenue Share (%), by Consumption Analysis 2025 & 2033
- Figure 6: North America USA Bio Pesticides Market Revenue (undefined), by Import Market Analysis (Value & Volume) 2025 & 2033
- Figure 7: North America USA Bio Pesticides Market Revenue Share (%), by Import Market Analysis (Value & Volume) 2025 & 2033
- Figure 8: North America USA Bio Pesticides Market Revenue (undefined), by Export Market Analysis (Value & Volume) 2025 & 2033
- Figure 9: North America USA Bio Pesticides Market Revenue Share (%), by Export Market Analysis (Value & Volume) 2025 & 2033
- Figure 10: North America USA Bio Pesticides Market Revenue (undefined), by Price Trend Analysis 2025 & 2033
- Figure 11: North America USA Bio Pesticides Market Revenue Share (%), by Price Trend Analysis 2025 & 2033
- Figure 12: North America USA Bio Pesticides Market Revenue (undefined), by Country 2025 & 2033
- Figure 13: North America USA Bio Pesticides Market Revenue Share (%), by Country 2025 & 2033
- Figure 14: South America USA Bio Pesticides Market Revenue (undefined), by Production Analysis 2025 & 2033
- Figure 15: South America USA Bio Pesticides Market Revenue Share (%), by Production Analysis 2025 & 2033
- Figure 16: South America USA Bio Pesticides Market Revenue (undefined), by Consumption Analysis 2025 & 2033
- Figure 17: South America USA Bio Pesticides Market Revenue Share (%), by Consumption Analysis 2025 & 2033
- Figure 18: South America USA Bio Pesticides Market Revenue (undefined), by Import Market Analysis (Value & Volume) 2025 & 2033
- Figure 19: South America USA Bio Pesticides Market Revenue Share (%), by Import Market Analysis (Value & Volume) 2025 & 2033
- Figure 20: South America USA Bio Pesticides Market Revenue (undefined), by Export Market Analysis (Value & Volume) 2025 & 2033
- Figure 21: South America USA Bio Pesticides Market Revenue Share (%), by Export Market Analysis (Value & Volume) 2025 & 2033
- Figure 22: South America USA Bio Pesticides Market Revenue (undefined), by Price Trend Analysis 2025 & 2033
- Figure 23: South America USA Bio Pesticides Market Revenue Share (%), by Price Trend Analysis 2025 & 2033
- Figure 24: South America USA Bio Pesticides Market Revenue (undefined), by Country 2025 & 2033
- Figure 25: South America USA Bio Pesticides Market Revenue Share (%), by Country 2025 & 2033
- Figure 26: Europe USA Bio Pesticides Market Revenue (undefined), by Production Analysis 2025 & 2033
- Figure 27: Europe USA Bio Pesticides Market Revenue Share (%), by Production Analysis 2025 & 2033
- Figure 28: Europe USA Bio Pesticides Market Revenue (undefined), by Consumption Analysis 2025 & 2033
- Figure 29: Europe USA Bio Pesticides Market Revenue Share (%), by Consumption Analysis 2025 & 2033
- Figure 30: Europe USA Bio Pesticides Market Revenue (undefined), by Import Market Analysis (Value & Volume) 2025 & 2033
- Figure 31: Europe USA Bio Pesticides Market Revenue Share (%), by Import Market Analysis (Value & Volume) 2025 & 2033
- Figure 32: Europe USA Bio Pesticides Market Revenue (undefined), by Export Market Analysis (Value & Volume) 2025 & 2033
- Figure 33: Europe USA Bio Pesticides Market Revenue Share (%), by Export Market Analysis (Value & Volume) 2025 & 2033
- Figure 34: Europe USA Bio Pesticides Market Revenue (undefined), by Price Trend Analysis 2025 & 2033
- Figure 35: Europe USA Bio Pesticides Market Revenue Share (%), by Price Trend Analysis 2025 & 2033
- Figure 36: Europe USA Bio Pesticides Market Revenue (undefined), by Country 2025 & 2033
- Figure 37: Europe USA Bio Pesticides Market Revenue Share (%), by Country 2025 & 2033
- Figure 38: Middle East & Africa USA Bio Pesticides Market Revenue (undefined), by Production Analysis 2025 & 2033
- Figure 39: Middle East & Africa USA Bio Pesticides Market Revenue Share (%), by Production Analysis 2025 & 2033
- Figure 40: Middle East & Africa USA Bio Pesticides Market Revenue (undefined), by Consumption Analysis 2025 & 2033
- Figure 41: Middle East & Africa USA Bio Pesticides Market Revenue Share (%), by Consumption Analysis 2025 & 2033
- Figure 42: Middle East & Africa USA Bio Pesticides Market Revenue (undefined), by Import Market Analysis (Value & Volume) 2025 & 2033
- Figure 43: Middle East & Africa USA Bio Pesticides Market Revenue Share (%), by Import Market Analysis (Value & Volume) 2025 & 2033
- Figure 44: Middle East & Africa USA Bio Pesticides Market Revenue (undefined), by Export Market Analysis (Value & Volume) 2025 & 2033
- Figure 45: Middle East & Africa USA Bio Pesticides Market Revenue Share (%), by Export Market Analysis (Value & Volume) 2025 & 2033
- Figure 46: Middle East & Africa USA Bio Pesticides Market Revenue (undefined), by Price Trend Analysis 2025 & 2033
- Figure 47: Middle East & Africa USA Bio Pesticides Market Revenue Share (%), by Price Trend Analysis 2025 & 2033
- Figure 48: Middle East & Africa USA Bio Pesticides Market Revenue (undefined), by Country 2025 & 2033
- Figure 49: Middle East & Africa USA Bio Pesticides Market Revenue Share (%), by Country 2025 & 2033
- Figure 50: Asia Pacific USA Bio Pesticides Market Revenue (undefined), by Production Analysis 2025 & 2033
- Figure 51: Asia Pacific USA Bio Pesticides Market Revenue Share (%), by Production Analysis 2025 & 2033
- Figure 52: Asia Pacific USA Bio Pesticides Market Revenue (undefined), by Consumption Analysis 2025 & 2033
- Figure 53: Asia Pacific USA Bio Pesticides Market Revenue Share (%), by Consumption Analysis 2025 & 2033
- Figure 54: Asia Pacific USA Bio Pesticides Market Revenue (undefined), by Import Market Analysis (Value & Volume) 2025 & 2033
- Figure 55: Asia Pacific USA Bio Pesticides Market Revenue Share (%), by Import Market Analysis (Value & Volume) 2025 & 2033
- Figure 56: Asia Pacific USA Bio Pesticides Market Revenue (undefined), by Export Market Analysis (Value & Volume) 2025 & 2033
- Figure 57: Asia Pacific USA Bio Pesticides Market Revenue Share (%), by Export Market Analysis (Value & Volume) 2025 & 2033
- Figure 58: Asia Pacific USA Bio Pesticides Market Revenue (undefined), by Price Trend Analysis 2025 & 2033
- Figure 59: Asia Pacific USA Bio Pesticides Market Revenue Share (%), by Price Trend Analysis 2025 & 2033
- Figure 60: Asia Pacific USA Bio Pesticides Market Revenue (undefined), by Country 2025 & 2033
- Figure 61: Asia Pacific USA Bio Pesticides Market Revenue Share (%), by Country 2025 & 2033
List of Tables
- Table 1: Global USA Bio Pesticides Market Revenue undefined Forecast, by Production Analysis 2020 & 2033
- Table 2: Global USA Bio Pesticides Market Revenue undefined Forecast, by Consumption Analysis 2020 & 2033
- Table 3: Global USA Bio Pesticides Market Revenue undefined Forecast, by Import Market Analysis (Value & Volume) 2020 & 2033
- Table 4: Global USA Bio Pesticides Market Revenue undefined Forecast, by Export Market Analysis (Value & Volume) 2020 & 2033
- Table 5: Global USA Bio Pesticides Market Revenue undefined Forecast, by Price Trend Analysis 2020 & 2033
- Table 6: Global USA Bio Pesticides Market Revenue undefined Forecast, by Region 2020 & 2033
- Table 7: Global USA Bio Pesticides Market Revenue undefined Forecast, by Production Analysis 2020 & 2033
- Table 8: Global USA Bio Pesticides Market Revenue undefined Forecast, by Consumption Analysis 2020 & 2033
- Table 9: Global USA Bio Pesticides Market Revenue undefined Forecast, by Import Market Analysis (Value & Volume) 2020 & 2033
- Table 10: Global USA Bio Pesticides Market Revenue undefined Forecast, by Export Market Analysis (Value & Volume) 2020 & 2033
- Table 11: Global USA Bio Pesticides Market Revenue undefined Forecast, by Price Trend Analysis 2020 & 2033
- Table 12: Global USA Bio Pesticides Market Revenue undefined Forecast, by Country 2020 & 2033
- Table 13: United States USA Bio Pesticides Market Revenue (undefined) Forecast, by Application 2020 & 2033
- Table 14: Canada USA Bio Pesticides Market Revenue (undefined) Forecast, by Application 2020 & 2033
- Table 15: Mexico USA Bio Pesticides Market Revenue (undefined) Forecast, by Application 2020 & 2033
- Table 16: Global USA Bio Pesticides Market Revenue undefined Forecast, by Production Analysis 2020 & 2033
- Table 17: Global USA Bio Pesticides Market Revenue undefined Forecast, by Consumption Analysis 2020 & 2033
- Table 18: Global USA Bio Pesticides Market Revenue undefined Forecast, by Import Market Analysis (Value & Volume) 2020 & 2033
- Table 19: Global USA Bio Pesticides Market Revenue undefined Forecast, by Export Market Analysis (Value & Volume) 2020 & 2033
- Table 20: Global USA Bio Pesticides Market Revenue undefined Forecast, by Price Trend Analysis 2020 & 2033
- Table 21: Global USA Bio Pesticides Market Revenue undefined Forecast, by Country 2020 & 2033
- Table 22: Brazil USA Bio Pesticides Market Revenue (undefined) Forecast, by Application 2020 & 2033
- Table 23: Argentina USA Bio Pesticides Market Revenue (undefined) Forecast, by Application 2020 & 2033
- Table 24: Rest of South America USA Bio Pesticides Market Revenue (undefined) Forecast, by Application 2020 & 2033
- Table 25: Global USA Bio Pesticides Market Revenue undefined Forecast, by Production Analysis 2020 & 2033
- Table 26: Global USA Bio Pesticides Market Revenue undefined Forecast, by Consumption Analysis 2020 & 2033
- Table 27: Global USA Bio Pesticides Market Revenue undefined Forecast, by Import Market Analysis (Value & Volume) 2020 & 2033
- Table 28: Global USA Bio Pesticides Market Revenue undefined Forecast, by Export Market Analysis (Value & Volume) 2020 & 2033
- Table 29: Global USA Bio Pesticides Market Revenue undefined Forecast, by Price Trend Analysis 2020 & 2033
- Table 30: Global USA Bio Pesticides Market Revenue undefined Forecast, by Country 2020 & 2033
- Table 31: United Kingdom USA Bio Pesticides Market Revenue (undefined) Forecast, by Application 2020 & 2033
- Table 32: Germany USA Bio Pesticides Market Revenue (undefined) Forecast, by Application 2020 & 2033
- Table 33: France USA Bio Pesticides Market Revenue (undefined) Forecast, by Application 2020 & 2033
- Table 34: Italy USA Bio Pesticides Market Revenue (undefined) Forecast, by Application 2020 & 2033
- Table 35: Spain USA Bio Pesticides Market Revenue (undefined) Forecast, by Application 2020 & 2033
- Table 36: Russia USA Bio Pesticides Market Revenue (undefined) Forecast, by Application 2020 & 2033
- Table 37: Benelux USA Bio Pesticides Market Revenue (undefined) Forecast, by Application 2020 & 2033
- Table 38: Nordics USA Bio Pesticides Market Revenue (undefined) Forecast, by Application 2020 & 2033
- Table 39: Rest of Europe USA Bio Pesticides Market Revenue (undefined) Forecast, by Application 2020 & 2033
- Table 40: Global USA Bio Pesticides Market Revenue undefined Forecast, by Production Analysis 2020 & 2033
- Table 41: Global USA Bio Pesticides Market Revenue undefined Forecast, by Consumption Analysis 2020 & 2033
- Table 42: Global USA Bio Pesticides Market Revenue undefined Forecast, by Import Market Analysis (Value & Volume) 2020 & 2033
- Table 43: Global USA Bio Pesticides Market Revenue undefined Forecast, by Export Market Analysis (Value & Volume) 2020 & 2033
- Table 44: Global USA Bio Pesticides Market Revenue undefined Forecast, by Price Trend Analysis 2020 & 2033
- Table 45: Global USA Bio Pesticides Market Revenue undefined Forecast, by Country 2020 & 2033
- Table 46: Turkey USA Bio Pesticides Market Revenue (undefined) Forecast, by Application 2020 & 2033
- Table 47: Israel USA Bio Pesticides Market Revenue (undefined) Forecast, by Application 2020 & 2033
- Table 48: GCC USA Bio Pesticides Market Revenue (undefined) Forecast, by Application 2020 & 2033
- Table 49: North Africa USA Bio Pesticides Market Revenue (undefined) Forecast, by Application 2020 & 2033
- Table 50: South Africa USA Bio Pesticides Market Revenue (undefined) Forecast, by Application 2020 & 2033
- Table 51: Rest of Middle East & Africa USA Bio Pesticides Market Revenue (undefined) Forecast, by Application 2020 & 2033
- Table 52: Global USA Bio Pesticides Market Revenue undefined Forecast, by Production Analysis 2020 & 2033
- Table 53: Global USA Bio Pesticides Market Revenue undefined Forecast, by Consumption Analysis 2020 & 2033
- Table 54: Global USA Bio Pesticides Market Revenue undefined Forecast, by Import Market Analysis (Value & Volume) 2020 & 2033
- Table 55: Global USA Bio Pesticides Market Revenue undefined Forecast, by Export Market Analysis (Value & Volume) 2020 & 2033
- Table 56: Global USA Bio Pesticides Market Revenue undefined Forecast, by Price Trend Analysis 2020 & 2033
- Table 57: Global USA Bio Pesticides Market Revenue undefined Forecast, by Country 2020 & 2033
- Table 58: China USA Bio Pesticides Market Revenue (undefined) Forecast, by Application 2020 & 2033
- Table 59: India USA Bio Pesticides Market Revenue (undefined) Forecast, by Application 2020 & 2033
- Table 60: Japan USA Bio Pesticides Market Revenue (undefined) Forecast, by Application 2020 & 2033
- Table 61: South Korea USA Bio Pesticides Market Revenue (undefined) Forecast, by Application 2020 & 2033
- Table 62: ASEAN USA Bio Pesticides Market Revenue (undefined) Forecast, by Application 2020 & 2033
- Table 63: Oceania USA Bio Pesticides Market Revenue (undefined) Forecast, by Application 2020 & 2033
- Table 64: Rest of Asia Pacific USA Bio Pesticides Market Revenue (undefined) Forecast, by Application 2020 & 2033
Frequently Asked Questions
1. What is the projected Compound Annual Growth Rate (CAGR) of the USA Bio Pesticides Market?
The projected CAGR is approximately 9.1%.
2. Which companies are prominent players in the USA Bio Pesticides Market?
Key companies in the market include Valent Biosciences LL, Bioworks Inc, Marrone Bio Innovations Inc, Certis USA LLC, FMC Corporation, Andermatt Group AG, Indogulf BioAg LLC (Biotech Division of Indogulf Company), Corteva Agriscience, Terramera Inc, Lallemand Inc.
3. What are the main segments of the USA Bio Pesticides Market?
The market segments include Production Analysis, Consumption Analysis, Import Market Analysis (Value & Volume), Export Market Analysis (Value & Volume), Price Trend Analysis.
4. Can you provide details about the market size?
The market size is estimated to be USD XXX N/A as of 2022.
5. What are some drivers contributing to market growth?
Seed Treatment As A Solution To Enhance Yield; Growing Awareness For Seed Treatment Among The Farmers; Rising Trend Of Organic Farming.
6. What are the notable trends driving market growth?
Row Crops is the largest Crop Type.
7. Are there any restraints impacting market growth?
Limitations Across Farm-Level Seed Treatment; Rising Environmental Concerns.
8. Can you provide examples of recent developments in the market?
September 2022: Corteva Agriscience signed an agreement to acquire a biologicals-based company Symborg as a part of its strategy to expand its biologicals portfolio. This move would help Corteva Agriscience in achieving its aim to become a global leader in the agricultural biologicals market.June 2022: Certis Biologicals and Novozymes, two leading agricultural biotechnology companies, collaborated to develop new technologies for highly effective fungal disease control. This collaboration will provide new solutions to row crop growers.June 2022: Valent BioSciences LLC confirmed that it had approved a big expansion of its biorational manufacturing facility in Osage, Iowa, to meet the rising demand for its biorational products and introduce new products that will necessitate more capacity.
9. What pricing options are available for accessing the report?
Pricing options include single-user, multi-user, and enterprise licenses priced at USD 3800, USD 4500, and USD 5800 respectively.
10. Is the market size provided in terms of value or volume?
The market size is provided in terms of value, measured in N/A.
11. Are there any specific market keywords associated with the report?
Yes, the market keyword associated with the report is "USA Bio Pesticides Market," which aids in identifying and referencing the specific market segment covered.
12. How do I determine which pricing option suits my needs best?
The pricing options vary based on user requirements and access needs. Individual users may opt for single-user licenses, while businesses requiring broader access may choose multi-user or enterprise licenses for cost-effective access to the report.
13. Are there any additional resources or data provided in the USA Bio Pesticides Market report?
While the report offers comprehensive insights, it's advisable to review the specific contents or supplementary materials provided to ascertain if additional resources or data are available.
14. How can I stay updated on further developments or reports in the USA Bio Pesticides Market?
To stay informed about further developments, trends, and reports in the USA Bio Pesticides Market, consider subscribing to industry newsletters, following relevant companies and organizations, or regularly checking reputable industry news sources and publications.
Methodology
Step 1 - Identification of Relevant Samples Size from Population Database


Step 2 - Approaches for Defining Global Market Size (Value, Volume* & Price*)

Note*: In applicable scenarios
Step 3 - Data Sources
Primary Research
- Web Analytics
- Survey Reports
- Research Institute
- Latest Research Reports
- Opinion Leaders
Secondary Research
- Annual Reports
- White Paper
- Latest Press Release
- Industry Association
- Paid Database
- Investor Presentations

Step 4 - Data Triangulation
Involves using different sources of information in order to increase the validity of a study
These sources are likely to be stakeholders in a program - participants, other researchers, program staff, other community members, and so on.
Then we put all data in single framework & apply various statistical tools to find out the dynamic on the market.
During the analysis stage, feedback from the stakeholder groups would be compared to determine areas of agreement as well as areas of divergence