

Key Insights
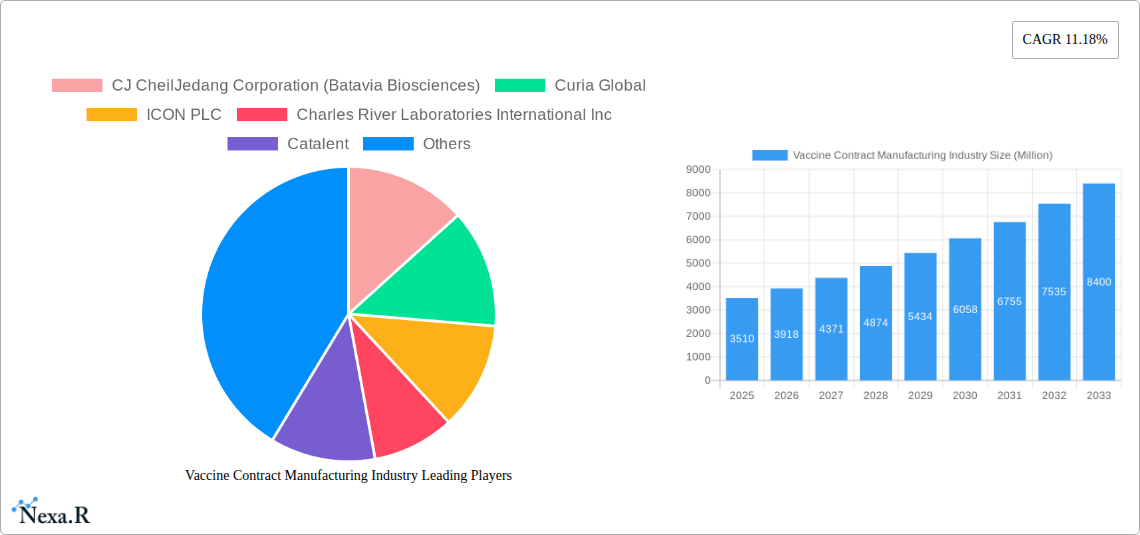
The global Vaccine Contract Manufacturing market, valued at $3.51 billion in 2025, is projected to experience robust growth, driven by increasing demand for vaccines, particularly in emerging markets with rising infectious disease prevalence and expanding immunization programs. The market's Compound Annual Growth Rate (CAGR) of 11.18% from 2025 to 2033 indicates significant expansion opportunities. Key drivers include the rising prevalence of chronic diseases necessitating preventative vaccines, the ongoing need for pandemic preparedness and response capabilities, and technological advancements in vaccine development (mRNA and other novel platforms). Furthermore, the outsourcing trend among pharmaceutical companies, seeking cost efficiencies and specialized expertise in manufacturing, fuels market expansion. Market segmentation reveals significant growth in human use vaccines, driven by large-scale public health initiatives and a growing focus on preventative healthcare. Within vaccine types, RNA vaccines and subunit vaccines are expected to witness substantial growth due to their high efficacy and safety profiles. The contract manufacturing process is experiencing significant growth in both upstream and downstream processes, as companies outsource various stages of vaccine production. The clinical and commercial stages of operations contribute significantly to market revenue, reflecting the increasing maturity and scale of vaccine development projects. Competition is intense, with major players like Lonza, Catalent, and Charles River Laboratories holding significant market share.
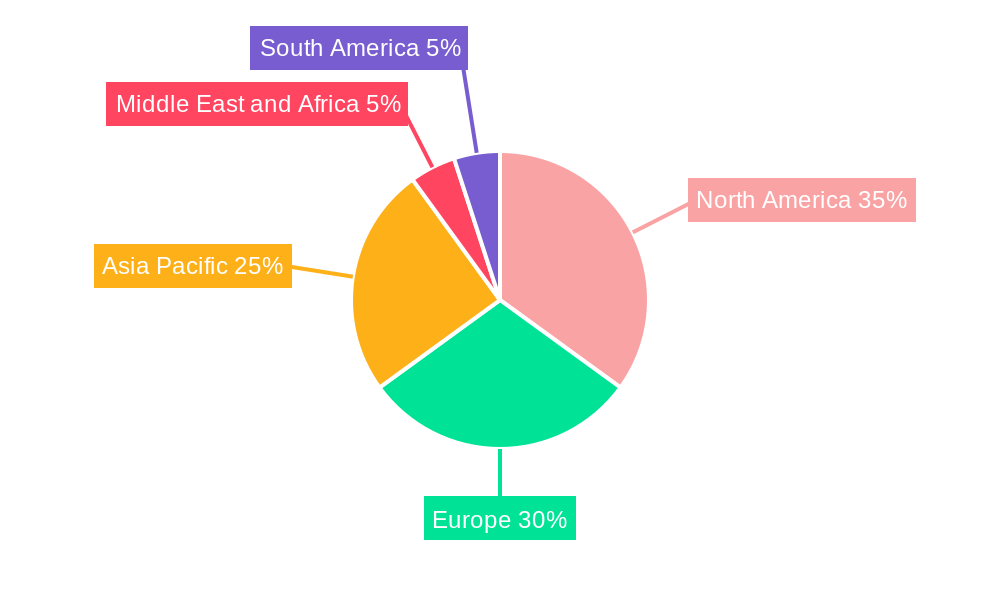
Geographical expansion is another crucial factor influencing market growth. North America and Europe currently dominate the market due to advanced healthcare infrastructure and substantial investments in vaccine research and development. However, the Asia-Pacific region is poised for substantial growth due to its expanding middle class, rising healthcare expenditure, and increasing government initiatives to improve public health. The market is expected to see increased consolidation through mergers and acquisitions, as companies seek to expand their manufacturing capacity and service offerings. This consolidation trend will further shape the competitive landscape and influence market dynamics in the coming years.
Vaccine Contract Manufacturing Industry Market Report: 2019-2033
This comprehensive report provides a detailed analysis of the Vaccine Contract Manufacturing industry, encompassing market dynamics, growth trends, regional insights, and key players. With a focus on both the parent market (pharmaceutical contract manufacturing) and the child market (vaccine manufacturing), this report offers invaluable insights for industry professionals, investors, and stakeholders seeking to navigate this rapidly evolving landscape. The study period covers 2019-2033, with a base year of 2025 and a forecast period of 2025-2033. Market values are presented in million units.
Vaccine Contract Manufacturing Industry Market Dynamics & Structure
The vaccine contract manufacturing market is characterized by a moderately concentrated landscape, with a few large players holding significant market share. Technological innovation, particularly in mRNA and other novel vaccine technologies, is a major driver. Stringent regulatory frameworks, including GMP (Good Manufacturing Practices) compliance, significantly impact market entry and operations. Competitive pressures stem from both established contract manufacturers and emerging players seeking to capitalize on the growing demand. The market experiences frequent mergers and acquisitions (M&A) activity, indicating consolidation and strategic expansion efforts.
- Market Concentration: xx% market share held by top 5 players (2024).
- M&A Activity: xx deals closed in 2024 (estimated).
- Regulatory Landscape: Stringent GMP guidelines impacting operational costs and entry barriers.
- Technological Innovation: Continuous advancements in vaccine technology drive demand for specialized manufacturing capabilities.
- End-User Demographics: Growing global population and increasing prevalence of infectious diseases.
Vaccine Contract Manufacturing Industry Growth Trends & Insights
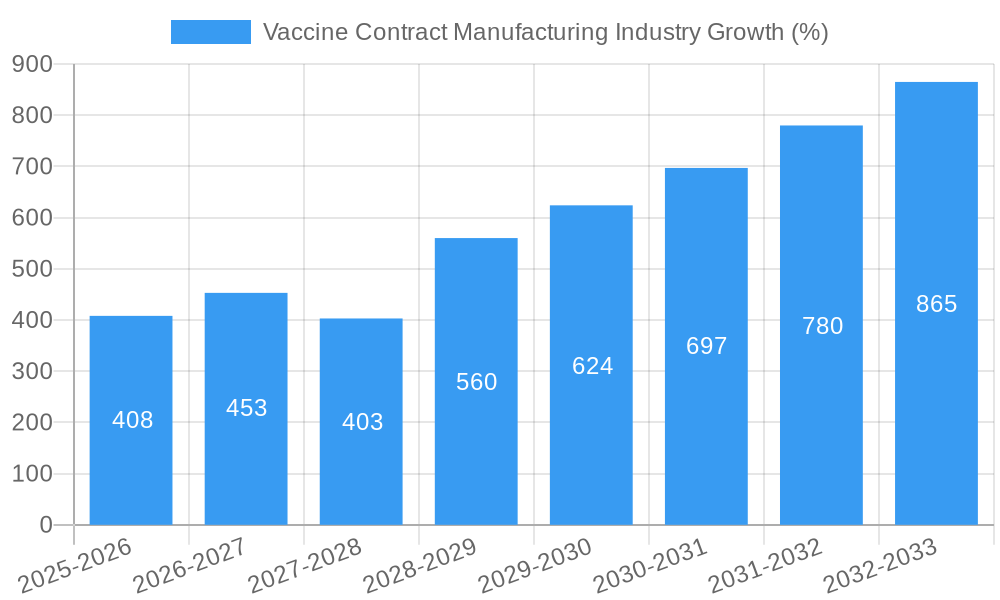
The vaccine contract manufacturing market witnessed significant growth during the historical period (2019-2024), driven by increased demand for vaccines globally. The COVID-19 pandemic accelerated this growth, highlighting the critical role of contract manufacturers in responding to public health emergencies. The market is projected to maintain a healthy CAGR of xx% during the forecast period (2025-2033), fueled by technological advancements, such as mRNA vaccines, and increasing government investments in vaccine development and infrastructure. Adoption rates for new technologies are expected to increase steadily, while consumer behavior shifts towards greater vaccine awareness and acceptance. Market size is estimated at xx million units in 2025 and projected to reach xx million units by 2033.
Dominant Regions, Countries, or Segments in Vaccine Contract Manufacturing Industry
North America and Europe currently dominate the vaccine contract manufacturing market, owing to established infrastructure, regulatory frameworks, and a high concentration of pharmaceutical companies. However, Asia-Pacific is experiencing rapid growth, driven by increasing investments in healthcare infrastructure and a growing demand for vaccines. Within vaccine types, RNA vaccines show the highest growth potential, followed by subunit and inactivated vaccines. Downstream processing dominates the market currently, although upstream manufacturing is gaining traction with the increasing demand for advanced vaccine technologies. The commercial scale of operations is the largest segment of the market.
- Key Drivers for North America: Strong regulatory framework, advanced technologies, and high research and development spending.
- Key Drivers for Asia-Pacific: Rapid economic growth, increasing healthcare spending, and government initiatives to improve healthcare infrastructure.
- High-Growth Segments: RNA Vaccines (xx% CAGR), Downstream Processing, Commercial Scale Operations.
Vaccine Contract Manufacturing Industry Product Landscape
The product landscape is evolving rapidly, with innovations focused on enhancing vaccine efficacy, stability, and manufacturing efficiency. This includes advancements in process optimization, automation, and the development of novel delivery systems. Key selling propositions include shorter lead times, cost-effectiveness, and advanced analytical capabilities for quality control. The emphasis is on developing flexible and scalable manufacturing platforms that can accommodate multiple vaccine types and changing demands.
Key Drivers, Barriers & Challenges in Vaccine Contract Manufacturing Industry
Key Drivers:
- Increased demand for vaccines globally due to rising disease prevalence and aging populations.
- Technological advancements in vaccine development and manufacturing processes.
- Government investments and initiatives to support vaccine production and distribution.
Key Challenges:
- High regulatory hurdles and compliance costs.
- Supply chain complexities and potential disruptions.
- Competition among contract manufacturers and potential price pressures.
- xx% increase in raw material costs in 2024 (estimated).
Emerging Opportunities in Vaccine Contract Manufacturing Industry
Emerging opportunities lie in the development and manufacturing of novel vaccines, such as mRNA and DNA vaccines, personalized vaccines, and vaccines against emerging infectious diseases. Untapped markets in developing countries offer substantial growth potential, while the evolving consumer preferences for safe and effective vaccines create opportunities for manufacturers to focus on transparency and communication.
Growth Accelerators in the Vaccine Contract Manufacturing Industry Industry
Strategic partnerships between contract manufacturers and pharmaceutical companies are accelerating market growth. Technological breakthroughs in automation and process optimization are improving efficiency and reducing manufacturing costs. The expansion of manufacturing capacities in emerging markets is broadening access to vaccines and fostering regional development.
Key Players Shaping the Vaccine Contract Manufacturing Industry Market
- CJ CheilJedang Corporation (Batavia Biosciences)
- Curia Global
- ICON PLC
- Charles River Laboratories International Inc
- Catalent
- IDT Biologika GmbH
- Lonza Group AG
- Gedeon Richter (Richter-Helm BioLogics)
- Ajinomoto Bio-Pharma Services
- Recipharm AB
- Emergent BioSolutions Inc
- Fujifilm Holdings Corporation
Notable Milestones in Vaccine Contract Manufacturing Industry Sector
- August 2022: Moderna and the Canadian government agree to build an mRNA vaccine manufacturing facility, boosting domestic vaccine production capabilities.
- June 2022: Merck and Agilent Technologies collaborate to improve downstream processing technologies, addressing a key bottleneck in vaccine manufacturing.
In-Depth Vaccine Contract Manufacturing Industry Market Outlook
The vaccine contract manufacturing market is poised for sustained growth, driven by ongoing technological advancements, increasing demand for vaccines, and strategic investments by both public and private sectors. Opportunities exist for contract manufacturers to expand their capacities, diversify their service offerings, and leverage partnerships to capture market share in a rapidly evolving landscape. The future holds significant potential for innovation and market expansion, creating both challenges and exciting opportunities for stakeholders in this critical sector.
Vaccine Contract Manufacturing Industry Segmentation
-
1. Vaccine Type
- 1.1. Inactivated Vaccines
- 1.2. Live-attenuated Vaccines
- 1.3. RNA Vaccines
- 1.4. Subunit Vaccines
- 1.5. Toxoid-based Vaccines
-
2. Process
-
2.1. Downstream
- 2.1.1. Analytical and QC Studies
- 2.1.2. Fill and Finish
- 2.1.3. Packaging
- 2.1.4. Other Downstream Processes
-
2.2. Upstream
- 2.2.1. Bacterial Expression Systems
- 2.2.2. Baculovirus/Insect Expression Systems
- 2.2.3. Mammalian Expression Systems
- 2.2.4. Yeast Expression Systems
- 2.2.5. Other Upstream Processes
-
2.1. Downstream
-
3. Scale of Operations
- 3.1. Preclinical
- 3.2. Clinical
- 3.3. Commercial
-
4. End Use
- 4.1. Human Use
- 4.2. Veterinary
Vaccine Contract Manufacturing Industry Segmentation By Geography
-
1. North America
- 1.1. United States
- 1.2. Canada
- 1.3. Mexico
-
2. Europe
- 2.1. Germany
- 2.2. United Kingdom
- 2.3. France
- 2.4. Italy
- 2.5. Spain
- 2.6. Rest of Europe
-
3. Asia Pacific
- 3.1. China
- 3.2. Japan
- 3.3. India
- 3.4. Australia
- 3.5. South Korea
- 3.6. Rest of Asia Pacific
-
4. Middle East and Africa
- 4.1. GCC
- 4.2. South Africa
- 4.3. Rest of Middle East and Africa
-
5. South America
- 5.1. Brazil
- 5.2. Argentina
- 5.3. Rest of South America
Vaccine Contract Manufacturing Industry REPORT HIGHLIGHTS
| Aspects | Details |
|---|---|
| Study Period | 2019-2033 |
| Base Year | 2024 |
| Estimated Year | 2025 |
| Forecast Period | 2025-2033 |
| Historical Period | 2019-2024 |
| Growth Rate | CAGR of 11.18% from 2019-2033 |
| Segmentation |
|
Table of Contents
- 1. Introduction
- 1.1. Research Scope
- 1.2. Market Segmentation
- 1.3. Research Methodology
- 1.4. Definitions and Assumptions
- 2. Executive Summary
- 2.1. Introduction
- 3. Market Dynamics
- 3.1. Introduction
- 3.2. Market Drivers
- 3.2.1. Advancements in Technology and Cost Benefits in Infrastructure and Operational Benefits; Increase in Initiatives Favoring Vaccinations; Favorable Patient Demographics and Growing Vaccinations of Newborns and Children
- 3.3. Market Restrains
- 3.3.1. Rising High Costs of Vaccines; Lack of Storage Infrastructure and Limitations Associated with Supply Chain
- 3.4. Market Trends
- 3.4.1. The Inactivated Vaccines Segment is Expected to Hold a Significant Share in the Vaccine Contract Manufacturing Market over the Forecast Period
- 4. Market Factor Analysis
- 4.1. Porters Five Forces
- 4.2. Supply/Value Chain
- 4.3. PESTEL analysis
- 4.4. Market Entropy
- 4.5. Patent/Trademark Analysis
- 5. Global Vaccine Contract Manufacturing Industry Analysis, Insights and Forecast, 2019-2031
- 5.1. Market Analysis, Insights and Forecast - by Vaccine Type
- 5.1.1. Inactivated Vaccines
- 5.1.2. Live-attenuated Vaccines
- 5.1.3. RNA Vaccines
- 5.1.4. Subunit Vaccines
- 5.1.5. Toxoid-based Vaccines
- 5.2. Market Analysis, Insights and Forecast - by Process
- 5.2.1. Downstream
- 5.2.1.1. Analytical and QC Studies
- 5.2.1.2. Fill and Finish
- 5.2.1.3. Packaging
- 5.2.1.4. Other Downstream Processes
- 5.2.2. Upstream
- 5.2.2.1. Bacterial Expression Systems
- 5.2.2.2. Baculovirus/Insect Expression Systems
- 5.2.2.3. Mammalian Expression Systems
- 5.2.2.4. Yeast Expression Systems
- 5.2.2.5. Other Upstream Processes
- 5.2.1. Downstream
- 5.3. Market Analysis, Insights and Forecast - by Scale of Operations
- 5.3.1. Preclinical
- 5.3.2. Clinical
- 5.3.3. Commercial
- 5.4. Market Analysis, Insights and Forecast - by End Use
- 5.4.1. Human Use
- 5.4.2. Veterinary
- 5.5. Market Analysis, Insights and Forecast - by Region
- 5.5.1. North America
- 5.5.2. Europe
- 5.5.3. Asia Pacific
- 5.5.4. Middle East and Africa
- 5.5.5. South America
- 5.1. Market Analysis, Insights and Forecast - by Vaccine Type
- 6. North America Vaccine Contract Manufacturing Industry Analysis, Insights and Forecast, 2019-2031
- 6.1. Market Analysis, Insights and Forecast - by Vaccine Type
- 6.1.1. Inactivated Vaccines
- 6.1.2. Live-attenuated Vaccines
- 6.1.3. RNA Vaccines
- 6.1.4. Subunit Vaccines
- 6.1.5. Toxoid-based Vaccines
- 6.2. Market Analysis, Insights and Forecast - by Process
- 6.2.1. Downstream
- 6.2.1.1. Analytical and QC Studies
- 6.2.1.2. Fill and Finish
- 6.2.1.3. Packaging
- 6.2.1.4. Other Downstream Processes
- 6.2.2. Upstream
- 6.2.2.1. Bacterial Expression Systems
- 6.2.2.2. Baculovirus/Insect Expression Systems
- 6.2.2.3. Mammalian Expression Systems
- 6.2.2.4. Yeast Expression Systems
- 6.2.2.5. Other Upstream Processes
- 6.2.1. Downstream
- 6.3. Market Analysis, Insights and Forecast - by Scale of Operations
- 6.3.1. Preclinical
- 6.3.2. Clinical
- 6.3.3. Commercial
- 6.4. Market Analysis, Insights and Forecast - by End Use
- 6.4.1. Human Use
- 6.4.2. Veterinary
- 6.1. Market Analysis, Insights and Forecast - by Vaccine Type
- 7. Europe Vaccine Contract Manufacturing Industry Analysis, Insights and Forecast, 2019-2031
- 7.1. Market Analysis, Insights and Forecast - by Vaccine Type
- 7.1.1. Inactivated Vaccines
- 7.1.2. Live-attenuated Vaccines
- 7.1.3. RNA Vaccines
- 7.1.4. Subunit Vaccines
- 7.1.5. Toxoid-based Vaccines
- 7.2. Market Analysis, Insights and Forecast - by Process
- 7.2.1. Downstream
- 7.2.1.1. Analytical and QC Studies
- 7.2.1.2. Fill and Finish
- 7.2.1.3. Packaging
- 7.2.1.4. Other Downstream Processes
- 7.2.2. Upstream
- 7.2.2.1. Bacterial Expression Systems
- 7.2.2.2. Baculovirus/Insect Expression Systems
- 7.2.2.3. Mammalian Expression Systems
- 7.2.2.4. Yeast Expression Systems
- 7.2.2.5. Other Upstream Processes
- 7.2.1. Downstream
- 7.3. Market Analysis, Insights and Forecast - by Scale of Operations
- 7.3.1. Preclinical
- 7.3.2. Clinical
- 7.3.3. Commercial
- 7.4. Market Analysis, Insights and Forecast - by End Use
- 7.4.1. Human Use
- 7.4.2. Veterinary
- 7.1. Market Analysis, Insights and Forecast - by Vaccine Type
- 8. Asia Pacific Vaccine Contract Manufacturing Industry Analysis, Insights and Forecast, 2019-2031
- 8.1. Market Analysis, Insights and Forecast - by Vaccine Type
- 8.1.1. Inactivated Vaccines
- 8.1.2. Live-attenuated Vaccines
- 8.1.3. RNA Vaccines
- 8.1.4. Subunit Vaccines
- 8.1.5. Toxoid-based Vaccines
- 8.2. Market Analysis, Insights and Forecast - by Process
- 8.2.1. Downstream
- 8.2.1.1. Analytical and QC Studies
- 8.2.1.2. Fill and Finish
- 8.2.1.3. Packaging
- 8.2.1.4. Other Downstream Processes
- 8.2.2. Upstream
- 8.2.2.1. Bacterial Expression Systems
- 8.2.2.2. Baculovirus/Insect Expression Systems
- 8.2.2.3. Mammalian Expression Systems
- 8.2.2.4. Yeast Expression Systems
- 8.2.2.5. Other Upstream Processes
- 8.2.1. Downstream
- 8.3. Market Analysis, Insights and Forecast - by Scale of Operations
- 8.3.1. Preclinical
- 8.3.2. Clinical
- 8.3.3. Commercial
- 8.4. Market Analysis, Insights and Forecast - by End Use
- 8.4.1. Human Use
- 8.4.2. Veterinary
- 8.1. Market Analysis, Insights and Forecast - by Vaccine Type
- 9. Middle East and Africa Vaccine Contract Manufacturing Industry Analysis, Insights and Forecast, 2019-2031
- 9.1. Market Analysis, Insights and Forecast - by Vaccine Type
- 9.1.1. Inactivated Vaccines
- 9.1.2. Live-attenuated Vaccines
- 9.1.3. RNA Vaccines
- 9.1.4. Subunit Vaccines
- 9.1.5. Toxoid-based Vaccines
- 9.2. Market Analysis, Insights and Forecast - by Process
- 9.2.1. Downstream
- 9.2.1.1. Analytical and QC Studies
- 9.2.1.2. Fill and Finish
- 9.2.1.3. Packaging
- 9.2.1.4. Other Downstream Processes
- 9.2.2. Upstream
- 9.2.2.1. Bacterial Expression Systems
- 9.2.2.2. Baculovirus/Insect Expression Systems
- 9.2.2.3. Mammalian Expression Systems
- 9.2.2.4. Yeast Expression Systems
- 9.2.2.5. Other Upstream Processes
- 9.2.1. Downstream
- 9.3. Market Analysis, Insights and Forecast - by Scale of Operations
- 9.3.1. Preclinical
- 9.3.2. Clinical
- 9.3.3. Commercial
- 9.4. Market Analysis, Insights and Forecast - by End Use
- 9.4.1. Human Use
- 9.4.2. Veterinary
- 9.1. Market Analysis, Insights and Forecast - by Vaccine Type
- 10. South America Vaccine Contract Manufacturing Industry Analysis, Insights and Forecast, 2019-2031
- 10.1. Market Analysis, Insights and Forecast - by Vaccine Type
- 10.1.1. Inactivated Vaccines
- 10.1.2. Live-attenuated Vaccines
- 10.1.3. RNA Vaccines
- 10.1.4. Subunit Vaccines
- 10.1.5. Toxoid-based Vaccines
- 10.2. Market Analysis, Insights and Forecast - by Process
- 10.2.1. Downstream
- 10.2.1.1. Analytical and QC Studies
- 10.2.1.2. Fill and Finish
- 10.2.1.3. Packaging
- 10.2.1.4. Other Downstream Processes
- 10.2.2. Upstream
- 10.2.2.1. Bacterial Expression Systems
- 10.2.2.2. Baculovirus/Insect Expression Systems
- 10.2.2.3. Mammalian Expression Systems
- 10.2.2.4. Yeast Expression Systems
- 10.2.2.5. Other Upstream Processes
- 10.2.1. Downstream
- 10.3. Market Analysis, Insights and Forecast - by Scale of Operations
- 10.3.1. Preclinical
- 10.3.2. Clinical
- 10.3.3. Commercial
- 10.4. Market Analysis, Insights and Forecast - by End Use
- 10.4.1. Human Use
- 10.4.2. Veterinary
- 10.1. Market Analysis, Insights and Forecast - by Vaccine Type
- 11. North America Vaccine Contract Manufacturing Industry Analysis, Insights and Forecast, 2019-2031
- 11.1. Market Analysis, Insights and Forecast - By Country/Sub-region
- 11.1.1. undefined
- 12. Europe Vaccine Contract Manufacturing Industry Analysis, Insights and Forecast, 2019-2031
- 12.1. Market Analysis, Insights and Forecast - By Country/Sub-region
- 12.1.1. undefined
- 13. Asia Pacific Vaccine Contract Manufacturing Industry Analysis, Insights and Forecast, 2019-2031
- 13.1. Market Analysis, Insights and Forecast - By Country/Sub-region
- 13.1.1. undefined
- 14. Middle East and Africa Vaccine Contract Manufacturing Industry Analysis, Insights and Forecast, 2019-2031
- 14.1. Market Analysis, Insights and Forecast - By Country/Sub-region
- 14.1.1. undefined
- 15. South America Vaccine Contract Manufacturing Industry Analysis, Insights and Forecast, 2019-2031
- 15.1. Market Analysis, Insights and Forecast - By Country/Sub-region
- 15.1.1. undefined
- 16. Competitive Analysis
- 16.1. Global Market Share Analysis 2024
- 16.2. Company Profiles
- 16.2.1 CJ CheilJedang Corporation (Batavia Biosciences)
- 16.2.1.1. Overview
- 16.2.1.2. Products
- 16.2.1.3. SWOT Analysis
- 16.2.1.4. Recent Developments
- 16.2.1.5. Financials (Based on Availability)
- 16.2.2 Curia Global
- 16.2.2.1. Overview
- 16.2.2.2. Products
- 16.2.2.3. SWOT Analysis
- 16.2.2.4. Recent Developments
- 16.2.2.5. Financials (Based on Availability)
- 16.2.3 ICON PLC
- 16.2.3.1. Overview
- 16.2.3.2. Products
- 16.2.3.3. SWOT Analysis
- 16.2.3.4. Recent Developments
- 16.2.3.5. Financials (Based on Availability)
- 16.2.4 Charles River Laboratories International Inc
- 16.2.4.1. Overview
- 16.2.4.2. Products
- 16.2.4.3. SWOT Analysis
- 16.2.4.4. Recent Developments
- 16.2.4.5. Financials (Based on Availability)
- 16.2.5 Catalent
- 16.2.5.1. Overview
- 16.2.5.2. Products
- 16.2.5.3. SWOT Analysis
- 16.2.5.4. Recent Developments
- 16.2.5.5. Financials (Based on Availability)
- 16.2.6 IDT Biologika GmbH
- 16.2.6.1. Overview
- 16.2.6.2. Products
- 16.2.6.3. SWOT Analysis
- 16.2.6.4. Recent Developments
- 16.2.6.5. Financials (Based on Availability)
- 16.2.7 Lonza Group AG
- 16.2.7.1. Overview
- 16.2.7.2. Products
- 16.2.7.3. SWOT Analysis
- 16.2.7.4. Recent Developments
- 16.2.7.5. Financials (Based on Availability)
- 16.2.8 Gedeon Richter (Richter-Helm BioLogics)
- 16.2.8.1. Overview
- 16.2.8.2. Products
- 16.2.8.3. SWOT Analysis
- 16.2.8.4. Recent Developments
- 16.2.8.5. Financials (Based on Availability)
- 16.2.9 Ajinomoto Bio-Pharma Services
- 16.2.9.1. Overview
- 16.2.9.2. Products
- 16.2.9.3. SWOT Analysis
- 16.2.9.4. Recent Developments
- 16.2.9.5. Financials (Based on Availability)
- 16.2.10 Recipharm AB
- 16.2.10.1. Overview
- 16.2.10.2. Products
- 16.2.10.3. SWOT Analysis
- 16.2.10.4. Recent Developments
- 16.2.10.5. Financials (Based on Availability)
- 16.2.11 Emergent BioSolutions Inc
- 16.2.11.1. Overview
- 16.2.11.2. Products
- 16.2.11.3. SWOT Analysis
- 16.2.11.4. Recent Developments
- 16.2.11.5. Financials (Based on Availability)
- 16.2.12 Fujifilm Holdings Corporation
- 16.2.12.1. Overview
- 16.2.12.2. Products
- 16.2.12.3. SWOT Analysis
- 16.2.12.4. Recent Developments
- 16.2.12.5. Financials (Based on Availability)
- 16.2.1 CJ CheilJedang Corporation (Batavia Biosciences)
List of Figures
- Figure 1: Global Vaccine Contract Manufacturing Industry Revenue Breakdown (Million, %) by Region 2024 & 2032
- Figure 2: Global Vaccine Contract Manufacturing Industry Volume Breakdown (K Unit, %) by Region 2024 & 2032
- Figure 3: North America Vaccine Contract Manufacturing Industry Revenue (Million), by Country 2024 & 2032
- Figure 4: North America Vaccine Contract Manufacturing Industry Volume (K Unit), by Country 2024 & 2032
- Figure 5: North America Vaccine Contract Manufacturing Industry Revenue Share (%), by Country 2024 & 2032
- Figure 6: North America Vaccine Contract Manufacturing Industry Volume Share (%), by Country 2024 & 2032
- Figure 7: Europe Vaccine Contract Manufacturing Industry Revenue (Million), by Country 2024 & 2032
- Figure 8: Europe Vaccine Contract Manufacturing Industry Volume (K Unit), by Country 2024 & 2032
- Figure 9: Europe Vaccine Contract Manufacturing Industry Revenue Share (%), by Country 2024 & 2032
- Figure 10: Europe Vaccine Contract Manufacturing Industry Volume Share (%), by Country 2024 & 2032
- Figure 11: Asia Pacific Vaccine Contract Manufacturing Industry Revenue (Million), by Country 2024 & 2032
- Figure 12: Asia Pacific Vaccine Contract Manufacturing Industry Volume (K Unit), by Country 2024 & 2032
- Figure 13: Asia Pacific Vaccine Contract Manufacturing Industry Revenue Share (%), by Country 2024 & 2032
- Figure 14: Asia Pacific Vaccine Contract Manufacturing Industry Volume Share (%), by Country 2024 & 2032
- Figure 15: Middle East and Africa Vaccine Contract Manufacturing Industry Revenue (Million), by Country 2024 & 2032
- Figure 16: Middle East and Africa Vaccine Contract Manufacturing Industry Volume (K Unit), by Country 2024 & 2032
- Figure 17: Middle East and Africa Vaccine Contract Manufacturing Industry Revenue Share (%), by Country 2024 & 2032
- Figure 18: Middle East and Africa Vaccine Contract Manufacturing Industry Volume Share (%), by Country 2024 & 2032
- Figure 19: South America Vaccine Contract Manufacturing Industry Revenue (Million), by Country 2024 & 2032
- Figure 20: South America Vaccine Contract Manufacturing Industry Volume (K Unit), by Country 2024 & 2032
- Figure 21: South America Vaccine Contract Manufacturing Industry Revenue Share (%), by Country 2024 & 2032
- Figure 22: South America Vaccine Contract Manufacturing Industry Volume Share (%), by Country 2024 & 2032
- Figure 23: North America Vaccine Contract Manufacturing Industry Revenue (Million), by Vaccine Type 2024 & 2032
- Figure 24: North America Vaccine Contract Manufacturing Industry Volume (K Unit), by Vaccine Type 2024 & 2032
- Figure 25: North America Vaccine Contract Manufacturing Industry Revenue Share (%), by Vaccine Type 2024 & 2032
- Figure 26: North America Vaccine Contract Manufacturing Industry Volume Share (%), by Vaccine Type 2024 & 2032
- Figure 27: North America Vaccine Contract Manufacturing Industry Revenue (Million), by Process 2024 & 2032
- Figure 28: North America Vaccine Contract Manufacturing Industry Volume (K Unit), by Process 2024 & 2032
- Figure 29: North America Vaccine Contract Manufacturing Industry Revenue Share (%), by Process 2024 & 2032
- Figure 30: North America Vaccine Contract Manufacturing Industry Volume Share (%), by Process 2024 & 2032
- Figure 31: North America Vaccine Contract Manufacturing Industry Revenue (Million), by Scale of Operations 2024 & 2032
- Figure 32: North America Vaccine Contract Manufacturing Industry Volume (K Unit), by Scale of Operations 2024 & 2032
- Figure 33: North America Vaccine Contract Manufacturing Industry Revenue Share (%), by Scale of Operations 2024 & 2032
- Figure 34: North America Vaccine Contract Manufacturing Industry Volume Share (%), by Scale of Operations 2024 & 2032
- Figure 35: North America Vaccine Contract Manufacturing Industry Revenue (Million), by End Use 2024 & 2032
- Figure 36: North America Vaccine Contract Manufacturing Industry Volume (K Unit), by End Use 2024 & 2032
- Figure 37: North America Vaccine Contract Manufacturing Industry Revenue Share (%), by End Use 2024 & 2032
- Figure 38: North America Vaccine Contract Manufacturing Industry Volume Share (%), by End Use 2024 & 2032
- Figure 39: North America Vaccine Contract Manufacturing Industry Revenue (Million), by Country 2024 & 2032
- Figure 40: North America Vaccine Contract Manufacturing Industry Volume (K Unit), by Country 2024 & 2032
- Figure 41: North America Vaccine Contract Manufacturing Industry Revenue Share (%), by Country 2024 & 2032
- Figure 42: North America Vaccine Contract Manufacturing Industry Volume Share (%), by Country 2024 & 2032
- Figure 43: Europe Vaccine Contract Manufacturing Industry Revenue (Million), by Vaccine Type 2024 & 2032
- Figure 44: Europe Vaccine Contract Manufacturing Industry Volume (K Unit), by Vaccine Type 2024 & 2032
- Figure 45: Europe Vaccine Contract Manufacturing Industry Revenue Share (%), by Vaccine Type 2024 & 2032
- Figure 46: Europe Vaccine Contract Manufacturing Industry Volume Share (%), by Vaccine Type 2024 & 2032
- Figure 47: Europe Vaccine Contract Manufacturing Industry Revenue (Million), by Process 2024 & 2032
- Figure 48: Europe Vaccine Contract Manufacturing Industry Volume (K Unit), by Process 2024 & 2032
- Figure 49: Europe Vaccine Contract Manufacturing Industry Revenue Share (%), by Process 2024 & 2032
- Figure 50: Europe Vaccine Contract Manufacturing Industry Volume Share (%), by Process 2024 & 2032
- Figure 51: Europe Vaccine Contract Manufacturing Industry Revenue (Million), by Scale of Operations 2024 & 2032
- Figure 52: Europe Vaccine Contract Manufacturing Industry Volume (K Unit), by Scale of Operations 2024 & 2032
- Figure 53: Europe Vaccine Contract Manufacturing Industry Revenue Share (%), by Scale of Operations 2024 & 2032
- Figure 54: Europe Vaccine Contract Manufacturing Industry Volume Share (%), by Scale of Operations 2024 & 2032
- Figure 55: Europe Vaccine Contract Manufacturing Industry Revenue (Million), by End Use 2024 & 2032
- Figure 56: Europe Vaccine Contract Manufacturing Industry Volume (K Unit), by End Use 2024 & 2032
- Figure 57: Europe Vaccine Contract Manufacturing Industry Revenue Share (%), by End Use 2024 & 2032
- Figure 58: Europe Vaccine Contract Manufacturing Industry Volume Share (%), by End Use 2024 & 2032
- Figure 59: Europe Vaccine Contract Manufacturing Industry Revenue (Million), by Country 2024 & 2032
- Figure 60: Europe Vaccine Contract Manufacturing Industry Volume (K Unit), by Country 2024 & 2032
- Figure 61: Europe Vaccine Contract Manufacturing Industry Revenue Share (%), by Country 2024 & 2032
- Figure 62: Europe Vaccine Contract Manufacturing Industry Volume Share (%), by Country 2024 & 2032
- Figure 63: Asia Pacific Vaccine Contract Manufacturing Industry Revenue (Million), by Vaccine Type 2024 & 2032
- Figure 64: Asia Pacific Vaccine Contract Manufacturing Industry Volume (K Unit), by Vaccine Type 2024 & 2032
- Figure 65: Asia Pacific Vaccine Contract Manufacturing Industry Revenue Share (%), by Vaccine Type 2024 & 2032
- Figure 66: Asia Pacific Vaccine Contract Manufacturing Industry Volume Share (%), by Vaccine Type 2024 & 2032
- Figure 67: Asia Pacific Vaccine Contract Manufacturing Industry Revenue (Million), by Process 2024 & 2032
- Figure 68: Asia Pacific Vaccine Contract Manufacturing Industry Volume (K Unit), by Process 2024 & 2032
- Figure 69: Asia Pacific Vaccine Contract Manufacturing Industry Revenue Share (%), by Process 2024 & 2032
- Figure 70: Asia Pacific Vaccine Contract Manufacturing Industry Volume Share (%), by Process 2024 & 2032
- Figure 71: Asia Pacific Vaccine Contract Manufacturing Industry Revenue (Million), by Scale of Operations 2024 & 2032
- Figure 72: Asia Pacific Vaccine Contract Manufacturing Industry Volume (K Unit), by Scale of Operations 2024 & 2032
- Figure 73: Asia Pacific Vaccine Contract Manufacturing Industry Revenue Share (%), by Scale of Operations 2024 & 2032
- Figure 74: Asia Pacific Vaccine Contract Manufacturing Industry Volume Share (%), by Scale of Operations 2024 & 2032
- Figure 75: Asia Pacific Vaccine Contract Manufacturing Industry Revenue (Million), by End Use 2024 & 2032
- Figure 76: Asia Pacific Vaccine Contract Manufacturing Industry Volume (K Unit), by End Use 2024 & 2032
- Figure 77: Asia Pacific Vaccine Contract Manufacturing Industry Revenue Share (%), by End Use 2024 & 2032
- Figure 78: Asia Pacific Vaccine Contract Manufacturing Industry Volume Share (%), by End Use 2024 & 2032
- Figure 79: Asia Pacific Vaccine Contract Manufacturing Industry Revenue (Million), by Country 2024 & 2032
- Figure 80: Asia Pacific Vaccine Contract Manufacturing Industry Volume (K Unit), by Country 2024 & 2032
- Figure 81: Asia Pacific Vaccine Contract Manufacturing Industry Revenue Share (%), by Country 2024 & 2032
- Figure 82: Asia Pacific Vaccine Contract Manufacturing Industry Volume Share (%), by Country 2024 & 2032
- Figure 83: Middle East and Africa Vaccine Contract Manufacturing Industry Revenue (Million), by Vaccine Type 2024 & 2032
- Figure 84: Middle East and Africa Vaccine Contract Manufacturing Industry Volume (K Unit), by Vaccine Type 2024 & 2032
- Figure 85: Middle East and Africa Vaccine Contract Manufacturing Industry Revenue Share (%), by Vaccine Type 2024 & 2032
- Figure 86: Middle East and Africa Vaccine Contract Manufacturing Industry Volume Share (%), by Vaccine Type 2024 & 2032
- Figure 87: Middle East and Africa Vaccine Contract Manufacturing Industry Revenue (Million), by Process 2024 & 2032
- Figure 88: Middle East and Africa Vaccine Contract Manufacturing Industry Volume (K Unit), by Process 2024 & 2032
- Figure 89: Middle East and Africa Vaccine Contract Manufacturing Industry Revenue Share (%), by Process 2024 & 2032
- Figure 90: Middle East and Africa Vaccine Contract Manufacturing Industry Volume Share (%), by Process 2024 & 2032
- Figure 91: Middle East and Africa Vaccine Contract Manufacturing Industry Revenue (Million), by Scale of Operations 2024 & 2032
- Figure 92: Middle East and Africa Vaccine Contract Manufacturing Industry Volume (K Unit), by Scale of Operations 2024 & 2032
- Figure 93: Middle East and Africa Vaccine Contract Manufacturing Industry Revenue Share (%), by Scale of Operations 2024 & 2032
- Figure 94: Middle East and Africa Vaccine Contract Manufacturing Industry Volume Share (%), by Scale of Operations 2024 & 2032
- Figure 95: Middle East and Africa Vaccine Contract Manufacturing Industry Revenue (Million), by End Use 2024 & 2032
- Figure 96: Middle East and Africa Vaccine Contract Manufacturing Industry Volume (K Unit), by End Use 2024 & 2032
- Figure 97: Middle East and Africa Vaccine Contract Manufacturing Industry Revenue Share (%), by End Use 2024 & 2032
- Figure 98: Middle East and Africa Vaccine Contract Manufacturing Industry Volume Share (%), by End Use 2024 & 2032
- Figure 99: Middle East and Africa Vaccine Contract Manufacturing Industry Revenue (Million), by Country 2024 & 2032
- Figure 100: Middle East and Africa Vaccine Contract Manufacturing Industry Volume (K Unit), by Country 2024 & 2032
- Figure 101: Middle East and Africa Vaccine Contract Manufacturing Industry Revenue Share (%), by Country 2024 & 2032
- Figure 102: Middle East and Africa Vaccine Contract Manufacturing Industry Volume Share (%), by Country 2024 & 2032
- Figure 103: South America Vaccine Contract Manufacturing Industry Revenue (Million), by Vaccine Type 2024 & 2032
- Figure 104: South America Vaccine Contract Manufacturing Industry Volume (K Unit), by Vaccine Type 2024 & 2032
- Figure 105: South America Vaccine Contract Manufacturing Industry Revenue Share (%), by Vaccine Type 2024 & 2032
- Figure 106: South America Vaccine Contract Manufacturing Industry Volume Share (%), by Vaccine Type 2024 & 2032
- Figure 107: South America Vaccine Contract Manufacturing Industry Revenue (Million), by Process 2024 & 2032
- Figure 108: South America Vaccine Contract Manufacturing Industry Volume (K Unit), by Process 2024 & 2032
- Figure 109: South America Vaccine Contract Manufacturing Industry Revenue Share (%), by Process 2024 & 2032
- Figure 110: South America Vaccine Contract Manufacturing Industry Volume Share (%), by Process 2024 & 2032
- Figure 111: South America Vaccine Contract Manufacturing Industry Revenue (Million), by Scale of Operations 2024 & 2032
- Figure 112: South America Vaccine Contract Manufacturing Industry Volume (K Unit), by Scale of Operations 2024 & 2032
- Figure 113: South America Vaccine Contract Manufacturing Industry Revenue Share (%), by Scale of Operations 2024 & 2032
- Figure 114: South America Vaccine Contract Manufacturing Industry Volume Share (%), by Scale of Operations 2024 & 2032
- Figure 115: South America Vaccine Contract Manufacturing Industry Revenue (Million), by End Use 2024 & 2032
- Figure 116: South America Vaccine Contract Manufacturing Industry Volume (K Unit), by End Use 2024 & 2032
- Figure 117: South America Vaccine Contract Manufacturing Industry Revenue Share (%), by End Use 2024 & 2032
- Figure 118: South America Vaccine Contract Manufacturing Industry Volume Share (%), by End Use 2024 & 2032
- Figure 119: South America Vaccine Contract Manufacturing Industry Revenue (Million), by Country 2024 & 2032
- Figure 120: South America Vaccine Contract Manufacturing Industry Volume (K Unit), by Country 2024 & 2032
- Figure 121: South America Vaccine Contract Manufacturing Industry Revenue Share (%), by Country 2024 & 2032
- Figure 122: South America Vaccine Contract Manufacturing Industry Volume Share (%), by Country 2024 & 2032
List of Tables
- Table 1: Global Vaccine Contract Manufacturing Industry Revenue Million Forecast, by Region 2019 & 2032
- Table 2: Global Vaccine Contract Manufacturing Industry Volume K Unit Forecast, by Region 2019 & 2032
- Table 3: Global Vaccine Contract Manufacturing Industry Revenue Million Forecast, by Vaccine Type 2019 & 2032
- Table 4: Global Vaccine Contract Manufacturing Industry Volume K Unit Forecast, by Vaccine Type 2019 & 2032
- Table 5: Global Vaccine Contract Manufacturing Industry Revenue Million Forecast, by Process 2019 & 2032
- Table 6: Global Vaccine Contract Manufacturing Industry Volume K Unit Forecast, by Process 2019 & 2032
- Table 7: Global Vaccine Contract Manufacturing Industry Revenue Million Forecast, by Scale of Operations 2019 & 2032
- Table 8: Global Vaccine Contract Manufacturing Industry Volume K Unit Forecast, by Scale of Operations 2019 & 2032
- Table 9: Global Vaccine Contract Manufacturing Industry Revenue Million Forecast, by End Use 2019 & 2032
- Table 10: Global Vaccine Contract Manufacturing Industry Volume K Unit Forecast, by End Use 2019 & 2032
- Table 11: Global Vaccine Contract Manufacturing Industry Revenue Million Forecast, by Region 2019 & 2032
- Table 12: Global Vaccine Contract Manufacturing Industry Volume K Unit Forecast, by Region 2019 & 2032
- Table 13: Global Vaccine Contract Manufacturing Industry Revenue Million Forecast, by Country 2019 & 2032
- Table 14: Global Vaccine Contract Manufacturing Industry Volume K Unit Forecast, by Country 2019 & 2032
- Table 15: Global Vaccine Contract Manufacturing Industry Revenue Million Forecast, by Country 2019 & 2032
- Table 16: Global Vaccine Contract Manufacturing Industry Volume K Unit Forecast, by Country 2019 & 2032
- Table 17: Global Vaccine Contract Manufacturing Industry Revenue Million Forecast, by Country 2019 & 2032
- Table 18: Global Vaccine Contract Manufacturing Industry Volume K Unit Forecast, by Country 2019 & 2032
- Table 19: Global Vaccine Contract Manufacturing Industry Revenue Million Forecast, by Country 2019 & 2032
- Table 20: Global Vaccine Contract Manufacturing Industry Volume K Unit Forecast, by Country 2019 & 2032
- Table 21: Global Vaccine Contract Manufacturing Industry Revenue Million Forecast, by Country 2019 & 2032
- Table 22: Global Vaccine Contract Manufacturing Industry Volume K Unit Forecast, by Country 2019 & 2032
- Table 23: Global Vaccine Contract Manufacturing Industry Revenue Million Forecast, by Vaccine Type 2019 & 2032
- Table 24: Global Vaccine Contract Manufacturing Industry Volume K Unit Forecast, by Vaccine Type 2019 & 2032
- Table 25: Global Vaccine Contract Manufacturing Industry Revenue Million Forecast, by Process 2019 & 2032
- Table 26: Global Vaccine Contract Manufacturing Industry Volume K Unit Forecast, by Process 2019 & 2032
- Table 27: Global Vaccine Contract Manufacturing Industry Revenue Million Forecast, by Scale of Operations 2019 & 2032
- Table 28: Global Vaccine Contract Manufacturing Industry Volume K Unit Forecast, by Scale of Operations 2019 & 2032
- Table 29: Global Vaccine Contract Manufacturing Industry Revenue Million Forecast, by End Use 2019 & 2032
- Table 30: Global Vaccine Contract Manufacturing Industry Volume K Unit Forecast, by End Use 2019 & 2032
- Table 31: Global Vaccine Contract Manufacturing Industry Revenue Million Forecast, by Country 2019 & 2032
- Table 32: Global Vaccine Contract Manufacturing Industry Volume K Unit Forecast, by Country 2019 & 2032
- Table 33: United States Vaccine Contract Manufacturing Industry Revenue (Million) Forecast, by Application 2019 & 2032
- Table 34: United States Vaccine Contract Manufacturing Industry Volume (K Unit) Forecast, by Application 2019 & 2032
- Table 35: Canada Vaccine Contract Manufacturing Industry Revenue (Million) Forecast, by Application 2019 & 2032
- Table 36: Canada Vaccine Contract Manufacturing Industry Volume (K Unit) Forecast, by Application 2019 & 2032
- Table 37: Mexico Vaccine Contract Manufacturing Industry Revenue (Million) Forecast, by Application 2019 & 2032
- Table 38: Mexico Vaccine Contract Manufacturing Industry Volume (K Unit) Forecast, by Application 2019 & 2032
- Table 39: Global Vaccine Contract Manufacturing Industry Revenue Million Forecast, by Vaccine Type 2019 & 2032
- Table 40: Global Vaccine Contract Manufacturing Industry Volume K Unit Forecast, by Vaccine Type 2019 & 2032
- Table 41: Global Vaccine Contract Manufacturing Industry Revenue Million Forecast, by Process 2019 & 2032
- Table 42: Global Vaccine Contract Manufacturing Industry Volume K Unit Forecast, by Process 2019 & 2032
- Table 43: Global Vaccine Contract Manufacturing Industry Revenue Million Forecast, by Scale of Operations 2019 & 2032
- Table 44: Global Vaccine Contract Manufacturing Industry Volume K Unit Forecast, by Scale of Operations 2019 & 2032
- Table 45: Global Vaccine Contract Manufacturing Industry Revenue Million Forecast, by End Use 2019 & 2032
- Table 46: Global Vaccine Contract Manufacturing Industry Volume K Unit Forecast, by End Use 2019 & 2032
- Table 47: Global Vaccine Contract Manufacturing Industry Revenue Million Forecast, by Country 2019 & 2032
- Table 48: Global Vaccine Contract Manufacturing Industry Volume K Unit Forecast, by Country 2019 & 2032
- Table 49: Germany Vaccine Contract Manufacturing Industry Revenue (Million) Forecast, by Application 2019 & 2032
- Table 50: Germany Vaccine Contract Manufacturing Industry Volume (K Unit) Forecast, by Application 2019 & 2032
- Table 51: United Kingdom Vaccine Contract Manufacturing Industry Revenue (Million) Forecast, by Application 2019 & 2032
- Table 52: United Kingdom Vaccine Contract Manufacturing Industry Volume (K Unit) Forecast, by Application 2019 & 2032
- Table 53: France Vaccine Contract Manufacturing Industry Revenue (Million) Forecast, by Application 2019 & 2032
- Table 54: France Vaccine Contract Manufacturing Industry Volume (K Unit) Forecast, by Application 2019 & 2032
- Table 55: Italy Vaccine Contract Manufacturing Industry Revenue (Million) Forecast, by Application 2019 & 2032
- Table 56: Italy Vaccine Contract Manufacturing Industry Volume (K Unit) Forecast, by Application 2019 & 2032
- Table 57: Spain Vaccine Contract Manufacturing Industry Revenue (Million) Forecast, by Application 2019 & 2032
- Table 58: Spain Vaccine Contract Manufacturing Industry Volume (K Unit) Forecast, by Application 2019 & 2032
- Table 59: Rest of Europe Vaccine Contract Manufacturing Industry Revenue (Million) Forecast, by Application 2019 & 2032
- Table 60: Rest of Europe Vaccine Contract Manufacturing Industry Volume (K Unit) Forecast, by Application 2019 & 2032
- Table 61: Global Vaccine Contract Manufacturing Industry Revenue Million Forecast, by Vaccine Type 2019 & 2032
- Table 62: Global Vaccine Contract Manufacturing Industry Volume K Unit Forecast, by Vaccine Type 2019 & 2032
- Table 63: Global Vaccine Contract Manufacturing Industry Revenue Million Forecast, by Process 2019 & 2032
- Table 64: Global Vaccine Contract Manufacturing Industry Volume K Unit Forecast, by Process 2019 & 2032
- Table 65: Global Vaccine Contract Manufacturing Industry Revenue Million Forecast, by Scale of Operations 2019 & 2032
- Table 66: Global Vaccine Contract Manufacturing Industry Volume K Unit Forecast, by Scale of Operations 2019 & 2032
- Table 67: Global Vaccine Contract Manufacturing Industry Revenue Million Forecast, by End Use 2019 & 2032
- Table 68: Global Vaccine Contract Manufacturing Industry Volume K Unit Forecast, by End Use 2019 & 2032
- Table 69: Global Vaccine Contract Manufacturing Industry Revenue Million Forecast, by Country 2019 & 2032
- Table 70: Global Vaccine Contract Manufacturing Industry Volume K Unit Forecast, by Country 2019 & 2032
- Table 71: China Vaccine Contract Manufacturing Industry Revenue (Million) Forecast, by Application 2019 & 2032
- Table 72: China Vaccine Contract Manufacturing Industry Volume (K Unit) Forecast, by Application 2019 & 2032
- Table 73: Japan Vaccine Contract Manufacturing Industry Revenue (Million) Forecast, by Application 2019 & 2032
- Table 74: Japan Vaccine Contract Manufacturing Industry Volume (K Unit) Forecast, by Application 2019 & 2032
- Table 75: India Vaccine Contract Manufacturing Industry Revenue (Million) Forecast, by Application 2019 & 2032
- Table 76: India Vaccine Contract Manufacturing Industry Volume (K Unit) Forecast, by Application 2019 & 2032
- Table 77: Australia Vaccine Contract Manufacturing Industry Revenue (Million) Forecast, by Application 2019 & 2032
- Table 78: Australia Vaccine Contract Manufacturing Industry Volume (K Unit) Forecast, by Application 2019 & 2032
- Table 79: South Korea Vaccine Contract Manufacturing Industry Revenue (Million) Forecast, by Application 2019 & 2032
- Table 80: South Korea Vaccine Contract Manufacturing Industry Volume (K Unit) Forecast, by Application 2019 & 2032
- Table 81: Rest of Asia Pacific Vaccine Contract Manufacturing Industry Revenue (Million) Forecast, by Application 2019 & 2032
- Table 82: Rest of Asia Pacific Vaccine Contract Manufacturing Industry Volume (K Unit) Forecast, by Application 2019 & 2032
- Table 83: Global Vaccine Contract Manufacturing Industry Revenue Million Forecast, by Vaccine Type 2019 & 2032
- Table 84: Global Vaccine Contract Manufacturing Industry Volume K Unit Forecast, by Vaccine Type 2019 & 2032
- Table 85: Global Vaccine Contract Manufacturing Industry Revenue Million Forecast, by Process 2019 & 2032
- Table 86: Global Vaccine Contract Manufacturing Industry Volume K Unit Forecast, by Process 2019 & 2032
- Table 87: Global Vaccine Contract Manufacturing Industry Revenue Million Forecast, by Scale of Operations 2019 & 2032
- Table 88: Global Vaccine Contract Manufacturing Industry Volume K Unit Forecast, by Scale of Operations 2019 & 2032
- Table 89: Global Vaccine Contract Manufacturing Industry Revenue Million Forecast, by End Use 2019 & 2032
- Table 90: Global Vaccine Contract Manufacturing Industry Volume K Unit Forecast, by End Use 2019 & 2032
- Table 91: Global Vaccine Contract Manufacturing Industry Revenue Million Forecast, by Country 2019 & 2032
- Table 92: Global Vaccine Contract Manufacturing Industry Volume K Unit Forecast, by Country 2019 & 2032
- Table 93: GCC Vaccine Contract Manufacturing Industry Revenue (Million) Forecast, by Application 2019 & 2032
- Table 94: GCC Vaccine Contract Manufacturing Industry Volume (K Unit) Forecast, by Application 2019 & 2032
- Table 95: South Africa Vaccine Contract Manufacturing Industry Revenue (Million) Forecast, by Application 2019 & 2032
- Table 96: South Africa Vaccine Contract Manufacturing Industry Volume (K Unit) Forecast, by Application 2019 & 2032
- Table 97: Rest of Middle East and Africa Vaccine Contract Manufacturing Industry Revenue (Million) Forecast, by Application 2019 & 2032
- Table 98: Rest of Middle East and Africa Vaccine Contract Manufacturing Industry Volume (K Unit) Forecast, by Application 2019 & 2032
- Table 99: Global Vaccine Contract Manufacturing Industry Revenue Million Forecast, by Vaccine Type 2019 & 2032
- Table 100: Global Vaccine Contract Manufacturing Industry Volume K Unit Forecast, by Vaccine Type 2019 & 2032
- Table 101: Global Vaccine Contract Manufacturing Industry Revenue Million Forecast, by Process 2019 & 2032
- Table 102: Global Vaccine Contract Manufacturing Industry Volume K Unit Forecast, by Process 2019 & 2032
- Table 103: Global Vaccine Contract Manufacturing Industry Revenue Million Forecast, by Scale of Operations 2019 & 2032
- Table 104: Global Vaccine Contract Manufacturing Industry Volume K Unit Forecast, by Scale of Operations 2019 & 2032
- Table 105: Global Vaccine Contract Manufacturing Industry Revenue Million Forecast, by End Use 2019 & 2032
- Table 106: Global Vaccine Contract Manufacturing Industry Volume K Unit Forecast, by End Use 2019 & 2032
- Table 107: Global Vaccine Contract Manufacturing Industry Revenue Million Forecast, by Country 2019 & 2032
- Table 108: Global Vaccine Contract Manufacturing Industry Volume K Unit Forecast, by Country 2019 & 2032
- Table 109: Brazil Vaccine Contract Manufacturing Industry Revenue (Million) Forecast, by Application 2019 & 2032
- Table 110: Brazil Vaccine Contract Manufacturing Industry Volume (K Unit) Forecast, by Application 2019 & 2032
- Table 111: Argentina Vaccine Contract Manufacturing Industry Revenue (Million) Forecast, by Application 2019 & 2032
- Table 112: Argentina Vaccine Contract Manufacturing Industry Volume (K Unit) Forecast, by Application 2019 & 2032
- Table 113: Rest of South America Vaccine Contract Manufacturing Industry Revenue (Million) Forecast, by Application 2019 & 2032
- Table 114: Rest of South America Vaccine Contract Manufacturing Industry Volume (K Unit) Forecast, by Application 2019 & 2032
Frequently Asked Questions
1. What is the projected Compound Annual Growth Rate (CAGR) of the Vaccine Contract Manufacturing Industry?
The projected CAGR is approximately 11.18%.
2. Which companies are prominent players in the Vaccine Contract Manufacturing Industry?
Key companies in the market include CJ CheilJedang Corporation (Batavia Biosciences), Curia Global, ICON PLC, Charles River Laboratories International Inc, Catalent, IDT Biologika GmbH, Lonza Group AG, Gedeon Richter (Richter-Helm BioLogics), Ajinomoto Bio-Pharma Services, Recipharm AB, Emergent BioSolutions Inc, Fujifilm Holdings Corporation.
3. What are the main segments of the Vaccine Contract Manufacturing Industry?
The market segments include Vaccine Type, Process, Scale of Operations, End Use.
4. Can you provide details about the market size?
The market size is estimated to be USD 3.51 Million as of 2022.
5. What are some drivers contributing to market growth?
Advancements in Technology and Cost Benefits in Infrastructure and Operational Benefits; Increase in Initiatives Favoring Vaccinations; Favorable Patient Demographics and Growing Vaccinations of Newborns and Children.
6. What are the notable trends driving market growth?
The Inactivated Vaccines Segment is Expected to Hold a Significant Share in the Vaccine Contract Manufacturing Market over the Forecast Period.
7. Are there any restraints impacting market growth?
Rising High Costs of Vaccines; Lack of Storage Infrastructure and Limitations Associated with Supply Chain.
8. Can you provide examples of recent developments in the market?
August 2022: Moderna inked an agreement with the Canadian government to construct a messenger RNA vaccine manufacturing factory in an undetermined location in Canada. According to the biotech firm, the partnership will give Canadians access to mRNA vaccines made in Canada against respiratory viruses such as SARS-CoV-2, influenza, and respiratory syncytial virus.
9. What pricing options are available for accessing the report?
Pricing options include single-user, multi-user, and enterprise licenses priced at USD 4750, USD 5250, and USD 8750 respectively.
10. Is the market size provided in terms of value or volume?
The market size is provided in terms of value, measured in Million and volume, measured in K Unit.
11. Are there any specific market keywords associated with the report?
Yes, the market keyword associated with the report is "Vaccine Contract Manufacturing Industry," which aids in identifying and referencing the specific market segment covered.
12. How do I determine which pricing option suits my needs best?
The pricing options vary based on user requirements and access needs. Individual users may opt for single-user licenses, while businesses requiring broader access may choose multi-user or enterprise licenses for cost-effective access to the report.
13. Are there any additional resources or data provided in the Vaccine Contract Manufacturing Industry report?
While the report offers comprehensive insights, it's advisable to review the specific contents or supplementary materials provided to ascertain if additional resources or data are available.
14. How can I stay updated on further developments or reports in the Vaccine Contract Manufacturing Industry?
To stay informed about further developments, trends, and reports in the Vaccine Contract Manufacturing Industry, consider subscribing to industry newsletters, following relevant companies and organizations, or regularly checking reputable industry news sources and publications.
Methodology
Step 1 - Identification of Relevant Samples Size from Population Database


Step 2 - Approaches for Defining Global Market Size (Value, Volume* & Price*)

Note*: In applicable scenarios
Step 3 - Data Sources
Primary Research
- Web Analytics
- Survey Reports
- Research Institute
- Latest Research Reports
- Opinion Leaders
Secondary Research
- Annual Reports
- White Paper
- Latest Press Release
- Industry Association
- Paid Database
- Investor Presentations

Step 4 - Data Triangulation
Involves using different sources of information in order to increase the validity of a study
These sources are likely to be stakeholders in a program - participants, other researchers, program staff, other community members, and so on.
Then we put all data in single framework & apply various statistical tools to find out the dynamic on the market.
During the analysis stage, feedback from the stakeholder groups would be compared to determine areas of agreement as well as areas of divergence
