

Key Insights
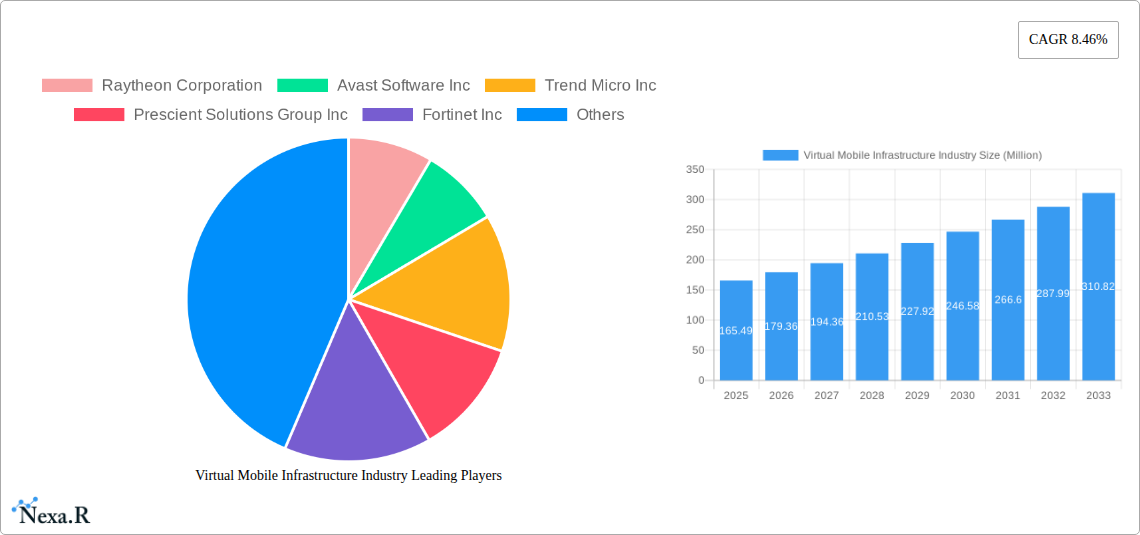
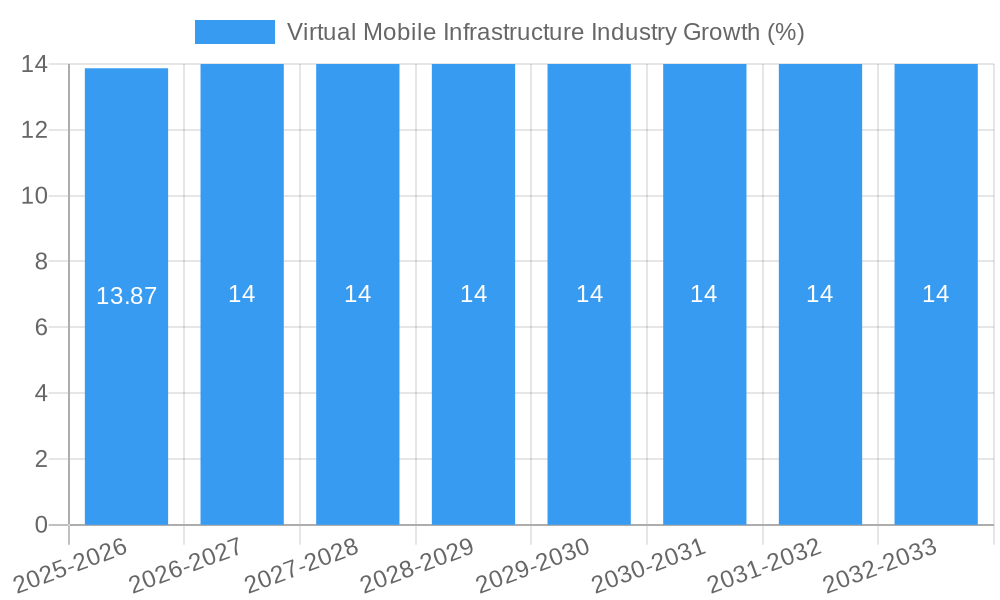
The Virtual Mobile Infrastructure (VMI) market is experiencing robust growth, projected to reach $165.49 million in 2025 and maintain a Compound Annual Growth Rate (CAGR) of 8.46% from 2025 to 2033. This expansion is driven by several key factors. Increasing demand for secure and flexible mobile solutions across various sectors, including BFSI (Banking, Financial Services, and Insurance), healthcare, and government, fuels adoption. The shift towards cloud-based deployments offers scalability and cost-effectiveness, further propelling market growth. Furthermore, the rising need for advanced security features to protect sensitive mobile data and the growing adoption of 5G technology are significant contributors. The market is segmented by deployment mode (on-premise and cloud) and end-user vertical, with the cloud segment anticipated to dominate due to its inherent advantages.
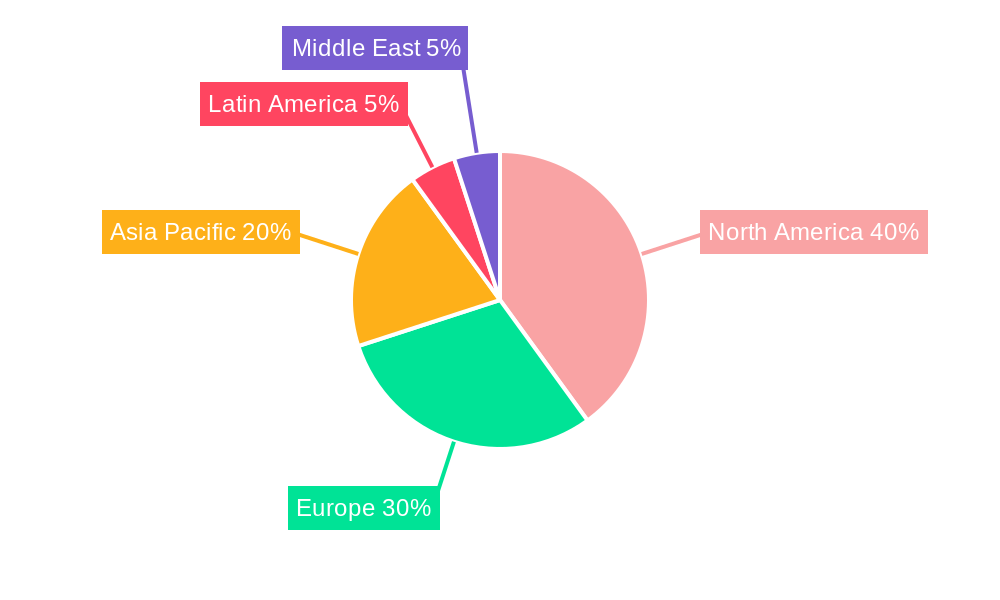
Competition in the VMI market is intense, with established players like Raytheon Corporation, Avast Software Inc., and Trend Micro Inc. alongside emerging companies like Prescient Solutions Group Inc. and Nubo Software Limited vying for market share. The North American market currently holds a significant portion of the global VMI market, followed by Europe and the Asia-Pacific region. However, developing economies in the Asia-Pacific region are expected to witness rapid growth, driven by increasing smartphone penetration and digital transformation initiatives. While some challenges exist, such as the complexity of integrating VMI solutions and the need for skilled professionals, the overall market outlook remains positive, indicating significant future growth potential. Ongoing technological advancements, particularly in areas like network virtualization and edge computing, will further shape the VMI landscape in the coming years.
Virtual Mobile Infrastructure (VMI) Industry Market Report: 2019-2033
This comprehensive report provides a deep dive into the Virtual Mobile Infrastructure (VMI) market, encompassing market dynamics, growth trends, regional analysis, competitive landscape, and future outlook. The study period covers 2019-2033, with 2025 as the base year and a forecast period of 2025-2033. This report is essential for industry professionals, investors, and strategic decision-makers seeking a complete understanding of this rapidly evolving sector. The parent market is the broader Telecommunications Infrastructure market, while the child market is specifically VMI solutions. The global market size is projected to reach xx Million by 2033.
Virtual Mobile Infrastructure Industry Market Dynamics & Structure
The VMI market is characterized by a moderately concentrated landscape with several key players vying for market share. Technological innovation, driven by advancements in cloud computing, 5G, and network virtualization, is a key growth driver. Regulatory frameworks governing data security and interoperability significantly influence market dynamics. Competitive substitutes include traditional mobile network infrastructure, but VMI offers advantages in terms of flexibility and scalability. The end-user demographics are diverse, spanning various industries, with a significant focus on BFSI and Government and Defense. M&A activity has been moderate, with several strategic acquisitions shaping the competitive landscape.
- Market Concentration: Moderately concentrated, with top 5 players holding approximately xx% of market share in 2025.
- Technological Innovation: Significant advancements in cloud computing, edge computing, and 5G driving market growth.
- Regulatory Framework: Stringent data privacy regulations and interoperability standards influencing market adoption.
- Competitive Substitutes: Traditional mobile network infrastructure poses a moderate competitive threat.
- End-User Demographics: BFSI, Government & Defense, Telecommunications & IT, and Healthcare are key end-user verticals.
- M&A Trends: Moderate M&A activity observed, primarily focused on strategic acquisitions and technology integration.
Virtual Mobile Infrastructure Industry Growth Trends & Insights
The VMI market has experienced robust growth over the historical period (2019-2024), driven by the increasing adoption of cloud-based solutions and the rising demand for flexible and scalable mobile infrastructure. The market size is projected to grow at a Compound Annual Growth Rate (CAGR) of xx% during the forecast period (2025-2033), reaching xx Million by 2033. Technological disruptions such as the widespread adoption of 5G and edge computing are accelerating market expansion. Consumer behavior shifts towards greater mobility and data consumption are fueling demand for efficient and cost-effective VMI solutions. Market penetration is expected to increase significantly across various sectors, especially in developing economies.
Dominant Regions, Countries, or Segments in Virtual Mobile Infrastructure Industry
North America currently holds the largest market share in the VMI industry, driven by early adoption of advanced technologies and a robust telecommunications infrastructure. The significant investments in 5G infrastructure and the presence of key players contribute to its dominance. However, the Asia-Pacific region is anticipated to exhibit the highest growth rate during the forecast period due to rising smartphone penetration, increasing digitalization, and favorable government policies. Within deployment modes, the cloud segment is projected to experience substantial growth, fueled by its scalability and cost-effectiveness. In terms of end-user verticals, BFSI and Government & Defense are leading the market, driven by increasing demand for secure and reliable mobile communication.
- North America: High market share driven by early adoption and robust infrastructure.
- Asia-Pacific: Highest growth potential due to increasing digitalization and favorable government policies.
- Cloud Deployment: Fastest-growing deployment mode due to scalability and cost-effectiveness.
- BFSI & Government & Defense: Leading end-user verticals due to high security and reliability requirements.
Virtual Mobile Infrastructure Industry Product Landscape
The VMI product landscape is characterized by a range of solutions tailored to specific industry needs. These include virtualized core networks, virtualized RAN (Radio Access Network), and various security and management tools. Key performance indicators (KPIs) focus on network latency, bandwidth, security, and scalability. Unique selling propositions often center on reduced operational costs, improved agility, and enhanced security features compared to traditional infrastructure. Continuous advancements in virtualization technologies and network functions virtualization (NFV) are driving product innovation.
Key Drivers, Barriers & Challenges in Virtual Mobile Infrastructure Industry
Key Drivers: Increasing demand for flexible and scalable mobile infrastructure, growing adoption of cloud computing and 5G, rising data consumption, and government initiatives promoting digital transformation. The cost-effectiveness of VMI compared to traditional networks is also a major driver.
Key Challenges: High initial investment costs for network virtualization, security concerns related to data breaches, lack of skilled professionals, and interoperability issues between different vendors' solutions. These challenges are estimated to impact market growth by approximately xx% by 2030.
Emerging Opportunities in Virtual Mobile Infrastructure Industry
Untapped markets in developing economies present significant opportunities. The increasing adoption of IoT devices and the rise of edge computing are creating new application areas. Furthermore, evolving consumer preferences for seamless connectivity and personalized mobile experiences are driving innovation. The development of VMI solutions optimized for specific vertical markets also presents lucrative growth opportunities.
Growth Accelerators in the Virtual Mobile Infrastructure Industry Industry
Technological advancements such as AI-powered network optimization and the development of more robust security features are accelerating market growth. Strategic partnerships between VMI providers and telecom operators are streamlining market entry and adoption. Expansion into new geographical markets and vertical industries is broadening the market's reach.
Key Players Shaping the Virtual Mobile Infrastructure Industry Market
- Raytheon Corporation
- Avast Software Inc
- Trend Micro Inc
- Prescient Solutions Group Inc
- Fortinet Inc
- Intelligent Waves LLC
- Genymobile SAS
- Nubo Software Limited
- Pulse Secure LLC
- Sierraware LLC
Notable Milestones in Virtual Mobile Infrastructure Industry Sector
- January 2023: Indigo AG and MTEL strengthen cooperation, integrating cybersecurity solutions into MTEL's MVNO platform, enhancing user security.
- December 2022: Grover partners with Gigs to launch Grover Connect, an MVNO service for tech rental consumers, expanding VMI adoption in the consumer market.
In-Depth Virtual Mobile Infrastructure Industry Market Outlook
The VMI market is poised for significant growth, driven by ongoing technological innovations, expanding applications, and increasing demand for flexible and scalable mobile infrastructure. Strategic partnerships and market expansion initiatives will play a key role in shaping the future of the industry. The market presents significant opportunities for both established players and new entrants, particularly those focused on innovative solutions tailored to specific industry needs.
Virtual Mobile Infrastructure Industry Segmentation
-
1. Deployment Mode
- 1.1. On-Premise
- 1.2. Cloud
-
2. End-user Vertical
- 2.1. BFSi
- 2.2. Healthcare
- 2.3. Government and Defense
- 2.4. Telecommunications and IT
- 2.5. Manufacturing
- 2.6. Other End-User Verticals
Virtual Mobile Infrastructure Industry Segmentation By Geography
- 1. North America
- 2. Europe
- 3. Asia Pacific
- 4. Latin America
- 5. Middle East
Virtual Mobile Infrastructure Industry REPORT HIGHLIGHTS
| Aspects | Details |
|---|---|
| Study Period | 2019-2033 |
| Base Year | 2024 |
| Estimated Year | 2025 |
| Forecast Period | 2025-2033 |
| Historical Period | 2019-2024 |
| Growth Rate | CAGR of 8.46% from 2019-2033 |
| Segmentation |
|
Table of Contents
- 1. Introduction
- 1.1. Research Scope
- 1.2. Market Segmentation
- 1.3. Research Methodology
- 1.4. Definitions and Assumptions
- 2. Executive Summary
- 2.1. Introduction
- 3. Market Dynamics
- 3.1. Introduction
- 3.2. Market Drivers
- 3.2.1. Increase in Smartphone Penetration; Need to Increase the Productivity of Employees; Reduced Hardware and Operating Cost Using VMI
- 3.3. Market Restrains
- 3.3.1. Android Application Compatibility and Technical Issues
- 3.4. Market Trends
- 3.4.1. Cloud Segment is Expected to Grow Significantly
- 4. Market Factor Analysis
- 4.1. Porters Five Forces
- 4.2. Supply/Value Chain
- 4.3. PESTEL analysis
- 4.4. Market Entropy
- 4.5. Patent/Trademark Analysis
- 5. Global Virtual Mobile Infrastructure Industry Analysis, Insights and Forecast, 2019-2031
- 5.1. Market Analysis, Insights and Forecast - by Deployment Mode
- 5.1.1. On-Premise
- 5.1.2. Cloud
- 5.2. Market Analysis, Insights and Forecast - by End-user Vertical
- 5.2.1. BFSi
- 5.2.2. Healthcare
- 5.2.3. Government and Defense
- 5.2.4. Telecommunications and IT
- 5.2.5. Manufacturing
- 5.2.6. Other End-User Verticals
- 5.3. Market Analysis, Insights and Forecast - by Region
- 5.3.1. North America
- 5.3.2. Europe
- 5.3.3. Asia Pacific
- 5.3.4. Latin America
- 5.3.5. Middle East
- 5.1. Market Analysis, Insights and Forecast - by Deployment Mode
- 6. North America Virtual Mobile Infrastructure Industry Analysis, Insights and Forecast, 2019-2031
- 6.1. Market Analysis, Insights and Forecast - by Deployment Mode
- 6.1.1. On-Premise
- 6.1.2. Cloud
- 6.2. Market Analysis, Insights and Forecast - by End-user Vertical
- 6.2.1. BFSi
- 6.2.2. Healthcare
- 6.2.3. Government and Defense
- 6.2.4. Telecommunications and IT
- 6.2.5. Manufacturing
- 6.2.6. Other End-User Verticals
- 6.1. Market Analysis, Insights and Forecast - by Deployment Mode
- 7. Europe Virtual Mobile Infrastructure Industry Analysis, Insights and Forecast, 2019-2031
- 7.1. Market Analysis, Insights and Forecast - by Deployment Mode
- 7.1.1. On-Premise
- 7.1.2. Cloud
- 7.2. Market Analysis, Insights and Forecast - by End-user Vertical
- 7.2.1. BFSi
- 7.2.2. Healthcare
- 7.2.3. Government and Defense
- 7.2.4. Telecommunications and IT
- 7.2.5. Manufacturing
- 7.2.6. Other End-User Verticals
- 7.1. Market Analysis, Insights and Forecast - by Deployment Mode
- 8. Asia Pacific Virtual Mobile Infrastructure Industry Analysis, Insights and Forecast, 2019-2031
- 8.1. Market Analysis, Insights and Forecast - by Deployment Mode
- 8.1.1. On-Premise
- 8.1.2. Cloud
- 8.2. Market Analysis, Insights and Forecast - by End-user Vertical
- 8.2.1. BFSi
- 8.2.2. Healthcare
- 8.2.3. Government and Defense
- 8.2.4. Telecommunications and IT
- 8.2.5. Manufacturing
- 8.2.6. Other End-User Verticals
- 8.1. Market Analysis, Insights and Forecast - by Deployment Mode
- 9. Latin America Virtual Mobile Infrastructure Industry Analysis, Insights and Forecast, 2019-2031
- 9.1. Market Analysis, Insights and Forecast - by Deployment Mode
- 9.1.1. On-Premise
- 9.1.2. Cloud
- 9.2. Market Analysis, Insights and Forecast - by End-user Vertical
- 9.2.1. BFSi
- 9.2.2. Healthcare
- 9.2.3. Government and Defense
- 9.2.4. Telecommunications and IT
- 9.2.5. Manufacturing
- 9.2.6. Other End-User Verticals
- 9.1. Market Analysis, Insights and Forecast - by Deployment Mode
- 10. Middle East Virtual Mobile Infrastructure Industry Analysis, Insights and Forecast, 2019-2031
- 10.1. Market Analysis, Insights and Forecast - by Deployment Mode
- 10.1.1. On-Premise
- 10.1.2. Cloud
- 10.2. Market Analysis, Insights and Forecast - by End-user Vertical
- 10.2.1. BFSi
- 10.2.2. Healthcare
- 10.2.3. Government and Defense
- 10.2.4. Telecommunications and IT
- 10.2.5. Manufacturing
- 10.2.6. Other End-User Verticals
- 10.1. Market Analysis, Insights and Forecast - by Deployment Mode
- 11. North America Virtual Mobile Infrastructure Industry Analysis, Insights and Forecast, 2019-2031
- 11.1. Market Analysis, Insights and Forecast - By Country/Sub-region
- 11.1.1.
- 12. Europe Virtual Mobile Infrastructure Industry Analysis, Insights and Forecast, 2019-2031
- 12.1. Market Analysis, Insights and Forecast - By Country/Sub-region
- 12.1.1.
- 13. Asia Pacific Virtual Mobile Infrastructure Industry Analysis, Insights and Forecast, 2019-2031
- 13.1. Market Analysis, Insights and Forecast - By Country/Sub-region
- 13.1.1.
- 14. Latin America Virtual Mobile Infrastructure Industry Analysis, Insights and Forecast, 2019-2031
- 14.1. Market Analysis, Insights and Forecast - By Country/Sub-region
- 14.1.1.
- 15. Middle East Virtual Mobile Infrastructure Industry Analysis, Insights and Forecast, 2019-2031
- 15.1. Market Analysis, Insights and Forecast - By Country/Sub-region
- 15.1.1.
- 16. Competitive Analysis
- 16.1. Global Market Share Analysis 2024
- 16.2. Company Profiles
- 16.2.1 Raytheon Corporation
- 16.2.1.1. Overview
- 16.2.1.2. Products
- 16.2.1.3. SWOT Analysis
- 16.2.1.4. Recent Developments
- 16.2.1.5. Financials (Based on Availability)
- 16.2.2 Avast Software Inc
- 16.2.2.1. Overview
- 16.2.2.2. Products
- 16.2.2.3. SWOT Analysis
- 16.2.2.4. Recent Developments
- 16.2.2.5. Financials (Based on Availability)
- 16.2.3 Trend Micro Inc
- 16.2.3.1. Overview
- 16.2.3.2. Products
- 16.2.3.3. SWOT Analysis
- 16.2.3.4. Recent Developments
- 16.2.3.5. Financials (Based on Availability)
- 16.2.4 Prescient Solutions Group Inc
- 16.2.4.1. Overview
- 16.2.4.2. Products
- 16.2.4.3. SWOT Analysis
- 16.2.4.4. Recent Developments
- 16.2.4.5. Financials (Based on Availability)
- 16.2.5 Fortinet Inc
- 16.2.5.1. Overview
- 16.2.5.2. Products
- 16.2.5.3. SWOT Analysis
- 16.2.5.4. Recent Developments
- 16.2.5.5. Financials (Based on Availability)
- 16.2.6 Intelligent Waves LLC
- 16.2.6.1. Overview
- 16.2.6.2. Products
- 16.2.6.3. SWOT Analysis
- 16.2.6.4. Recent Developments
- 16.2.6.5. Financials (Based on Availability)
- 16.2.7 Genymobile SAS*List Not Exhaustive
- 16.2.7.1. Overview
- 16.2.7.2. Products
- 16.2.7.3. SWOT Analysis
- 16.2.7.4. Recent Developments
- 16.2.7.5. Financials (Based on Availability)
- 16.2.8 Nubo Software Limited
- 16.2.8.1. Overview
- 16.2.8.2. Products
- 16.2.8.3. SWOT Analysis
- 16.2.8.4. Recent Developments
- 16.2.8.5. Financials (Based on Availability)
- 16.2.9 Pulse Secure LLC
- 16.2.9.1. Overview
- 16.2.9.2. Products
- 16.2.9.3. SWOT Analysis
- 16.2.9.4. Recent Developments
- 16.2.9.5. Financials (Based on Availability)
- 16.2.10 Sierraware LLC
- 16.2.10.1. Overview
- 16.2.10.2. Products
- 16.2.10.3. SWOT Analysis
- 16.2.10.4. Recent Developments
- 16.2.10.5. Financials (Based on Availability)
- 16.2.1 Raytheon Corporation
List of Figures
- Figure 1: Global Virtual Mobile Infrastructure Industry Revenue Breakdown (Million, %) by Region 2024 & 2032
- Figure 2: North America Virtual Mobile Infrastructure Industry Revenue (Million), by Country 2024 & 2032
- Figure 3: North America Virtual Mobile Infrastructure Industry Revenue Share (%), by Country 2024 & 2032
- Figure 4: Europe Virtual Mobile Infrastructure Industry Revenue (Million), by Country 2024 & 2032
- Figure 5: Europe Virtual Mobile Infrastructure Industry Revenue Share (%), by Country 2024 & 2032
- Figure 6: Asia Pacific Virtual Mobile Infrastructure Industry Revenue (Million), by Country 2024 & 2032
- Figure 7: Asia Pacific Virtual Mobile Infrastructure Industry Revenue Share (%), by Country 2024 & 2032
- Figure 8: Latin America Virtual Mobile Infrastructure Industry Revenue (Million), by Country 2024 & 2032
- Figure 9: Latin America Virtual Mobile Infrastructure Industry Revenue Share (%), by Country 2024 & 2032
- Figure 10: Middle East Virtual Mobile Infrastructure Industry Revenue (Million), by Country 2024 & 2032
- Figure 11: Middle East Virtual Mobile Infrastructure Industry Revenue Share (%), by Country 2024 & 2032
- Figure 12: North America Virtual Mobile Infrastructure Industry Revenue (Million), by Deployment Mode 2024 & 2032
- Figure 13: North America Virtual Mobile Infrastructure Industry Revenue Share (%), by Deployment Mode 2024 & 2032
- Figure 14: North America Virtual Mobile Infrastructure Industry Revenue (Million), by End-user Vertical 2024 & 2032
- Figure 15: North America Virtual Mobile Infrastructure Industry Revenue Share (%), by End-user Vertical 2024 & 2032
- Figure 16: North America Virtual Mobile Infrastructure Industry Revenue (Million), by Country 2024 & 2032
- Figure 17: North America Virtual Mobile Infrastructure Industry Revenue Share (%), by Country 2024 & 2032
- Figure 18: Europe Virtual Mobile Infrastructure Industry Revenue (Million), by Deployment Mode 2024 & 2032
- Figure 19: Europe Virtual Mobile Infrastructure Industry Revenue Share (%), by Deployment Mode 2024 & 2032
- Figure 20: Europe Virtual Mobile Infrastructure Industry Revenue (Million), by End-user Vertical 2024 & 2032
- Figure 21: Europe Virtual Mobile Infrastructure Industry Revenue Share (%), by End-user Vertical 2024 & 2032
- Figure 22: Europe Virtual Mobile Infrastructure Industry Revenue (Million), by Country 2024 & 2032
- Figure 23: Europe Virtual Mobile Infrastructure Industry Revenue Share (%), by Country 2024 & 2032
- Figure 24: Asia Pacific Virtual Mobile Infrastructure Industry Revenue (Million), by Deployment Mode 2024 & 2032
- Figure 25: Asia Pacific Virtual Mobile Infrastructure Industry Revenue Share (%), by Deployment Mode 2024 & 2032
- Figure 26: Asia Pacific Virtual Mobile Infrastructure Industry Revenue (Million), by End-user Vertical 2024 & 2032
- Figure 27: Asia Pacific Virtual Mobile Infrastructure Industry Revenue Share (%), by End-user Vertical 2024 & 2032
- Figure 28: Asia Pacific Virtual Mobile Infrastructure Industry Revenue (Million), by Country 2024 & 2032
- Figure 29: Asia Pacific Virtual Mobile Infrastructure Industry Revenue Share (%), by Country 2024 & 2032
- Figure 30: Latin America Virtual Mobile Infrastructure Industry Revenue (Million), by Deployment Mode 2024 & 2032
- Figure 31: Latin America Virtual Mobile Infrastructure Industry Revenue Share (%), by Deployment Mode 2024 & 2032
- Figure 32: Latin America Virtual Mobile Infrastructure Industry Revenue (Million), by End-user Vertical 2024 & 2032
- Figure 33: Latin America Virtual Mobile Infrastructure Industry Revenue Share (%), by End-user Vertical 2024 & 2032
- Figure 34: Latin America Virtual Mobile Infrastructure Industry Revenue (Million), by Country 2024 & 2032
- Figure 35: Latin America Virtual Mobile Infrastructure Industry Revenue Share (%), by Country 2024 & 2032
- Figure 36: Middle East Virtual Mobile Infrastructure Industry Revenue (Million), by Deployment Mode 2024 & 2032
- Figure 37: Middle East Virtual Mobile Infrastructure Industry Revenue Share (%), by Deployment Mode 2024 & 2032
- Figure 38: Middle East Virtual Mobile Infrastructure Industry Revenue (Million), by End-user Vertical 2024 & 2032
- Figure 39: Middle East Virtual Mobile Infrastructure Industry Revenue Share (%), by End-user Vertical 2024 & 2032
- Figure 40: Middle East Virtual Mobile Infrastructure Industry Revenue (Million), by Country 2024 & 2032
- Figure 41: Middle East Virtual Mobile Infrastructure Industry Revenue Share (%), by Country 2024 & 2032
List of Tables
- Table 1: Global Virtual Mobile Infrastructure Industry Revenue Million Forecast, by Region 2019 & 2032
- Table 2: Global Virtual Mobile Infrastructure Industry Revenue Million Forecast, by Deployment Mode 2019 & 2032
- Table 3: Global Virtual Mobile Infrastructure Industry Revenue Million Forecast, by End-user Vertical 2019 & 2032
- Table 4: Global Virtual Mobile Infrastructure Industry Revenue Million Forecast, by Region 2019 & 2032
- Table 5: Global Virtual Mobile Infrastructure Industry Revenue Million Forecast, by Country 2019 & 2032
- Table 6: Virtual Mobile Infrastructure Industry Revenue (Million) Forecast, by Application 2019 & 2032
- Table 7: Global Virtual Mobile Infrastructure Industry Revenue Million Forecast, by Country 2019 & 2032
- Table 8: Virtual Mobile Infrastructure Industry Revenue (Million) Forecast, by Application 2019 & 2032
- Table 9: Global Virtual Mobile Infrastructure Industry Revenue Million Forecast, by Country 2019 & 2032
- Table 10: Virtual Mobile Infrastructure Industry Revenue (Million) Forecast, by Application 2019 & 2032
- Table 11: Global Virtual Mobile Infrastructure Industry Revenue Million Forecast, by Country 2019 & 2032
- Table 12: Virtual Mobile Infrastructure Industry Revenue (Million) Forecast, by Application 2019 & 2032
- Table 13: Global Virtual Mobile Infrastructure Industry Revenue Million Forecast, by Country 2019 & 2032
- Table 14: Virtual Mobile Infrastructure Industry Revenue (Million) Forecast, by Application 2019 & 2032
- Table 15: Global Virtual Mobile Infrastructure Industry Revenue Million Forecast, by Deployment Mode 2019 & 2032
- Table 16: Global Virtual Mobile Infrastructure Industry Revenue Million Forecast, by End-user Vertical 2019 & 2032
- Table 17: Global Virtual Mobile Infrastructure Industry Revenue Million Forecast, by Country 2019 & 2032
- Table 18: Global Virtual Mobile Infrastructure Industry Revenue Million Forecast, by Deployment Mode 2019 & 2032
- Table 19: Global Virtual Mobile Infrastructure Industry Revenue Million Forecast, by End-user Vertical 2019 & 2032
- Table 20: Global Virtual Mobile Infrastructure Industry Revenue Million Forecast, by Country 2019 & 2032
- Table 21: Global Virtual Mobile Infrastructure Industry Revenue Million Forecast, by Deployment Mode 2019 & 2032
- Table 22: Global Virtual Mobile Infrastructure Industry Revenue Million Forecast, by End-user Vertical 2019 & 2032
- Table 23: Global Virtual Mobile Infrastructure Industry Revenue Million Forecast, by Country 2019 & 2032
- Table 24: Global Virtual Mobile Infrastructure Industry Revenue Million Forecast, by Deployment Mode 2019 & 2032
- Table 25: Global Virtual Mobile Infrastructure Industry Revenue Million Forecast, by End-user Vertical 2019 & 2032
- Table 26: Global Virtual Mobile Infrastructure Industry Revenue Million Forecast, by Country 2019 & 2032
- Table 27: Global Virtual Mobile Infrastructure Industry Revenue Million Forecast, by Deployment Mode 2019 & 2032
- Table 28: Global Virtual Mobile Infrastructure Industry Revenue Million Forecast, by End-user Vertical 2019 & 2032
- Table 29: Global Virtual Mobile Infrastructure Industry Revenue Million Forecast, by Country 2019 & 2032
Frequently Asked Questions
1. What is the projected Compound Annual Growth Rate (CAGR) of the Virtual Mobile Infrastructure Industry?
The projected CAGR is approximately 8.46%.
2. Which companies are prominent players in the Virtual Mobile Infrastructure Industry?
Key companies in the market include Raytheon Corporation, Avast Software Inc, Trend Micro Inc, Prescient Solutions Group Inc, Fortinet Inc, Intelligent Waves LLC, Genymobile SAS*List Not Exhaustive, Nubo Software Limited, Pulse Secure LLC, Sierraware LLC.
3. What are the main segments of the Virtual Mobile Infrastructure Industry?
The market segments include Deployment Mode, End-user Vertical.
4. Can you provide details about the market size?
The market size is estimated to be USD 165.49 Million as of 2022.
5. What are some drivers contributing to market growth?
Increase in Smartphone Penetration; Need to Increase the Productivity of Employees; Reduced Hardware and Operating Cost Using VMI.
6. What are the notable trends driving market growth?
Cloud Segment is Expected to Grow Significantly.
7. Are there any restraints impacting market growth?
Android Application Compatibility and Technical Issues.
8. Can you provide examples of recent developments in the market?
January 2023: Indigo AG, a European and global provider of intelligent cybersecurity solutions and BSS/OSS platform services for the telecoms industry, and MTEL, a globally active MVNO and member of the Telekom Srbija Group, are strengthening their current cooperation. MTEL already employs cyan AG's subsidiary i-new's MVNO platform in the DACH region. The collaboration has now been extended to Blue Group's network-integrated cybersecurity solutions, allowing MTEL users to access the Internet in a safe and unburdened manner in the future.
9. What pricing options are available for accessing the report?
Pricing options include single-user, multi-user, and enterprise licenses priced at USD 4750, USD 5250, and USD 8750 respectively.
10. Is the market size provided in terms of value or volume?
The market size is provided in terms of value, measured in Million.
11. Are there any specific market keywords associated with the report?
Yes, the market keyword associated with the report is "Virtual Mobile Infrastructure Industry," which aids in identifying and referencing the specific market segment covered.
12. How do I determine which pricing option suits my needs best?
The pricing options vary based on user requirements and access needs. Individual users may opt for single-user licenses, while businesses requiring broader access may choose multi-user or enterprise licenses for cost-effective access to the report.
13. Are there any additional resources or data provided in the Virtual Mobile Infrastructure Industry report?
While the report offers comprehensive insights, it's advisable to review the specific contents or supplementary materials provided to ascertain if additional resources or data are available.
14. How can I stay updated on further developments or reports in the Virtual Mobile Infrastructure Industry?
To stay informed about further developments, trends, and reports in the Virtual Mobile Infrastructure Industry, consider subscribing to industry newsletters, following relevant companies and organizations, or regularly checking reputable industry news sources and publications.
Methodology
Step 1 - Identification of Relevant Samples Size from Population Database


Step 2 - Approaches for Defining Global Market Size (Value, Volume* & Price*)

Note*: In applicable scenarios
Step 3 - Data Sources
Primary Research
- Web Analytics
- Survey Reports
- Research Institute
- Latest Research Reports
- Opinion Leaders
Secondary Research
- Annual Reports
- White Paper
- Latest Press Release
- Industry Association
- Paid Database
- Investor Presentations

Step 4 - Data Triangulation
Involves using different sources of information in order to increase the validity of a study
These sources are likely to be stakeholders in a program - participants, other researchers, program staff, other community members, and so on.
Then we put all data in single framework & apply various statistical tools to find out the dynamic on the market.
During the analysis stage, feedback from the stakeholder groups would be compared to determine areas of agreement as well as areas of divergence
